The Hydropunch An in situ sampling tool for collecting ground water from unconsolidated sediments
航海英语3800带翻译第7章

2101 If not attached to nozzle, each low-velocity spray applicator on a vessel must be stowed ______.A.In a protected area on the main deck.B.Inside a machinery space near the entrance.C.D.On a rack inside the quarters near the entrance.假如没有被接上管子,船上的每一个低速喷嘴均必须被存储被用于接上灭火水龙带的消防栓旁边。
2102 If heavy smoke is coming from the paint locker, the first firefighting response should be to ______.A. Release the CO2 flooding system.B. Open the door to evaluate the extent of the fire.C. Enter and use a portable extinguisher.D.假如烟从油漆间冒出,救火的第一响应应是。
2103 If a vessel lists to port, the center of buoyancy will ______.A.B. Move to starboard.C. Move directly down.D. Stay in the same position.假如船舶左倾,浮心将。
2104 If a spill occurs, where would you log it?A. Oil record book.B. Bell book.C. Smooth logbook.D.假如发生逸漏污染,将记录在什么地方?2105 If a ship will call at four ports for discharging, i.e. A, B, C and D consecutively, the cargo for ______ must generally be loaded first.A. Port A.B. Port B.C. Port C.D.假如船舶将连续挂靠四个港口A,B,C和D,则的货物通常必须被先装。
眼科常用英文缩略语名词解释

中华实验眼科杂志 2〇2!年 4 月第 39 卷第 4 期Chin J Exp Ophthalmol,April 2021,Vol. 39,No. 4• 279 •interleukin 8. C-X-C chemokines present in proliferative diabetic retinopathy[J]. Arch O p h t halmol, 1998,116( 12) : 1597-1601. D O I:10. 1001/archopht. 116. 12. 1597.[17] W a n g JJ, Klein R, Smith W, et al. Cataract surgery and the 5-yearincidence of late-stage age-related maculopathy : pooled findings from the Beaver D a m and Blue Mountains eye studies [J]. Ophthalmology,2003,110(10) : 1960-1967. D O I:10. 1016/s0161-6420(03)00816-9. [18] Patel JI. Is cataract surgery a risk factor for progression of maculardegeneration? [J] . Curr Opi n O p h t halmol,2007,18( 1) : 9 -12. D O I:10. 1097/I C U.O b013e3280112a O f.[19] Muether P S,N e u h a n n I, Buhl C,et al. Intraocular growth factors andcytokines in patients with dry and neovascular age-related macular degeneration[ J]. Retina,2013,33( 9 ): 1809- 1814. D O I: 10. 1097/I A E.0b013e318285c d9e.[20] M i m u r a T,Funatsu H,N o m a H,et al. Aq u e o u s hu m o r levels ofcytokines in patients with age-related macular degeneration [ J ].Ophthalmologica,2019,241 (2): 81-89. D O I:10. 1159/000490153.[21 ]Srinivasan B, Leung H Y,C a o H,e t al. M o d e r n phacoemulsification andintraocular lens implantation ( refractive lens exchange )is safe and effective in treating high myopia[J]. Asia Pac J Ophthalmol ( Phila), 2016,5(6) :438-444. D O I:10. 1097/A P O.0000000000000241.[22]Boscia F,Giancipoli E,D'A m i c o Ricci G,et al. M a n a g e m e n t of macularo e d e m a in diabetic patients undergoing cataract surgery [J]. Curr O pin Ophthalmol, 2017, 28 ( 1) :23 -28. D O I:10. 1097/ICU.0000000000000328.[23 ]Hirota A,Yasu d a K,Morita S,et al. Clinical and experimentalevaluation of n e w back-flow hydrodissection technique [ J ]. J Cataract Refract S u r g,2019,45( 9 ): 1280- 1284. D O I: 10. 1016/j. jcrs. 2019.05.016.(收稿日期:2020-10-14修回日期:2021-03-05)(本文编辑:尹卫靖刘艳)读者•作者•编者眼科常用英文缩略语名词解释A M D:年龄相关性黄斑变性(age-related m acular d eg en eratio n)A N O V A:单因素方差分析(one-w ay analysis of v arian ce)B U T:泪膜破裂时间(b reak u p tim e of tear film)D R:糖尿病视网膜病变(d iab etic retin o p ath y)EAU:实验性自身免疫性葡萄膜炎(experimental autoimmune uveitis) E G F:表皮生长因子(epiderm al growth facto r)E L IS A:酶联免疫吸附测定(enzym e-linked im m unosorbent a s sa y)E R G:视网膜电图(electro re tin o g ram)F F A:突光素眼底血管造影(fundus fluorescein angiography)F G F:成纤维细胞生长因子(fibroblast growth factor )G F P:绿色焚光蛋白(green fluorescent p ro te in)IFN-*y:"y 干扰素(in terfero n-"y)IL:白细胞介素(in te rle u k in)IO L:人工晶状体(in trao cu lar le n s)IRBP:光间受体视黄类物质结合蛋白(interphotoreceptor retinoid binding p ro te in)L A SIK:准分子激光角膜原位磨镶术(laser in situ k erato m ileu sis) ICG A:卩引探菁绿血管造影(indocyanine green angiography)L E C s:晶状体上皮细胞(len s ep ith elial c e lls)m iR N A:i t/h R N A(m icro R N A)M M P:基质金属蛋白酶(m atrix m etallo p ro te in a se)m T O R:B甫乳动物类雷帕霉素粑蛋白(m am m alian target of rap am y cin)M T T:四甲基偶氣挫盐(m ethyl thiazolyl tetrazo liu m)N F:核转录因子(n u clear facto r)O C T:光相干断层扫描(optical coheren ce tom ography)O R:优势比(odds ra tio)P A C G:原发性闭角型青光眼(prim ary angle-clo su re g lau co m a) P C R:聚合酶链式反应(polym erase ch ain re a c tio n)R G C s:视网膜节细胞(retin al ganglion c e lls)P O A G:原发性开角型青光眼(prim ary open angle g lau co m a) RB:视网膜母细胞瘤(retin o b lasto m a)R P E:视网膜色素上皮(retin al pigm ent e p ith e liu m)RNV:视网膜新生血管(retin al n eo v ascu larizatio n)R P:视网膜色素变性(retin itis p ig m en to sa)5 11:基础泪液分泌试验(5〇;1111'11161'11681)sh R N A:小发夹 R N A(short h airpin R N A)siR N A:小干扰 RN A(sm a ll interfering R N A)a-S M A:a-平滑肌肌动蛋白(ot-smooth m uscle a c tin)TAO:甲状腺相关眼病(thyroid-associated ophthalm opathy)T G F:转化生长因子(transform ing growth facto r)T N F:肿瘤坏死因子(tum or necrosis fa c to r)UBM:超声生物显微镜(u ltrasound b io m icro sco p e)V E G F:血管内皮生长因子(v ascu lar endothelial growth fa c to r) V E P:视觉诱发电位(v isu al evoked p o te n tia l)本期英文缩略语名词解释m iR-125b:微小 RNA 125b(m ic ro R N A 125b)siR N A-Y A P l :小干扰 R N A-Y es 相关蛋白 1( sm all interfering R N A-Y es-associated protein 1)T G F-p2:转化生长因子 p2(transform ing growth factor-p2)IO L:人工晶状体(in tra o cu lar le n s)(本刊编辑部)。
高级阅读No Signposts in the Sea海上无航标 原文+翻译+生词注解+修辞赏析
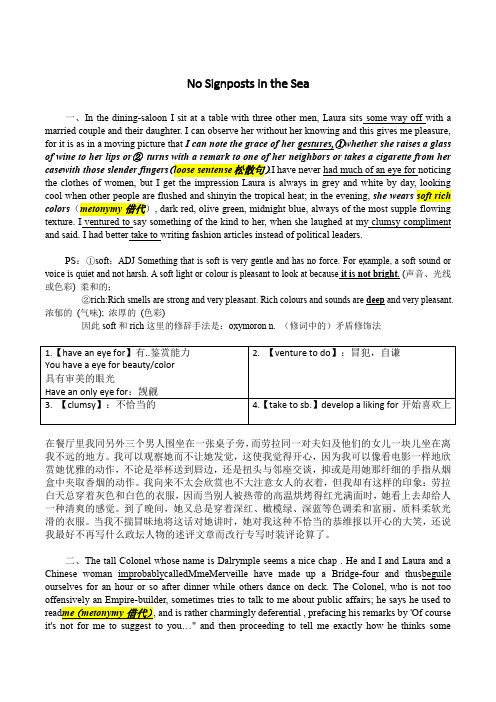
No Signposts in the Sea一、In the dining-saloon I sit at a table with three other men, Laura sits some way off with a married couple and their daughter. I can observe her without her knowing and this gives me pleasure, for it is as in a moving picture that I can note the grace of her gestures,①whether she raises a glass of wine to her lips or②turns with a remark to one of her neighbors or takes a cigarette from her casewith those slender fingers(loose sentense松散句).I have never had much of an eye for noticing the clothes of women, but I get the impression Laura is always in grey and white by day, looking cool when other people are flushed and shinyin the tropical heat; in the evening, she wears soft rich colors(metonymy借代), dark red, olive green, midnight blue, always of the most supple flowing texture. I ventured to say something of the kind to her, when she laughed at my clumsy compliment and said. I had better take to writing fashion articles instead of political leaders.PS:①soft:ADJ Something that is soft is very gentle and has no force. For example, a soft sound or voice is quiet and not harsh. A soft light or colour is pleasant to look at because it is not bright. (声音、光线或色彩) 柔和的;②rich:Rich smells are strong and very pleasant. Rich colours and sounds are deep and very pleasant. 浓郁的(气味); 浓厚的(色彩)因此soft和rich这里的修辞手法是:oxymoron n. (修词中的)矛盾修饰法在餐厅里我同另外三个男人围坐在一张桌子旁,而劳拉同一对夫妇及他们的女儿一块儿坐在离我不远的地方。
Merox工艺在运输燃油超低硫时代所扮演的角色(英文)

The Role of the Merox™ Process in the Era of Ultra Low SulfurTransportation Fuels5th EMEA Catalyst Technology Conference3 &4 March 2004Dennis SullivanUOP LLCThe specifications for transportation fuels, specifically gasoline and diesel, are changing significantly on a worldwide basis in this decade. In Europe and Japan by 2009, the sulfur content of gasoline must be reduced to less than 10 wppm. In the US by 2006, the sulfur content of gasoline must be reduced to less than 30 wppm on average. Similar reductions are also being mandated for diesel fuel.In the past, refiners relied heavily upon sulfur extraction and sweetening process units, such as the Merox process, to meet gasoline and diesel product specifications. Many refiners are now turning to hydrotreating in order to meet the ultra low sulfur specifications for their transportation fuels. However, in the refining industry of the 21st century, there remains a role for Merox units. Merox applications and technology innovations are enabling refiners to reduce project capital costs to meet these future product specifications.The Merox Process – An OverviewThe Merox process was initially introduced to the refining industry more than 40 years ago. In the intervening years, on-going process and catalyst innovations have enabled the Merox process to become one of UOP’s most successful processes with more than 1,700 units licensed. Even as processing objectives changed to meet impending sulfur content regulations, the Merox process has been one of the key refining technologies with more than 300 Merox units licensed since 1990.All versions of the Merox process are characterized by the catalytic oxidation of mercaptans (RSH) to disulfides (RSSR) in an alkaline (basic) environment. The overall reaction is:Merox catalyst2 RSH + ½ O2 ------------------------Æ RSSR + H2Obasic environmentIn a liquid-liquid extraction Merox process application, mercaptans in lighter feeds such as gases, C3’s, C4’s, LPG, and naphtha are extracted with a caustic solution, which is regenerated by oxidation with air in the presence of Merox catalyst. The resultant disulfides are separated and the caustic reused for extraction. The sulfur content of the extracted hydrocarbon is reduced. Heavier hydrocarbon fractions such as naphthas, kerosene, jet fuel and diesel contain types of mercaptan which cannot be readily extracted from the hydrocarbon. Hence, in a fixed-bed sweetening Merox process application, the mercaptan oxidation reaction takes place in the presence of air, Merox catalyst and a basic environment, such as caustic. The mercaptans are converted to disulfides which remain in the sweetened hydrocarbon product. The overall sulfur content, therefore, remains the same. Mercaptan sweetening in a fixed bed of Merox catalyst have replaced the older liquid-liquid catalyst sweetening units. Figure 1 shows the Merox process applications for various types of hydrocarbon.Merox Catalyst InnovationsThe original catalysts for both extraction and fixed-bed sweetening Merox units were supplied in powdered form. Manual handling of the powdered catalyst proved to be inconvenient; hence more active, second generation catalysts for extraction (Merox WS TM catalyst) and for fixed-bed sweetening (Merox FB TM catalyst) were developed. These catalyst are produced as liquid catalysts which enable easier handling. Merox No. 8™ catalyst for fixed-bed sweetening was developed to make catalyst handling more efficient for refiners. Merox No. 8 catalyst is Merox FB catalyst pre-impregnated on an activated carbon support. By using Merox No. 8 catalyst, a refiner need not perform an in-situ catalyst impregnation step and therefore can be on stream faster.Over the years, the efficiency of fluid catalytic cracking (FCC) unit operations enabled the time between turnarounds significantly increasing run lengths up to several years. To enable refiners to continue uninterrupted operations in the downstream Merox fixed bed sweetening units, UOP developed the Merox Plus™ catalyst activator. Merox Plus activator promotes the Merox FB catalyst activity. In addition, the activator helps keep the fixed bed clean of fouling contaminants which might otherwise block the catalyst active sites. The use of Merox Plus activator has enabled refiners to achieve run lengths of their fixed bed sweetening Merox units that match the run length of the FCC unit.Low Sulfur NaphthaAs low sulfur naphtha regulations have been introduced, refiners have looked for innovative ways to meet the reduced sulfur specifications at minimal cost. Although full boiling range naphthas can be hydroprocessed there is a reduction in the octane of the naphtha product and an increase in hydrogen consumption. As such, there are advantages to splitting the naphtha into its light and heavy fractions to minimize these effects. The fractionation configuration shown in Figure 2 allows the overhead material (light naphtha cut), which contains primarily mercaptan sulfur, to be processed in a liquid-liquid extraction Merox unit at very mild conditions. This approach reduces the refiner's overall investment and operating costs by reducing the size of the associated hydrotreater while eliminating the octane losses and reducing the hydrogen consumption associated with hydroprocessing a highly olefinic light FCC naphtha fraction. The bottoms material from the naphtha splitter (heavy naphtha cut) can be processed in a gasoline desulfurization unit, such as the ISAL™ process. In the ISAL TM process, the lower octane naphtha components are reconfigured through octane-enhancing reactions to minimize the octane loss due to olefin saturation.The mercaptan content of light FCC naphtha can be reduced by more than 95% through application of the liquid-liquid extraction Merox process without any yield or octane loss. The higher the endpoint of the FCC naphtha fraction that is processed, the lower the percentage of mercaptan sulfur present relative to the total sulfur content. Therefore, when applying the liquid-liquid extraction Merox process , maximum desulfurization of light FCC naphtha is achieved by optimally cutting the end point of the light fractions. Since thiophenes begin to boil at around 65o C, fractionating the FCC naphtha such that these thiophenes remain in the heavy FCC naphtha is recommended when maximum desulfurization is desired.Process InnovationsThere have been several process innovations in the Merox process which can assist the refiner in meeting process specifications while minimizing capital costs.Liquid-Liquid Extraction MeroxThe flow scheme for a liquid-liquid extraction Merox unit is shown in Figure 3. Maximum removal of the mercaptans is achieved in a single vertical extractioncolumn using proprietary high velocity/high efficiency jet deck extraction trays. The naphtha feedstock flowing up the extractor column is counter-currently extracted with a circulating caustic solution. Depending on the feedstock properties and the required product specifications, as many as six or more stages of extraction are incorporated into the Merox unit extraction column design. This ensures maximum desulfurization with a minimum caustic circulation rate and reduces capital costs compared to other processes that can only achieve a single stage of extraction per contacting vessel.If hydrogen sulfide (H2S) is present in the feed, the extractor column is preceded by a caustic prewash for (H2S) removal. Removal of H2S prior to mercaptan extraction provides for a more efficient operation. By removing H2S the circulating mercaptan extraction caustic is not contaminated which allows for more efficient usage and minimizes disposal of the circulating caustic. Additionally, the efficiency of the mercaptan extraction is maximized by eliminating the H2S which otherwise interferes with the mercaptan extraction efficiency and regeneration of the circulating caustic.Following the extractor column is an optional caustic settler to help further minimize the already low potential for caustic carryover. The treated naphtha then flows through a sand filter coalescer to reduce the sodium (Na) content of the naphtha to less than one weight part per million ( < 1 wt-ppm Na+).The Merox unit also contains a caustic regeneration section where the mercaptan-rich caustic solution from the bottom of the extraction column flows to an oxidizer column where extracted mercaptans are oxidized to disulfides. Air is injected upstream of the oxidizer.A wash oil, generally hydrotreated naphtha or hydrotreated kerosene, is injected upstream of the oxidizer. Wash solvent is usually included in the flow scheme when extracting naphtha range feedstocks in order to minimize the product re-entry sulfur, which is the disulfide contained in the regenerated caustic that re-enters the hydrocarbon phase and increases the sulfur content of the extracted product.Merox WS catalyst is added periodically to the circulating caustic to maintain the required catalytic activity. The oxidized solution exiting the top of the oxidizer column flows to the disulfide separator where spent air, disulfide oil/wash solvent, and caustic solution are separated. The spent air is usually vented to an existing fired heater near the site, while the disulfide oil/wash solvent stream is decanted and sent to a hydrotreating unit. The caustic stream leaving the disulfide separator is circulated back to the extraction column.Innovation Delivered – Improved Extraction Merox DesignAs seen in the previous section, the hydrocarbon section of the liquid-liquid extraction Merox unit consists of four basic operations, H2S removal, mercaptan extraction, caustic settling and caustic coalescing, each operation accomplished in a separate vessel. UOP’s process innovation is to combine these various operations into a single vessel. This innovative flow scheme is shown in Figure 4.As before, the naphtha feed is first introduced into the H2S removal section. However, in the improved extraction Merox design, the H2S section is incorporated into the bottom portion of the single vessel. Efficient H2S removal is maintained by a continuous circulation of 10o Be caustic.What was the caustic settler and sand filter are now replaced with a coalescer which is “installed” at the top of the extraction vessel. The extraction vessel will maintain:•High mercaptan extraction efficiency•Low re-entry disulfide in the treated product•Low overall caustic consumption•< 1 wt-ppm sodium in the treated product.Most importantly, a reduction in the unit capital cost of up to 30% can be achieved with the improved extraction Merox design. This cost savings is realized via the reduction in the number of vessels required and corresponding plot space reduction.Sweetening Merox ProcessAs shown in Figure 1, fixed-bed sweetening Merox process is applied to pentane and heavier hydrocarbon streams. The Minalk TM design of the fixed-bed sweetening Merox process is shown in Figure 5. The primary application for the Minalk process is for treating naphtha.The Minalk process utilized a simple design consisting of a single reactor filled with a fixed bed of activated charcoal impregnated with Merox FB catalyst. Dilute caustic, to maintain alkalinity, is continuously injected into the feed naphtha along with air. The naphtha is then passed downward through the fixed bed where the mercaptan is oxidized to disulfide. The disulfide, being oil soluble, remains in the hydrocarbon (naphtha) phase. The design of the Minalk unit reactor and reactor collection system allows for efficient causticseparation from the naphtha such that the treated naphtha will contain < 1 wt-ppm sodium without need for a separate coalescing media.The process benefits associated with the Minalk process include: •Production of a “Doctor negative” product while minimizing removal of phenols from the naphtha•Long catalyst life (which can further be extended by use of Merox Plus catalyst activator)•Minimum of operator attention required• A very small continuous discharge of dilute spent caustic•Low capital and operating costsInnovation Delivered - SweetFrac TM FlowschemeAs mentioned earlier, the primary role for the Minalk process is in sweetening naphtha. However, there are innovative applications for the Minalk process in the production of low sulfur naphtha. One of these applications has the Minalk unit located upstream of the naphtha splitter. This is an alternative to splitting the full boiling range naphtha into light and heavy fractions, and then treating the light FCC naphtha fraction [LCN] by a liquid-liquid extraction Merox unit, as seen in Figure 2. This new processing scheme, named SweetFrac, sweetens the full boiling range FCC gasoline in a fixed bed Minalk unit upstream of the naphtha splitter column as shown in Figure 6. The mercaptans in the naphtha are converted to disulfides. These disulfides have a much higher boiling point than the mercaptans and are easily fractionated into the heavy naphtha cut. Since the full range FCC naphtha is fractionated into light and heavy cuts after being sweetened, only the heavy FCC naphtha fraction requires desulfurization in a hydrotreating unit.The advantages and benefits of SweetFrac are:•Less sulfur in the LCN product after fractionation (no unextracted mercaptan sulfur and no re-entry disulfides) since the need for a liquid-liquid extraction Merox unit on the LCN can be eliminated.•The size of the hydrotreater and hence the resulting hydrogen consumption and octane penalty can be reduced significantly.There are eight Sweetfrac flowschemes in operation.Innovation Delivered – Treating Recombinant Mercaptans from HydrotreatingUnitsAs more FCC gasoline selective hydrotreating units are placed on stream, the frequency of hydrotreating units whose products have recombination mercaptans are increasing. Levels of 10 to 60 wt-ppm mercaptans are being found in some units. Whereas the heavy naphtha cut may, in some instances, still meet the overall total sulfur specification, the presence of these mercaptans may cause the naphtha to fail the “Doctor test”. Hence, another application for Minalk units, as shown in Figure 7, is to sweeten the recombinant mercaptans in the naphtha cut so that a “Doctor Negative” test result can be achieved. In many cases, a refiner may be able to reuse existing Minalk units for this service.CONCLUSIONSUOP remains committed to the on-going development of Merox process technology and to servicing the many Merox units in operation around the world. Catalyst and catalyst activator innovations improve catalyst life and on-stream efficiency. Engineering design improvements reduce process capital and operating costs. Innovative process applications allow refiners to reduce costs by using existing equipment and reducing the sizing required for new hydrotreating units. As a result, the Merox process continues to play an important role in meeting the ultra low specifications of the refining industry’s transportation fuels.More than 700 extraction Merox unitsMore than 700 fixed -bed sweetening Merox unitsFigure 1Merox Process ApplicationsGas Phase LPG Pentane LSR Naphtha & Condensate FCC Naphtha Kerosene & Jet Distillates up to 350°C EP UOP 4297A-08Naphtha SplitterLCN Naphtha HCNHDT HDT To GasolineBlendingTo Gasoline BlendingExtractionMerox unit Figure 2 -Extraction Merox Process for Low Sulfur Gasoline ProductionUOP 4297A-11Figure 3Extraction Merox ProcessTreatedProductCausticPrewashSandFilterMercaptide-rich CausticRegenerated CausticCaustic SettlerOxidizer DisulfideSeparatorAirLP SteamSpentAirDisulfideOilLegendHydrocarbonCausticUOP 4297A-12Figure 4 -Improved Extraction MeroxProcessMercaptide-rich CausticRegenerated CausticTreatedProductOxidizer DisulfideSeparatorAirLP SteamSpentAirDisulfideOilUOP 4297A-20Figure 5 -Minalk Process Fixed Bed SweeteningTo SewerAir Dilute CausticNaphtha ProductDrain PotUOP 4297A-23Figure 6 -SweetFrac Pre -treatment For Low Sulfur Gasoline Production Naphtha NaphthaSplitterHCNHDT HDT Minalk Sweetening Minalk Sweetening GasolineBlendingMinalk by a naphtha splitterUOP 4297A-26Figure 7 -Minalk Merox Process For Low Sulfur Gasoline ProductionNaphthaSplitterLCNNaphthaHCNHDTHDTToGasolineBlendingExtractionMeroxMinalk SweeteningMinalk SweeteningUOP 4297A-28Page 11。
板厚对冲裁力影响规律的研究
·实验研究·板厚对冲裁力影响规律的研究秦泗吉,彭加耕(燕山大学锻压研究所,河北秦皇岛066004)[摘要]理论分析和生产实践表明,在一定范围内,间隙对冲裁力的影响是很小的,而板材相对厚度是影响单位厚度上冲裁力的主要因素。
当材料性能等其它条件一定时,冲裁力随着板厚的增大而增大,但单位板厚上的冲裁力则随着板厚的增加而减小。
在有限元模拟和实验分析的基础上,提出了计算冲裁力的新方法,对揭示剪切加工机理及正确确定冲裁力有理论和实际意义。
[关键词]板材剪切;冲裁;冲裁力;有限元中图分类号:TG386.2文献标识码:A文章编号:1000-8446(2002)04-0004-04Research on the Influence of Thickness of Sheet Metal onthe Punch Load in Shearing ProcessGIN Si-ji,PENG ia-geng(Institute of Forging&Stamping of Yanshan University,Oinhuangdao066004,China)Abstract:TheoreticaI anaIysis and production practice indicate that the punch Ioad is independent of the cIearance in shearing process in some certain ranges,but the ratio of punch Ioad to the thickness of sheet metaIis sensitive to the thickness of sheet metaI.So,even if the punch Ioad increase as the thickness is Iarge,the ra-tio of punch Ioad to the thickness decreases.The new method to caIcuIate the punch Ioad is proposed based onFEA and experimentaI resuIts.This is significant in theory and practice to reveaI the mechanism of shearing pro-cess and determine the punch Ioad properIy.Keywords:sheet shearing and bIanking;punch Ioad;FEM长期以来,人们对冲压加工技术的研究重点多集中在成形方面,如板料的拉深、弯曲、胀形及翻边等,这些方面的理论已日趋成熟,随着理论分析和实验手段的提高,对剪切与冲裁加工问题所作的研究工作越来越受到重视[1,2],但在这方面的研究进展还相当有限。
英语翻译竞赛-改(1)
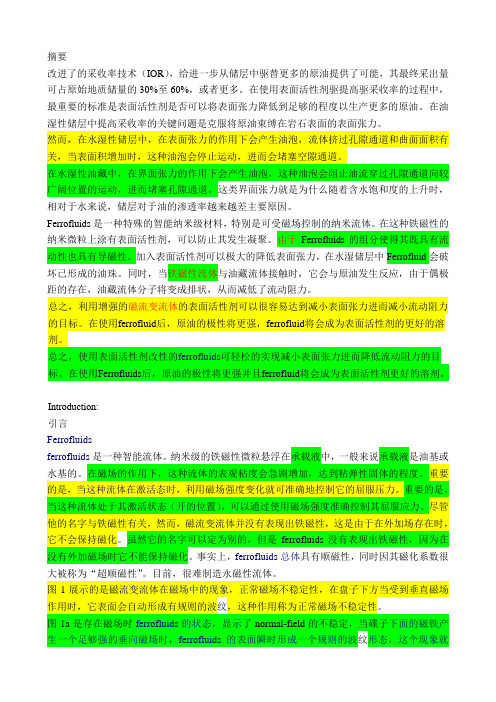
摘要改进了的采收率技术(IOR),给进一步从储层中驱替更多的原油提供了可能,其最终采出量可占原始地质储量的30%至60%,或者更多。
在使用表面活性剂驱提高驱采收率的过程中,最重要的标准是表面活性剂是否可以将表面张力降低到足够的程度以生产更多的原油。
在油湿性储层中提高采收率的关键问题是克服将原油束缚在岩石表面的表面张力。
然而,在水湿性储层中,在表面张力的作用下会产生油泡,流体挤过孔隙通道和曲面面积有关,当表面积增加时,这种油泡会停止运动,进而会堵塞空隙通道。
在水湿性油藏中,在界面张力的作用下会产生油泡,这种油泡会阻止油流穿过孔隙通道向较广阔位置的运动,进而堵塞孔隙通道。
这类界面张力就是为什么随着含水饱和度的上升时,相对于水来说,储层对于油的渗透率越来越差主要原因。
Ferrofluids是一种特殊的智能纳米级材料,特别是可受磁场控制的纳米流体。
在这种铁磁性的纳米微粒上涂有表面活性剂,可以防止其发生凝聚。
由于Ferrofluids的组分使得其既具有流动性也具有导磁性。
加入表面活性剂可以极大的降低表面张力,在水湿储层中Ferrofluid会破坏已形成的油珠。
同时,当铁磁性流体与油藏流体接触时,它会与原油发生反应,由于偶极距的存在,油藏流体分子将变成排状,从而减低了流动阻力。
总之,利用增强的磁流变流体的表面活性剂可以很容易达到减小表面张力进而减小流动阻力的目标。
在使用ferrofluid后,原油的极性将更强,ferrofluid将会成为表面活性剂的更好的溶剂。
总之,使用表面活性剂改性的ferrofluids可轻松的实现减小表面张力进而降低流动阻力的目标。
在使用Ferrofluids后,原油的极性将更强并且ferrofluid将会成为表面活性剂更好的溶剂。
Introduction:引言Ferrofluidsferrofluids是一种智能流体。
纳米级的铁磁性微粒悬浮在承载液中,一般来说承载液是油基或水基的。
小学上册第十四次英语第6单元真题
小学上册英语第6单元真题英语试题一、综合题(本题有100小题,每小题1分,共100分.每小题不选、错误,均不给分)1.What is the currency used in the United States?A. EuroB. PoundC. DollarD. Yen答案:C2.What is the capital of Italy?A. RomeB. VeniceC. FlorenceD. Milan3.What is the color of grass?A. BrownB. GreenC. YellowD. BlueB4.The ancient Greeks held festivals in honor of their ________.5.What is the name of the famous mountain range in Asia?A. RockiesB. AndesC. HimalayasD. AlpsC6. A _______ is a type of reaction that occurs in living organisms.7.An ion is an atom with a _____ charge.8.My favorite game is ______ (tag).9.I enjoy collecting beautiful _______ (我喜欢收集美丽的_______).10. A substance that cannot be broken down is called an ______.11.The ______ (小龙) in the story is very brave and helps its ______ (朋友).12.What is the term for the merger of two galaxies?A. Galactic CollisionB. Cosmic MergerC. Galaxy FusionD. Intergalactic Collision13.The __________ (历史的深度) reveals layers of meaning.14.Fruits provide essential ______ for our bodies. (水果为我们的身体提供必需的营养。
Fukushima_Accident_2011(世界核能协会)
Organisational acronyms:Tepco = Tokyo Electric Power CompanyNISA = Nuclear & Industrial Safety Agency (Japan, regulator),NSC = Nuclear Safety Commission (Japan, policy body)METI = Ministry of Trade, Economy & Industry (Japan),IAEA = International Atomic Energy Agency (UN body),JAIF = Japan Atomic Industrial Forum (industry body)ISRN = Institute for Radiological Protection & Nuclear Safety (France)Fukushima Daiichi 1-3 & 4Reactors 1-3 were shut down in response to the earthquake, as designed, since the groundacceleration was about 500 Gal. The reactors then reverted to an auxiliary Residual Heat Removal (RHR) cooling system, since the steam is no longer being conveyed to the turbines and condenser circuit. The RHR system is driven by electric pumps. Mains power was lost due to the quake, so the emergency diesel generators located in the basements of the turbine buildings started up to drive this system and ran for 56 minutes, but then stopped when submerged by the tsunami. This put those reactors in a dire situation and led the authorities to order, and subsequently extend, an evacuation while engineers worked to restore power. About nine hours later mobile power supply units had reached the plant and were being connected. The capacity of these would be less than the main plant diesel system. Meanwhile units 1-3 had only battery power, insufficient to drive the main RHR cooling system. The batteries were apparently depleted in about 8 hours anyway.Site and earthquakes: backgroundThe Daiichi (first) and Daini (second) Fukushima plants are sited about 11 km apart on the coast.Japanese nuclear power plants are designed to withstand specified earthquake intensities evident in ground motion. If theyregister ground acceleration of a set level, systems will be activated to automatically bring the plant to an immediate safeshutdown. In this case the set scram level was 135 Gal (150 Gal at Daini). The maximum response acceleration againstdesign basis ground motion for both Fukushima plants had been upgraded since 2006, and is now quoted at horizontal 438-489 Gal for Daiichi and 415-434 Gal for Daini. At this level they must retain their safety functions. In 2008 Tepco upgraded itsestimates of likely Design Basis Earthquake Ground Motion Ss for Fukushima to 600 Gal, and other Japanese operators haveadopted the same figure. The interim recorded data for both plants shows that 550 Gal (0.56 g) was the maximum for Daiichi,in the foundation of unit 2 (other figures 281-548 Gal), and 254 Gal was maximum for Daini. Units 2, 3 and 5 exceeded theirmaximum response acceleration design basis in E-W direction by about 20%. Recording was over 130-150 seconds. Allnuclear plants in Japan are built on rock (ground acceleration was around 2000 Gal a few kilometres north, on sediments).The design basis tsunami height is 5.7 m for Daiichi and 5.2 m for Daini, though the plants were built higher than this abovesea level. Tsunami heights were reported as 14 metres for both plants. Reactors: backgroundThe Fukushima Daiichi reactors are GE boiling water reactors (BWR) of an early (1960s) design supplied by GE and Toshiba,with what is known as a Mark I containment. Reactors 1-3 came into commercial operation 1971-75. Reactor power is 460 MWefor unit 1, 784 MWe for units 2-5, and 1100 MWe for unit 6. The fuel assemblies are about 4 m long, and there are 400 in unit 1,548 in units 2-5, and 764 in unit 6. Each assembly has 60 fuel rods containing the uranium oxide fuel within zirconium alloycladding. Unit 3 has a partial core of mixed-oxide (MOX) fuel (32 MOX assemblies, 516 LEU). They all operate normally at 286°C at core outlet under a pressure of 6930 kPa and with about 400 kPa pressure in dry containment.The BWR Mark I has a Primary Containment system comprising a free-standing bulb-shaped drywell of 30 mm steel backed by areinforced concrete shell, and connected to a torus-shaped wetwell beneath it containing the suppression pool. The drywell, alsoknown as the Primary Containment Vessel (PCV), contains the reactor pressure vessel (RPV). For simplicity, we will use the term'dry containment' here. The water in the suppression pool acts as an energy-absorbing medium in the event of an accident. Thewetwell is connected to the dry containment by a system of vents, which discharge under the suppression pool water in the eventof high pressure in the dry containment. The function of the primary containment system is to contain the energy released duringany loss-of-coolant accident (LOCA) of any size reactor coolant pipe, and to protect the reactor from external assaults. TheJapanese version of the Mark I is slightly larger than the original GE version.During normal operation, the dry containment atmosphere and the wetwell atmosphere are filled with inert nitrogen, and thewetwell water is at ambient temperature.If a loss of coolant accident (LOCA) occurs, steam flows from the dry containment (drywell) through a set of vent lines and pipesinto the suppression pool, where the steam is condensed. Steam can also be released from the reactor vessel through the safetyrelief valves and associated piping directly into the suppression pool. Steam will be condensed in the wetwell, but hydrogen andnoble gases are not condensable and will pressurise the system, as will steam if the wetwell water is boiling. In this caseemergency systems will activate to cool the wetwell, see below. Excess pressure from the wetwell can be vented through the 120m emission stack via a hardened pipe or it may leak into the secondary containment or reactor service floor of the building. If there has been fuel damage, vented gases will include noble gases (krypton & xenon), iodine and caesium, the latter beingscrubbed in some scenarios. Less volatile elements in any fission product release will plate out in the containment. (The laterMark II containments are similar to Mark I, but both are much smaller than the Mark III and those which became standard inPWRs.)The secondary containment houses the emergency core cooling systems and the spent/ used fuel pool. It is not designed to /info/fukushima_accident_inf129.html 2 / 11Fukushima_Accident_2011of high pressure in the dry containment. The function of the primary containment system is to contain the energy released duringany loss-of-coolant accident (LOCA) of any size reactor coolant pipe, and to protect the reactor from external assaults. TheJapanese version of the Mark I is slightly larger than the original GE version.During normal operation, the dry containment atmosphere and the wetwell atmosphere are filled with inert nitrogen, and the wetwell water is at ambient temperature.If a loss of coolant accident (LOCA) occurs, steam flows from the dry containment (drywell) through a set of vent lines and pipesinto the suppression pool, where the steam is condensed. Steam can also be released from the reactor vessel through the safetyrelief valves and associated piping directly into the suppression pool. Steam will be condensed in the wetwell, but hydrogen andnoble gases are not condensable and will pressurise the system, as will steam if the wetwell water is boiling. In this caseemergency systems will activate to cool the wetwell, see below. Excess pressure from the wetwell can be vented through the 120m emission stack via a hardened pipe or it may leak into the secondary containment or reactor service floor of the building. Ifthere has been fuel damage, vented gases will include noble gases (krypton & xenon), iodine and caesium, the latter beingscrubbed in some scenarios. Less volatile elements in any fission product release will plate out in the containment. (The laterMark II containments are similar to Mark I, but both are much smaller than the Mark III and those which became standard inPWRs.)The secondary containment houses the emergency core cooling systems and the spent/ used fuel pool. It is not designed tocontain high pressure.The primary cooling circuit of the BWR takes steam from above the core, in the reactor pressure vessel, to the turbine in anadjacent building. After driving the turbines it is condensed and the water is returned to the pressure vessel. There are also twopowerful jet-pump recirculation systems forcing water down around the reactor core and shroud. When the reactor is shut down,the steam in the main circuit is diverted via a bypass line directly to the condensers, and the heat is dumped there, to the sea. Inboth situations a steam-driven turbine drives the pumps, at least until the pressure drops to about 350 kPa (50 psi). In shutdownmode, the Residual Heat Removal (RHR) system then operates in a secondary circuit (RHR is connected into the two jet-pumprecirculation circuits), driven by electric pumps, and circulates water from the pressure vessel to RHR heat exchangers whichdump the heat to the sea. There is also a Reactor Core Isolation Cooling (RCIC) which can provide make-up water to thereactor,though without any heat removal circuit. It is driven by a small steam turbine using steam from decay heat, injectingwater from a condensate storage tank or the suppression pool. (The NISA account does not mention the RCIC, possibly treatingit as part of the ECCS, though it has been confirmed that the RCIC systems played a helpful role in all three units until thesuppression pool water boiled, to 11am on 12th in unit 3 and to 2pm on 14th in unit 2.)Then there is an Emergency Core Cooling System (ECCS) as further back-up for loss of coolant. It has high-pressure and low-pressure elements. The high pressure coolant injection (HPCI) system has pumps powered by steam turbines which are deignedto work over a wide pressure range. The HPCI draws water from the large torus suppression chamber beneath the reactor as wellas a water storage tank. For use below about 700 kPa, there is also a Low-Pressure Coolant Injection (LPCI) mode through theRHR system but utilising suppression pool water, and a core spray system, all electrically-driven. All ECCS sub-systems requiresome power to operate valves etc, and the battery back-up to generators may provide this.Beyond these original systems, Tepco in 1990s installed provision for water injection via the fire extinguisher system through theRHR system (injecting via the jet-pump nozzles) as part of it Severe Accident Management (SAM) countermeasures./info/fukushima_accident_inf129.html 3 / 11Fukushima_Accident_2011When the power failed about one hour after shutdown, the reactor cores would still be producing about 1.5% of their nominal thermal power, from fission product decay - about 22 MW in unit 1 and 33 MW in units 2 & 3, according to calculations from well-established models. Without heat removal by circulation to an outside heat exchanger, this produced a lot of steam in the reactor pressure vessels housing the cores. The steam would be condensed in the suppression chamber under the reactor, within the containment, but their internal temperature and pressure rose quite rapidly. At4.36 pm water injection using the Emergency Core Cooling System (ECCS), failed in units 1 & 2, less than an hour after power loss. At 7.03 pm a Nuclear Emergency was declared, and at 8.50pm the Fukushima Prefecture issued an evacuation order for people within 2 km of the plant. At 9.23 pm the Prime Minister extended this to 3 km, and at5.44 am on 12th he extended it to 10 km. He visited the plant soon after. At6.25 pm on Saturday 12th he extended the evacuation zone to 20 km.Then there is an Emergency Core Cooling System (ECCS) as further back-up for loss of coolant. It has high-pressure and low-pressure elements. The high pressure coolant injection (HPCI) system has pumps powered by steam turbines which are deignedto work over a wide pressure range. The HPCI draws water from the large torus suppression chamber beneath the reactor as wellas a water storage tank. For use below about 700 kPa, there is also a Low-Pressure Coolant Injection (LPCI) mode through the RHR system but utilising suppression pool water, and a core spray system, all electrically-driven. All ECCS sub-systems requiresome power to operate valves etc, and the battery back-up to generators may provide this.Beyond these original systems, Tepco in 1990s installed provision for water injection via the fire extinguisher system through theRHR system (injecting via the jet-pump nozzles) as part of it Severe Accident Management (SAM) countermeasures.A frequently-voiced concern during the first week of the accident was regarding fuel meltdown. This would start to occur if thefuel itself reached 2500°C (or more, up to 2800°C, depending on make -up). At this point, the fuel rods slump within theassemblies. Conceivably, the “corium ” (a mixture of molten cladding, fuel, and structural steel) begins to move to the bottom ofthe reactor vessel. If the hot fuel or cladding is exposed to cooling water en route, it may solidify and fracture, falling to thebottom of the reactor vessel. Given that the melting point of the steel reactor vessel is about 1500°C, there is an obviouspossibility on the corium penetrating the steel if it remains hot enough. (In fact, in the 1979 US Three Mile Island accident, itdidn't, though about half the core melted and it went 15 mm into the 225 mm thick pressure vessel steel. The pressure vesselglowed red-hot for an hour.) But the whole fuel melt scenario is much more probable with a sudden major loss of coolant whenthe reactor is at full power than in the Fukushima situation. Before this, cladding cracks at about 1200°C, its oxidation begins atabout 1300°C and the Zr cladding melts at about 1850°C. /info/fukushima_accident_inf129.html 4 / 11Fukushima_Accident_2011When the power failed about one hour after shutdown, the reactor cores would still be producing about 1.5% of their nominal thermal power, from fission product decay - about 22 MW in unit 1 and 33 MW in units 2 & 3, according to calculations from well-established models. Without heat removal by circulation to an outside heat exchanger, this produced a lot of steam in the reactor pressure vessels housing the cores. The steam would be condensed in the suppression chamber under the reactor, within the containment, but their internal temperature and pressure rose quite rapidly. At4.36 pm water injection using the Emergency Core Cooling System (ECCS), failed in units 1 & 2, less than an hour after power loss.At 7.03 pm a Nuclear Emergency was declared, and at 8.50pm the Fukushima Prefecture issued an evacuation order for people within 2 km of the plant. At 9.23 pm the Prime Minister extended this to 3 km, and at 5.44 am on 12th he extended it to 10 km. He visited the plant soon after. At 6.25 pm on Saturday 12th he extended the evacuation zone to 20 km.Over the first twelve hours pressure inside the containment structures increased steadily and led to this being vented to the atmosphere repeatedly, starting with unit 1 early on Saturday 12th, where pressure had reached more than three times the design level (840 kPa above the normal 400 kPa). This would damage pump seals and possibly the top O-ring, so that inside, water levels dropped, exposing fuel, and this was addressed by pumping seawater into the reactor pressure vessels (RPV) using external pumps brought to site, starting with unit 1 at 8.20 pm on 12th. This was apparently via the Low Pressure Coolant Injection System, connected into the RHR system. On 25th, water from a nearby dam started to be used instead of seawater. Boron was added to the injected water, to guard against any criticality.Meanwhile, vented gases and vapour included hydrogen, produced by the exothermic interaction of the fuel's very hot zirconium cladding with steam and water. At 3.36 pm on 12th, there was a hydrogen explosion in the building above unit 1 reactor containment, blowing off much of the roof and cladding on the top part of the building, after vented hydrogen mixed with air and ignited. On Sunday 13th, seawater injection to unit 1's Primary Containment started. Pressure inside unit 1 has remained high since then (300-400 kPa), and water injection has been via the feedwater line. On 6 April Tepco started injecting nitrogen into the containment vessel on account of suspected hydrogen levels there.I n unit 2, as mentioned above, water injection using the Emergency Core Cooling System (ECCS) failed at 4.36 pm on 11th. However, the steam-driven Reactor Core Isolation Cooling (RCIC) system functioned until the morning of 14th. Pressure was vented on 13th and again on 15th, and meanwhile the blowout panel near the top of the building was opened. The reactor water level was found to be low on Monday 14th, so seawater injection to the containment was started on 15th, via the fire-fighting line. Then at 6.14 am on Tuesday 15th, unit 2 apparently ruptured its pressure suppression chamber under the actual reactor, releasing some radioactivity and dropping thepressure inside. At 10.30 am Tepco was told to inject water into the pressure vessel and to vent the containment, and these activities continued. Containment damage is suspected. On 1 April Tepco discovered a crack in the wall of a 2m deep cable pit which was leaking highly-contaminated water, apparently from the reactor itself. The company eventually plugged it early in 6 April.In unit 3, the RCIC system failed at 11 am on Saturday 12th and venting the containment was done late in the day. On Sunday 13th, at 5.10 am, water injection using the Emergency Core Cooling System (ECCS) failed in this unit also, and at 9.20 am venting the containment was repeated. At 11.55 am fresh water injection to the RPV commenced, soon being replaced by seawater through to 25th. On Monday 14th at 5.20 am venting was repeated, then at 11.01 am a hydrogen explosion in the building above unit 3 reactor containment blew off much of the roof and walls on the top part of the building. Early on Wednesday 16th there was a major release of smoke and/or steam from the top of the building. Because of the possibility that the Primary Containment of Unit 3 wasdamaged, the operators evacuated from the central control room of Unit 3 & 4 (a shared facility) at 10:45 am, but they returned to the control room and restarted the operation for water injection 45 minutes later. Pressure then built up to 320 kPa in the containment but no further venting wasrequired. Since at least 16th, pressure vessel damage has been suspected, and some leakage is apparently confirmed by radioactivity levels in the building. Also since 20th the reactor pressure and drywell pressure decreased and then remained stable, leading TEPCO to believe that “the reactor pressure vessel is not seriously damaged.” By the end of March internal pressure was little more than atmospheric.The heat from the fuel in the reactor cores was estimated by France's ISRN as 2.5 MW thermal in /info/fukushima_accident_inf129.html 5 / 11Fukushima_Accident_2011in the building above unit 3 reactor containment blew off much of the roof and walls on the top part of the building. Early on Wednesday 16th there was a major release of smoke and/or steam from the top of the building. Because of the possibility that the Primary Containment of Unit 3 was damaged, the operators evacuated from the central control room of Unit 3 & 4 (a shared facility) at 10:45 am, but they returned to the control room and restarted the operation for water injection 45 minutes later. Pressure then built up to 320 kPa in the containment but no further venting wasrequired. Since at least 16th, pressure vessel damage has been suspected, and some leakage is apparently confirmed by radioactivity levels in the building. Also since 20th the reactor pressure and drywell pressure decreased and then remained stable, leading TEPCO to believe that “the reactor pressure vessel is not seriously damaged.” By the end of March internal pressure was little more than atmospheric.The heat from the fuel in the reactor cores was estimated by France's ISRN as 2.5 MW thermal in unit 1 and 4.2 MW in units 2 & 3 after almost three weeks. This is enough to boil away 95 tonnes and 160 tonnes of water per day respectively if all external circulation to heat sinks ceases, indicating the need for constant top up while the heat is not being dumped in the normal heat exchanger circuits. From 30th, 7-8 m 3/hour was being injected into each reactor. These heatproduction levels will diminish only slowly from this point. The cores remained partly uncovered, and Tepco said on 15th that 70% of the fuel rods in unit 1 and one third in unit 2 were damaged. At one stage unit 2 core was dry for some hours, and a German source said that unit 1 core was without water for 27 hours, causing major fuel damage.Since Sunday 20th JAIF has said that the containment vessel of unit 2 is thought to be damaged, and that of unit 3 could possibly be also, but unit 1 and 4 were intact. (Unit 4 has no fuel in it.).MIT Nuclear Science & Engineering info hubThe AC electricity supply from external source was connected to all units by 22nd, enabling more accurate monitoring of the plants and progress towards restoring the RHR cooling system of units 1-3. Power was restored to instrumentation in all units except unit 3 by 25th. Tepco said that once the control rooms are operational, water levels can be checked as well as temperatures in the fuel storage pools, and normal cooling of those pools can be resumed. However, at least some pumps have been damaged by seawater and Tepco says that radiation levels inside the plant are so high that normal access is still impossible. It is giving priority to removing contaminated water so as to allow better access.Summary on 4 April : All three units have fuel damage and low water levels, units 2 & 3 have lost /info/fukushima_accident_inf129.html 6 / 11Fukushima_Accident_2011MIT Nuclear Science & Engineering info hubThe AC electricity supply from external source was connected to all units by 22nd, enabling more accurate monitoring of the plants and progress towards restoring the RHR cooling system of units 1-3. Power was restored to instrumentation in all units except unit 3 by 25th. Tepco said that once the control rooms are operational, water levels can be checked as well as temperatures in the fuel storage pools, and normal cooling of those pools can be resumed. However, at least some pumps have been damaged by seawater and Tepco says that radiation levels inside the plant are so high that normal access is still impossible. It is giving priority to removing contaminated water so as to allow better access.Summary on 4 April : All three units have fuel damage and low water levels, units 2 & 3 have lost pressure and are suspected to have pressure vessel or containment damage (only unit 1 is still above atmospheric pressure). Cooling still needs to be provided from external sources, using fresh water and pump trucks, while work continues to establish a stable heat removal path to external heat sinks. Tepco has said that it is inevitable that the three reactors, with unit 4, will be written off and decommissioned. On 4 April both NISA and NSC said it could take months to repair the cooling systems due to the amount of contaminated water in the turbine buildings.Fuel ponds: developing problemsA separate set of problems arose as the fuel ponds, holding fresh and used fuel, in the upper part of the reactor structures were found to be depleted in water. It has not been explained why or how the low water levels came about, though elevated temperatures due to loss of cooling circulation would have been a major cause, especially in heavily-loaded unit 4. On 13 March Tepco said it was consulting with NISA and METI regarding cooling of the pondsI n unit 4, at about 6 am on Tuesday 15th, there was an explosion in the top part of the building, near the fuel pond, which destroyed the top of the building and damaged unit 3's superstructure further. Then there was a fire and soon after the radiation level near the building reached 400 mSv/hr, apparently from this source. The fire was extinguished in three hours. Evidently the used fuel there became exposed and got hot enough to form hydrogen. At 10 pm on 15th Tepco was told to implement injection of water to unit 4 pond. The gates which give access in refueling may havebeen disturbed by the earthquake, allowing some water to drain out. Apart from this, it appears that the water level dropped due to evaporation, if not boiling, caused by the high heat load from 1535 fuel assemblies once circulation ceased. The focus from Tuesday 15th was on replenishing the water in the ponds of units 3 and 4, through the gaps in the roof and cladding, using seawater. On 19th, unit 3 pond was reported to be stable, and on 24th it was able to be replenished using built-in plumbing for FPC system. On 25th the sameFuel ponds: backgroundUsed fuel needs to be cooled and shielded. This is initially by water, in ponds. After about three years under water, used fuelcan be transferred to dry storage, with air ventilation simply by convection. Used fuel generates heat, so the water is circulatedby electric pumps through external heat exchangers, so that the heat is dumped and a low temperature maintained.There are fuel ponds near the top of all six reactor buildings at the plant, adjacent to the top of each reactor so that the fuelcan be unloaded under water, when the top is off the reactor pressure vessel and it is flooded. The ponds hold some fresh fueland some used fuel, pending its transfer to the central used/spent fuel storage on site. (There is some dry storage to extendthe site's capacity.) From here it is periodically shipped for reprocessing, that being now to Rokkasho for recycling.At the time of the accident, unit 4's pond also held a full core load of 548 fuel assemblies while the reactor was undergoingmaintenance, these having been removed at the end of November.The temperature of these ponds is normally low, around 30°C when circulation is maintained with the Fuel Pool Circulationand Clean-up (FCP) system, but they are designed to be safe at about 85°C in the absence of pumped circulation (andpresumably with low fuel load). They are about 12 metres deep, so the fuel is normally covered by 7 metres of water.Unit 3 & 4 ponds are about 12 x 10 metres, with 1220 and 1590 assemblies capacity respectively (unit 1 is about 12 x 7 m,900 assemblies). Unit 4 pond has a total 1331 used assemblies, giving it a heat load of about 3 MW thermal, according toFrance's IRSN, which in that case could lead to 115 cubic metres of water boiling off per day, or about one tenth of itsvolume. Unit 3's pool contains 514 fuel assemblies, unit 1 has 292 and unit 2 has 587. There is no MOX fuel in any of theponds.The central fuel storage on site has a pond about 12 x 29 metres, 11 m deep, with capacity of 3828 m3 and 6840 fuelassemblies. Its building is about 55 x 73 m. (There are 6375 assemblies in the undamaged central pool storage on site, withvery low decay heat, and 408 in dry cask storage - utilized since 1995 for used fuel no longer needing much cooling.) /info/fukushima_accident_inf129.html 7 / 11Fukushima_Accident_2011。
Acomparative study onthehydro-mechanical behavior of compacted
A comparative study on the hydro-mechanical behavior of compacted bentonite/sand plug based on laboratory and field in filtration testsQiong Wang a ,Anh Minh Tang a ,Yu-Jun Cui a ,c ,⁎,Jean-Dominique Barnichon b ,Wei-Min Ye ca Ecole des Ponts ParisTech,Franceb Institut de Radioprotection et de SûretéNucléaire (IRSN),France cTongji University,Chinaa b s t r a c ta r t i c l e i n f o Article history:Received 1December 2012Received in revised form 15May 2013Accepted 19May 2013Available online 25May 2013Keywords:Small-scale test In situ experimentBentonite/sand mixture Technological void Swelling pressure Swelling stainSEALEX is a research project aiming at identifying the key factors that affect the long-term performance of bentonite-based sealing systems with an initial technological void.In this context,a series of in situ experiments have been performed in field conditions.Meanwhile,a small-scale test (1/10)was carried out in controlled conditions in the laboratory,aiming at providing useful information for analyzing the in situ tests in terms of sat-uration time and sealing effectiveness.In this paper,the results of the small-scale test are presented along with the results from the first in situ test (PT-N1).It was observed that during the saturation process,the evolution of the injected water volume followed a hyperbolic relationship with time in both the laboratory and field condi-tions.In the laboratory conditions,a decrease in axial swelling pressure occurred due to filling of the technolog-ical void.By contrast,this decrease has not been observed in the field parison of the injected water and the axial swelling pressure between the two different scales enabled the de finition of a same time upscaling ratio of 2.5(in situ experiment/small-scale test).Accordingly,the saturation duration of the in situ experiment was estimated to be equal to two years.For the small-scale test,a swelling strain evolution rate of 0.588mm/day was identi fied in the case of in filtration from two sides of the sample.This is useful when predicting the evolution of swelling strain in the case of failure of the sealing plug.After filling of an additional 20%void,a swelling pressure of 0.18MPa was obtained,indicating the favorable sealing capacity of the material after filling the technological void.©2013Elsevier B.V.All rights reserved.1.IntroductionIn the design of deep geological repository for high level long lived radioactive wastes,compacted bentonite-based materials are often considered as buffer/sealing materials.These materials are expected to exhibit a swelling pressure high enough to ful fill their buffer/sealing functions.Numerous laboratory studies have been conducted to assess the performance of buffer/sealing materials (e.g.Delage et al.,1998;Lloret et al.,2003;Romero et al.,2005;Lloret and Villar,2007).Vari-ous experiments were also performed in the underground research laboratories (URL)(TSX at Manitoba,Canada;FEBEX at Grimsel,Switzerland;RESEAL at Mol,Belgium;KEY at Bure,France,etc.).Re-cently,IRSN (Institut de Radioprotection et de SûretéNucléaire,France)has launched the SEALEX project aiming at identifying and quantifying the key factors related to the long-term performance of bentonite-based sealing systems taking into account an initial technological void.This project consists of a series of in situ experiments in the Tournemire URL,and a small-scale test (1/10)in the laboratory.The in situ experimental program was purposefully built allowing systematical exploration of the effects of technical speci fications,design,construction,defect,etc.,by changing a single parameter each time.As a reference case (see Barnichon and Deleruyelle,2009;Barnichon et al.,2012for more details),the first test PT-N1with a clay core made up of pre-compacted monolithic disks of MX80bentonite/sand mixture (70/30in dry mass)has been conducted in the URL of Tournemire.Due to the low permeability of this material,saturation is expected to be reached in several years (see Barnichon et al.,2012).During the saturation process,the injected water volume,total pres-sure,pore water pressure and relative humidity changes have been monitored at several positions within the plug.After the saturation stage,hydraulic tests will be performed to determine the overall hy-draulic properties (permeability,occurrence of leakage)of the sealing system.In addition to this reference case,three other tests are designed to quantify the impact of the technical speci fication and design of the sealing plug by changing the intra-core geometry (jointed instead of monolithic disks),core composition (MX80/sand ratio)and core condi-tions (compacted in field instead of pre-compacted).Moreover,to in-vestigate the effect of altered conditions,an additional test is designedEngineering Geology 162(2013)79–87⁎Corresponding author at:Ecole des Ponts ParisTech,6-8av.Blaise Pascal,CitéDescartes,Champs-sur-Marne,77455Marne la Vallee,France.Tel.:+33164153550;fax:+33164153562.E-mail address:yujun.cui@enpc.fr (Y.-J.Cui).0013-7952/$–see front matter ©2013Elsevier B.V.All rights reserved./10.1016/j.enggeo.2013.05.009Contents lists available at SciVerse ScienceDirectEngineering Geologyj o u rn a l ho m e p a g e :w w w.e l s e v i e r.c o m /l o c a t e /e n g g e oto simulate an incidental decrease of swelling pressure caused by failure of the confining structure.Based on the design of the in situ experiments,a laboratory small-scale test(1/10)was performed,focusing on the recovery capacity of the bentonite-based seal with technological voids.The ma-terial identical to that used in test PT-N1was used(MX80bentonite/ sand mixture).A confining cell of stainless steel was used to simulate the constant-volume boundary conditions.After the initial saturation process as in the PT-N1in situ experiment,the seal evolution upon a confinement failure was simulated by allowing a given amount of free swell.This free swell was followed by a last stage of wetting under con-stant volume conditions.To assess the sealing capacity,the injected water volume,axial swelling pressure and swelling strain were moni-tored in different stages.It was expected to obtain useful information from the laboratory small-scale test for analyzing thefield tests in terms of saturation time and sealing effectiveness.In this paper,the results of the small-scale test are presented along with the results from the in situ test(PT-N1).An upscaling ratio was obtained by comparing the injected water volume and the axial swelling pressure evolution between the laboratory andfield condi-tions.The time needed to reach the stabilization of axial swelling pressure for the in situ test(PT-N1)as well as the evolution of swell-ing strain and swelling pressure in the case of failure of the confining structure were estimated accordingly.2.Materials and methods2.1.MaterialsThe soil studied is a compacted MX80/sand mixture with a pro-portion of70/30in dry mass.The bentonite is from Wyoming,USA, with a high content of montmorillonite(80%).It has a liquid limit of 575%,a plastic limit of53%and a unit mass of2.77Mg/m3.The cation exchange capacity(CEC)is76meq/100g(83%of Na+).The quartz sand used in the mixture comes from Eure and Loire(France)with a unit mass of2.65Mg/m3.It was sieved at2mm prior to being mixed with the bentonite.The water used has the same chemical composition as the pore water of the Callovo-Oxfordian claystone from the ANDRA URL in Bure(France),namely synthetic water(Wang et al.,2012,2013).It was obtained by mixing the corresponding chemical compounds (see Table1)with distilled water using a magnetic stirrer until full dissolution.2.2.SEALEX in situ test(PT-N1)As mentioned above,the in situ experiment(PT-N1)has been conducted in the Tournemire URL excavated in Toarcian claystone.A horizontal borehole(0.60m in diameter)was drilled for this purpose. Fig.1shows the layout of the experiment.A seal made up of compacted MX80/sand mixture was sandwiched between two porous plates, allowing water inflow from two water reservoirs(i.e.upstream and downstream).The14.33%annular technological void(volume of void/ volume of borehole)was defined by adopting a smaller initial diameter (0.555m)of the pre-compacted seal as compared to the borehole diameter(0.60m).The upstream plate is in direct contact with the host-rock while the downstream one is retained by a confining system ensuring a constant-volume condition.A packer-like device was used to prevent water leakage from the interface between the confining plug and host-rock.The clay seal in test PT-N1is made up of8monolithic pre-compacted disks(0.555m in diameter and0.15m thick)of MX80/ sand mixture with an initial dry density of1.97Mg/m3(Figure2). The disks were arranged in vertical slices giving rise to the geometry of seal as shown in Fig.2.The bricks were obtained through uniaxial compaction of the mixture at its initial water content of11%.The ini-tial dry density(1.97Mg/m3)of the bricks was selected based on the consideration of the14.33%technological void and the need to have a final dry density of1.67Mg/m3after saturation of the plug andfilling of the initial technological voids.Three types of sensors were installed within the compacted blocks to monitor the swelling pressure,pore pressure and relative humidity.For clarity,only the distribution of sensors for swelling pressure measurement is shown in this paper(Figure3a).Three total pressure sensors were installed on the surface of the column at section0.60m(from the downstream saturation system,L-01,L-02, L-03)to measure the radial swelling pressure;two total pressure sensors were installed at section0and1.20m to measure the axial swelling pressure(A-01,A-02).For each sensor,a hole as shown in Fig.3b was prepared at their pre-assigned positions before the assem-blage of blocks,keeping the hole to a minimum size.Wireless sensors (d=32mm)were used to limit preferentialflow along cables and a wireless transmitter was installed at each measurement section.Data were recorded automatically by a data acquisition system.Regarding the test operational phases,a volume of water of49l wasfirst injected,which corresponded to the volume of the techno-logical void adopted.This process ended in one hour.Afterwards, the water supply was stopped because the side packer was not prop-erly inflated;it restarted after20days under a water pressure of 0.1MPa.During the saturation process,the swelling pressure,pore pressure,water content or water saturation within the plug were monitored.The injected water volumes at both upstream and down-stream chambers were also measured.When the saturation process is completed,hydraulic tests will be performed to determine the overall hydraulic properties(permeability,occurrence of leakage)of the corresponding sealing systems.boratory small-scale testThe experimental devices used for the laboratory small-scale test (1/10)are shown in Fig.4.A stainless steel cell of60mm in inner diameter and200mm long was used.As in the in situ test,an annular technological void was defined by adopting a smaller initial diameter (55.5mm)for the pre-compacted sample as compared to the diame-ter of the hydration cell(60mm).Note however that the hydration cell was placed in the vertical direction(see Figure4)and it was then different from the in situ test which is performed in a horizontal borehole(see Figures1and2).Water supply was conducted through the water inlets in the bottom base which was connected to burettes. This allowed measurement of the total amount of water taken up by the sample.A piston of60mm diameter was used to simulate the confining structure.On the bottom of the piston,there was drainage with two inlets(upside inlet in Figure4)and a porous stone of 50mm diameter,allowing water/airflow.A mechanical press was used to restrain the axial deformation and a force transducer was used to monitor the axial swelling pressure.A displacement transducer fixed on the piston allowed monitoring of the axial displacement to an accuracy of1μm.The axial pressure and axial displacement were recorded automatically to a data logger,while the inlet water volume was measured manually by determining the water level in the burettes.Table1Chemical composition of the synthetic water.Compound NaHCO3Na2SO4NaCl KCl CaCl2.2H2O MgCl2.6H2O SrCl2.6H2O Mass(g)per liter of solution0.28 2.2160.6150.075 1.082 1.3560.05380Q.Wang et al./Engineering Geology162(2013)79–87Note that in this small-scale test,the radial swelling pressure was not measured.A monolithic cylindrical sample(55.5mm in diameter,120mm high)was used in the test.It was statically compacted in a mold to the same dry density as in the in situ test(1.97Mg/m3).In order to ensure the homogeneity of the specimen,the compaction was carried out in two layers.The surface of thefirst compacted layer was care-fully scarified before the second layer was added to ensure a good junction between them.Fig.5a shows the pre-compacted specimen with the hydration cell.After compaction,the specimen(55.5mm in diameter)was placed at the center of the cell(60mm in inner diameter),leaving an annular void(2.25mm)between the specimen and cell wall(Figure5b).An initial axial stress of0.1MPa was applied on the specimen before hydration in order to ensure good contacts between the load cell and the piston,between the piston and the sample,between the sample and the cell bottom,as well as satisfac-tory load measurement.Then,the upside inlets(see Figure4)were sealed and vacuum was applied to evacuate all air in the voids(tech-nological void mainly).The synthetic water wasfinally injected from the bottom.As described in Fig.6,hydration was carried out in three stages. First,the axial deformation was restrained and water was injected to the sample;during this stage(Stage1.initial saturation phase), the evolution of the vertical swelling pressure was monitored.Once the hydration ended,the confining pressure in the axial direction was removed by unloading,allowing a free swell of20%(Stage2. recovery of the void phase).To reduce the test duration in this stage,two-side infiltration was applied by injecting water from both the bottom and the top,while recording changes in axial swelling strain over time.This stage aimed at simulating the case of a satura-tion defect or a failure of confining structure that may occur during the long-term lifespan of the disposal system.The free swell of20% represents the sealing capacity required afterfilling the technological void.When the axial swelling strain reached the desired value of20%, the piston was automatically blocked thanks to a reserved distanceof Fig.2.Geometry of the clay plug and the pre-compacted blocks.(a)Distribution of the total pressure sensorsFor total pressure sensorA-01 (d = 32 mm)0.555 m(b) Hole machined for installation of wireless sensorFig.3.Distribution and installation of the total pressuresensors.yout of the SEALEX in situ experiment(after Barnichon and Deleruyelle,2009).81Q.Wang et al./Engineering Geology162(2013)79–8724mm (corresponding to 20%swelling strain)between the piston and the load cell (Figure 7);the evolution of swelling pressure was monitored again (Stage 3.con finement phase).3.Experimental results 3.1.In situ test (PT-N1)Fig.8shows the evolution of injected water volume over time.As mentioned above,a volume of 49l was first injected to fill the tech-nological void and the injection was stopped for 20days due to a technical problem related to the packer.After resuming the injection,it was observed that the increase rate of water volume was followed by an asymptotic curve with a decreasing rate.After 367days,the total injected water volume was 71.39l (Figure 8).Examination of the curve shows that the shape of water volume versus time (after rejection)can be described by a hyperbolic function.Fig.9presents the time/water volume (day/l)versus time.A good linear relationship is obtained,con firming that the water volume –time curve is of a hyperbolic shape.Thereby,the following equation can be adopted for this relationship:t¼a þbt 1where t is time,V is injected water volume,a and b are the intercept and the slope of the straight line,respectively (Figure 9).According to this hyperbolic relationship,the maximum water volume corresponds to 1/b (Eq.(2)),equal to 72.46l.This is to be compared with the total volume of voids including the technological void and the soil porosity:69.1l.V max¼lim t →∞V t ðÞ¼limt →∞1¼12During hydration,both the axial and radial swelling pressureswere recorded by the total pressure sensors (see Figure 3)and the results are shown in Fig.10.The data by the sensor located at 1.20m section for the axial swelling pressure measurement were unfortunately not available;only the axial swelling pressure values at 0m section are presented.This pressure increased at an almost constant rate and reached 1.63MPa after 367days.For the radial swelling pressure,the evolution rates were very different for the three sensors (see Figure 3);the pressure values reached were 1.78MPa,0.56MPa and 1.05MPa for sensors L-01,L-02and L-03,respectively.This indicates the heterogeneous radial swelling under the in situ conditions.3.2.Small-scale testFig.11shows the measured water in flow over time.Once the water supply was connected to the bottom inlet,water volume increased rapidly and reached 49ml in a few minutes.This value corresponded exactly to the volume of technological void (49ml).Fig.4.Experimentaldevices.Fig.5.Sample preparation.82Q.Wang et al./Engineering Geology 162(2013)79–87Afterwards,water volume increased gradually to reach a maximum value of 70.6ml.No more water could in filtrate after about 200days.The total volume of void (including the technological void V tech and the void inside the soil V v −s )that could be filled with water was esti-mated at 69.1ml.The result shows that a little more water was injected with respect to the estimated one (70.6ml against 69.1ml),but the dif-ference is quite small.For further analyzing the evolution of water volume,the time/water volume (day/ml)is plotted versus time in Fig.12.As in the case of in situ test,a straight line is obtained justifying a hyperbolic relationship between the water volume and the elapsed time (Eq.(1)).The value of 1/b corresponds to the maximum volume of water:1/b =71.43ml,which is very close to the measured water volume (70.6ml).Figs.13and 14depict the evolution of swelling pressure in the first stage (i.e.initial saturation phase).Once water was injected into the specimen,the axial swelling pressure increased very quickly (Figure 14).After about 2days,the swelling pressure reached a first stability stage (1.30MPa)and it restarted to increase on the 4th day.When the swelling pressure reached 1.45MPa after about 12days,a signi ficant decrease of swelling pressure occurred and a minimum value of 0.70MPa was reached.Afterwards,the swelling pressure increased again after about 33days (Figure 13),but at a slower rate.In addition,the evolution curve shows fluctuating pattern.The swelling pressure reached a mean value of 1.80MPa after 300days and then fluctuated in the range of 1.75–1.95MPa.The axial deformation during the swelling pressure development was also recorded,and shown in Fig.13.It followed the same trend as the swelling pressure.Note however that the variation of displace-ment was smaller than 0.2mm.It represents 0.16%of the specimen height (120mm),suggesting a satisfactory control of axial displace-ment in this stage.According to the data obtained in the first stage (Figure 13),no obvious swelling pressure increase occurred during a period of 50days from day 300to day 350.Thus,it was decided to start the sec-ond stage.For this purpose,the con fining pressure was removed on day 350,allowing the free swell.Changes in axial swelling strain were recorded and presented in Fig.15.The uplifting of load cell led to an in-stantaneous rebound of 1.1%(1.4mm/120mm).Afterwards,the axial swelling strain increased almost linearly at a rate of 0.145mm/day.Following this rate,20%of swelling strain was expected to be reached after 157days.In order to reduce the test duration,two-side in filtration was applied on day 364.This resulted in an increase of the swelling strain rate to 0.588mm/day,which is four times faster than that with one-side in filtration.The expected value of 20%(24mm)was reached on day 400.The piston was then re-blocked automatically to start Stage 3.Note that the measured axial swell was 24.4mm.The evolution of swelling pressure was then measured again and the results are presented in Fig.16.Small fluctuation was observed and this fluctuation can be attributed to the daily temperature varia-tions.As expected,the evolution curve follows a hyperboliccurveFig.6.A schematic description of the three stages of the small-scale test.LVDTFig.7.Lifting of load cell for free swell.83Q.Wang et al./Engineering Geology 162(2013)79–87with a decreasing rate over time.It reached stabilization on day 520with a final swelling pressure of 0.18MPa.parison and discussionIt was observed that more water in filtrated into the soil than that calculated by considering the technological void and the soil porosity in both the in situ test (71.39l)and laboratory small-scale test (70.60ml).Even though the water volume has not yet reached stabi-lization in the in situ conditions,the discrepancy is found to be larger than in the small-scale test.This can be related to the natural condi-tions of the in situ test,where some water intake by the host-rock did occur.With a well-controlled condition in the small-scale test,the larger in filtrated water obtained may be related to the low water density (1.00Mg/m 3)considered in the determination of soil void ratio.Indeed,for high plasticity materials as the MX80bentonite,the water density can be much higher than 1.00Mg/m 3(Marcial,2003;Villar and Lloret,2004;Lloret and Villar,2007;Jacinto et al.,2012).This is in agreement with the observation from the KBS-3H mock-up test (Börgesson et al.,2005).Regarding the evolution of water volume,a hyperbolic relation-ship between the injected water volume and elapsed time was obtained in both tests.Accordingly,the maximum water volume was estimated at 72.46l and 71.43ml for the in situ and small-scale tests,respectively.To compare the evolution curve at different scales,the water volume was normalized by using these two values.The nor-malized water volume is equal to the ratio of water volume at time t (V t )to the maximum water volume that can be injected (72.46l and 71.43ml for the in situ and small-scale test,respectively).In terms of time scale,an upscaling ratio of 2.5(in situ test/small-scale test)was found from the normalized water volume shown in Fig.17,where very similar evolution curves (normalized water volume versus normalized time)were obtained for the two tests (in situ and small-scale tests).This upscaling ratio is much smaller than that estimated based on the consolidation theory by considering the experiment scale and hydration conditions:according to the in filtration length,the hydration rate of the in situ test should be 100times lower than in the small-scale test (1/10).As the two-side in filtration applied in the in situ test increased the hydration rate by 4times,the upscaling ratio should be equal to 25(in situ test/small-scale test),still tenElapsed time (day)I n j e c t e d w a t e r v o l u m e (L )Fig.8.Injected water volume versus time.Elapsed time (day)T i m e /w a t e r v o lu m e (d a y /L )Fig.9.Time/water volume versus elapsed time after water rejection.Elapsed time (day)S w e l l i n g p r e s s u r e (M P a )Fig.10.Evolution of swelling pressure.102030405060708004080120160200Elapsed time (day)I n j e c t e d w a t e r v o l u m e (m L )V tech = 49.0 mLTotal volume of voidFig.11.Water volume injected into the specimen.84Q.Wang et al./Engineering Geology 162(2013)79–87times larger than the rate identi fied from the measurements.In fact,under the field conditions,water may fill some voids between the pre-compacted disks during the first minutes (0.15m thick,see Figure 2).This in filtration length of 0.15m leads to an upscaling ratio to 0.56.The upscaling ratio of 2.5observed is possibly related to the combined effect of these two phenomena.Using this upscaling ratio,the axial swelling pressure evolution curve obtained from the in situ test (Figure 10)was normalized and presented in Fig.18,together with the axial swelling pressure mea-sured in the first stage of the small-scale test.Except for the first 33days (see Figure 13)where signi ficant decrease of swelling pres-sure occurred in the small-scale test,the normalized curve of swelling pressure for the in situ test joins the curve of the small-scale test,con-firming the upscaling ratio of 2.5.Based on the results of small-scale test,this ratio allows the time needed to reach the stabilization of swelling pressure in the in situ test to be estimated.It can be observed in the small-scale test that the swelling pressure reached the stability after about 300days.Thus,155days more is needed to reach the maximum swelling pressure at the normalized time scale for the in situ test.Accordingly,it can be estimated that the maximum swellingy = 0.0140 x + 0.0524R 2= 0.99870.00.51.01.52.02.53.004080120160200Elapsed time (day)T i m e /w a t e r v o l u m e (d a y /m L )Fig.12.Time/water volume versus elapsed time.050100150200250300350400Elapsed time (day)S w e l l i n g p r e s s u r e (M P a )-0.100.10.20.30.40.50.6D i s p l a c e m e n t (m m )Fig.13.Evolution of axial swelling pressure and displacement in the firststage.0.00.40.81.21.605101520253035Elapsed time (day)S w e l l i n g p r e s s u r e (M P a )Fig.14.Evolution of swelling pressure during the first 33days.0.00.51.01.52.02.53.03.54.0350355360365Elapsed time (day)S w e l l i n g s t r a i n (m m )(a) Evolution of axial swelling strain during the first051015202530350360370380390400410S w e l l i n g s t a i n (m m )Elapsed time (day)One-side infiltrationTwo-side infiltrationε= 20 %(b) Evolution of axial swelling strainFig.15.Evolution of axial swelling strain during Stage 2.85Q.Wang et al./Engineering Geology 162(2013)79–87pressure in the in situ test should be reached after 388days,corre-sponding to 754days starting from the time of water injection.As regards the kinetics of the axial swelling pressure in the first 33days of small-scale test,stabilization was attained after about 2days at 1.30MPa and restarted to increase from day 4(Figure 14).Wang et al.(2013)observed similar phenomenon in swelling pres-sure tests on smaller samples (35mm in diameter,10mm in height)with the same percentage of technological void.This is related to changes in microstructure of soil.With the progress of hydration,the ef-fect of microstructure changes is reduced,resulting in the re-increase in swelling pressure (Cho et al.,2000;Baille et al.,2010).When the swell-ing pressure reached 1.45MPa on day 12,a signi ficant decrease of swelling pressure occurred,reaching a minimum value of 0.70MPa.This decrease can be attributed to the filling of the technological void.Afterwards,the swelling pressure increased again from day 33.How-ever,the evolution curve showed fluctuation due to the reorganization of soil microstructure under the effect of technological void.On the contrary,the axial swelling pressure measured in the in situ test increased constantly without any fluctuation.This can be re-lated to a coupled effect of large-scale and pressure sensor location.Indeed,in the small-scale test,the axial swelling pressure was mea-sured on the whole cross section and any changes in axial pressure could be monitored.However,in the in situ test,the total pressure sensor was installed in the center of the cross section (Figure 3)and the axial swelling pressure herein corresponded to the local one.Therefore,the axial swelling pressure changes that occurred in the zone of technological void could not be detected by this sensor.After the axial swelling pressure of small-scale test reached stabi-lization,removing the axial con fining restriction led to a very small rebound of 1.1%(1.4mm/120mm).This observation provides valu-able information for the con finement removal phase of the in situ test.During the free swelling process (Stage 2),a swelling strain evo-lution rate (swelling strain/time)of 0.588mm/day was observed under two-side in filtration bined with the upscaling ratio,this result (0.588mm/day)allows prediction of the swelling strain evolution in the in situ test when simulating an incidental decrease of the swelling pressure caused by a failure of the concrete con fining structure.As the piston was re-blocked automatically in the small-scale test (Stage 3),swelling pressure developed again.This indicates the favor-able sealing capacity after filling of the technological void.If a saturation defect or a con fining structure failure occurs in the field,a 20%addi-tional void could be sealed.A final swelling pressure of 0.18MPa was attained,which is in accordance with the swelling pressures measured in the laboratory on smaller samples (Wang et al.,2013):after the 20%free swell (24.5mm),the dry density decreased to a final value of 1.39Mg/m 3;this corresponds to a swelling pressure of 0.23MPa.5.ConclusionIn the context of SEALEX project,a laboratory small-scale test (1/10)was carried out to investigate the recovery capacity of bentonite-based plug with technological void.By comparison with the first results from the in situ test PT-N1,the phenomena identi fied in the laboratory were used for interpreting and estimating the results from the in situ test.During the saturation process,a hyperbolic relationship between the injected water volume and elapsed time was obtained in both laboratory and field tests.However,a little more water was injected as compared to the water volume estimated by considering the total rger discrepancy was found for the in situ test due to the effect of natural conditions.Elapsed time (day)S w e l l i n g p r e s s u r e (M P a )23242526D i s p l a c e m e n t (m m )Fig.16.Evolution of axial swelling pressure during Stage 3.0.70.80.91.01.1050100150200N o r m a l i z e d v o l u m eNormalized time (day)In-situ test PT-N1Small-scale test (1/10)Fig.17.Normalized water volume versus normalized time.050100150200250300350400S w e l l i n g p r e s s u r e (M P a )Elapsed time (day)Fig.18.Swelling pressure versus normalized time.86Q.Wang et al./Engineering Geology 162(2013)79–87。
科技英语翻译第一二章部分
1.1 翻译的标准第1节翻译练习1The power plant is the heart of a ship.The power unit for driving the machines is a 50-hp induction motor.动力装置是船舶的心脏。
驱动这些机器的动力装置是一台50马力的感应电动机。
第1节翻译练习2Semiconductor devices, called transistors, are replacing tubes in many applications.Cramped conditions means that passengers’ legs cannot move around freely.All bodies are known to possess weight and occupy space.半导体装置也称为晶体管,在许多场合替代电子管。
我们知道,所有的物体都有重量并占据空间。
空间狭窄,旅客的两腿就不能自由活动。
第1节翻译练习3The removal of minerals from water is called softening.A typical foliage leaf of a plant belonging to the dicotyledons is composed of two principal parts: blade and petiole.去除水中的矿物质叫做软化。
双子叶植物典型的营养叶由两个主要部分组成:叶片和叶柄。
1.2 对译者的要求第4节翻译练习1Einstein’s relativity theory is the only one which can explain such phenomena.All four (outer planets) probably have cores of metals, silicates, and water.爱因斯坦的相对论是能解释这种现象的唯一理论。