GIS本科课程信息表(中英文)
地理信息科 专业课程设置

VirtualRealityTechnology andApplication
2.5
48
32
16
资环
学院
7
A8A9
B8B9
C5C6C7C8
综合实践(20.5%)
综合实践
I
1305101
军训(含国防教育)
MilitaryTraining (includingNationalDefenseEducation)
Engineering Training(C)
1.0
1周
机电
学院
1
A2
B2
C1C2C3C4
综合实践
II
2065421
地学基础综合实习
ComprehensivePractice of basicGeography
2.0
2周
必修
26.0学分
资环
学院
4
A6A2
B2
C5C6C7C8
3065422
地图制图综合实习
ComprehensivePractice ofCartography
2.5
2.5周
资环
学院
6
A9A10
B10
C5C6C7C8
3065423
遥感综合实习
Comprehensive PracticeofRemote Sensing
3.0
3周
资环
学院
6
A8A10
B10
C6C7C9C10
4065424
专业应用综合实习
B2
C2
科技发展与文明传承
Scientific and Technology Development and Cultural Heritage Preservation
GIS应用与开发课程教学大纲

GIS应用与开发课程教学大纲课程名称:GIS应用与开发英文名称:Applications and Design of GIS课程编码:x4070371学时数:32其中实践学时数:16 课外学时数:0学分数:2.0适用专业:测绘工程一、课程简介《GIS应用与开发》是测绘工程专业的一门专业选修课。
课程以基于二次开发方式的基本GIS功能的实现为内容,为学生从事GIS开发工作打下基础。
通过对《GIS应用与开发》课程的学习,使学生获得通用某一种GIS组件实现基本GIS 功能如地理数据显示、缩放、拖动、图层控制的相关知识,培养学生具备基础的GIS二次开发能力。
二、课程目标与毕业要求关系表三、课程教学内容、基本要求、重点和难点(一)GIS二次开发的概念教学内容:GIS二次开发的概念,二次开发与底层开发之间的本质区别,常见的二次开发方式。
基本要求:理解GIS二次开发的概念,理解二次开发与底层开发之间的本质区别,了解常见的二次开发方式。
重点:GIS二次开发的概念,二次开发与底层开发之间的本质区别。
难点:GIS程序实现原理。
(二)基本地图功能教学内容:地理数据的浏览(显示、缩放、平移)与浏览辅助(全图显示)功能。
基本要求:熟练掌握以二次开发方式实现具有地理数据浏览和浏览辅助功能的程序。
重点:地理数据的显示、缩放、平移、全图显示。
难点:地图控件对窗口尺寸的适应。
(三)地图图层的基本功能教学内容:图层添加、图层删除、图层移动、图层可见性控制。
基本要求:熟练掌握以二次开发方式实现具有图层的添加、删除、移动、可见性控制功能的程序。
重点:图层添加、图层删除、图层移动、图层可见性控制。
难点:将图层相关功能集成到右击菜单中。
(四)显示属性数据教学内容:显示指定图层的属性数据。
基本要求:熟练掌握以表格窗口方式展示指定图层的属性数据的程序实现技能。
重点:属性数据与表格空间的结合。
难点:数据在窗口之间的传递。
四、教学方式及学时分配五、课程其他教学环节要求实训环节采用上机操作的方式进行。
GIS专业英语第一章翻译
D efinitions of GIS“GIS”is an acronym meaning of Geographic Information System . In order to provide a good understanding of GIS , the following two definitions given by Rhind ( 1989 ) and the United States Geological Survey ( USGS , 1997 ) respectively are presented first.地理信息系统”是一个缩写含义,地理信息系统。
为了提供一个很好的了解,下面给出的定义由兰德(1989)和美国地质调查局(美国地质勘探局,1997)分别是第一次提出.1 “. . . . a system of hardware, software, and procedures designed to support the captu re, management, manipulation, analysis, modeling, and display of spatially referenced data for solving complex planning and manage ment problems .”1“GIS是一个由硬件,软件,和程序设计,支持捕获,管理,处理,分析,建模,并显示空间参照的数据,以解决复杂的规划和管理的问题的一个系统。
”2 “. . . . a computer system capable of assembling , storing, manipulating, and displaying geographically referenced information , i . e ., data identified according to their location .”2“。
地理信息系统专业介绍

2
数字摄影测量
(Digital Terrain Model)
2
2
数字地图
(Digital Map)
2
2
数字图像处理
(Digital Remote Sensing Image Processing)
3
3
地理建模
(Modeling Geography)
2
2
GIS专题讲座
(GIS Thematic Lecture)
(Cadastre Administration)
2
2
计算机网络技术
(Computer Network Technology)
2
2
城市规划CAD
(Urban Planning CAD)
2
2
旅游学
(Introduction to Tourism)
2
2
环境规划与评价
(Environment Planning and Assessment)
2
2
国土资源信息系统
(Land Information System)
2
2
运筹学
(Operational Research)
2
2
资源学导论
(Principles of Resources Science)
2
2
环境科学导论
(Principles of Environmental Science)
2
2
多媒体技术与应用
3
3
形势与政策
(Moral Character)
1
1
军事理论与军事高科技
(Military Theory)
GIS专业英语原文及翻译结果

Is What You See, What You Get? GeospatialVisualizations Address Scale and UsabilityAashishChaudhary and Jeff BaumesUnlimited geospatial information now is at everyone’s fingertips with the proliferation of GPS-embedded mobile devices and large online geospatial databases. To fully understand these data and make wise decisions, more people are turning to informatics and geospatial visualization, which are used to solve many real-world problems.To effec tively gather information from data, it’s critical to address scalability and intuitive user interactions and visualizations. New geospatial analysis and visualization techniques are being used in fields such as video analysis for national defense, urban planning and hydrology.Why Having Data Isn’t Good Enough AnymorePeople are realizing that data are only useful if they can find the relevant pieces of data to make better decisions. This has broad applicability, from finding a movie to watch to elected officials deciding how much funding to allocate for an aging bridge. Information can easily be obtained, but how can it be sorted, organized, made sense of and acted on? The field of informatics solves this challenge by taking large amounts of data and processing them into meaningful, truthful insights.In informatics, two main challenges arise when computers try to condense information down to meaningful concepts: disorganization and size. Some information is available in neat, organized tables, ready for users to pull out the needed pieces, but most is scattered across and hidden in news articles, blog posts and poorly organized lists.Researchers are feverishly working on new ways to retrieve key ideas and facts from these types of messy data sources. For example, services such as Google News use computers that constantly "read" news articles and posts worldwide, and then automatically rank them by popularity, group them by topic, or organize them based on what the computer thinks is important to viewers. Researchers at places such as the University of California, Irvine, and Sandia National Laboratories are investigating the next approaches to sort through large amounts of documents using powerful supercomputers.The other obstacle is the sheer vo lume of data. It’s difficult to use informatics techniques that only work on data of limited size. Facebook, Google and Twitter have data centers that constantly process huge quantities of information to deliver timely and relevant information and advertisements to each person currently logged on..Figure 1. A collection of videos are displayed without overlap (top). The outline color represents how close each video matches a query. An alternate view (bottom) places thevideos on top of each other in a stack, showing only the strongest match result.Informatics is a key tool, but it’s not enough to simply find these insights that explain the data. Geospatial visualization bridges the gap from computer number-crunching to human understanding. If informatics is compared to finding the paths in a forest, visualization is like creating a visual map of those paths so a person can navigate through the forest with ease.Most people today are familiar with basic geospatial visualizations such as weather maps and Web sites for driving directions. The news media are starting to test more-complex geospatial visualizations such as online interactive maps to help navigate politicians’ stances on issues, exit polls and precinct reports during election times. People are just beginning to see the impact that well-designed geospatial visualizations have on their understanding of the world..Geospatial Visualization in the Real WorldPeople have been looking at data for decades, but the relevant information that accompanies the data has changed in recent years. In late 1999, Esri released a new software suite, ArcGIS, that could use data from various sources. ArcGIS provides an easy-to-use interface for visualizing 2-D and 3-D data in a geospatial context. In 2005, Google Earth launched and made geospatial visualization available to the general public.Geospatial visualization is becoming more significant and will continue to grow as it allows people to look at the totality of the data, not just one aspect. This enables better understanding and comprehension, because it puts the data in context with their surroundings. The following three cases demonstrate geospatial visualization use in real-world scenarios:1. Urban PlanningPlanners use geomodeling and geovisualization tools to explore possible scenarios and communicate their design decisions to team members or the general public. For example, urban planners may look at the presence of underground water and the terrain’s surrounding topology before deciding to build a new suburb. This is relevant for areas around Phoenix, for example, where underground water presence and proximity to a knoll or hill can determine the suitability of a location for construction.Figure 2. Videos from the same location are partially visible, resembling a stack of cards. Each video is outlined by the color representing the degree to which it matches the query.Looking at a 3-D model of a house with its surroundings gives a completely different perspective than just looking at the model of a house by itself. This also can help provide clear solutions to problems, such as changing the elevation of a building’s base to make it stand better.Urban planning is one of the emerging applications of computer-generated simulation. Cities’ rapid growth places a strain on natural resources that sustain growth. Water management, in particular, becomes a critical issue.The East Valley Water Forum is a regional cooperative of water providers east of Phoenix, and it’s designing a water-management plan for the next 100 years. Water resources in this region come from the Colorado River, the Salt River Project, groundwater, and other local and regional water resources. These resources are affected directly and indirectly by local and global factors such as population, weather, topography, etc.To best understand the relationship among water resources and various factors, the Arizona Department of Water Resources analyzes hydrologic data in the region using U.S. Geological Survey MODFLOW software, which simulates the status of underground water resources in the region. For better decision making and effective water management, a comprehensive scientific understanding of the inputs, outputs and uncertainties is needed. These uncertainties include local factors such as drought and urban growth.Looking at numbers or 2-D graphs to understand the complex relationship between input, output and other factors is insufficient in most cases. Integrating geospatial visualizations with MODFLOW simulations, for example, creates visuals that accurately represent the model inputs and outputs in ways that haven’t been previously presented.For such visualizations, two water surfaces are positioned side-by-side—coming from two different simulations—with contour lines drawn on top. In this early prototype, a simple solution—providing a geospatial plane that can be moved vertically—brings the dataset into a geospatial context. This plane includes a multi-resolution map with transparency. Because these water layers are drawn in geospatial coordinates, it matches exactly with the geospatial plane. This enables researchers to quickly see the water supplies of various locations.2. Image and Video AnalysisDefense Advanced Research Projects Agency launched a program, Video and Image Retrieval nd Analysis Tool (VIRAT), for understanding large video collections. The project’s core requirement is to add video-analysis capabilities that perform the following:• Filter and prioritize massive amounts of archived and strea ming video based on events.• Present high-value intelligence content clearly and intuitively to video analysts.• Reduce analyst workload while increasing quality and accuracy of intelligence yield.Visualization is an integral component of the VIRAT system, which uses geospatial metadata and video descriptors to display results retrieved from a database.Analysts may want to look at retrieval result sets from a specific location or during a specific time range. The results are short clips containing the object of interest and its recent trajectory. By embedding these results in a larger spatiotemporal context, analysts can determine whether a retrieved result is important.3. Scientific VisualizationU.S. Army Corps of Engineers’ research organ ization, the Engineer Research and Development Center, is working to extend the functionality of the Computational Model Builder (CMB) environment in the area of simulation models for coastal systems, with an emphasis on the Chesapeake and Delaware bays.The CMB environment consists of a suite of applications that provide the capabilities necessary to define a model (consisting of geometry and attribute information) that’s suitable for hydrological simulation. Their simulations are used to determine the impact that environmental conditions, such as human activities, have on bodies of water.Figure 3. Google Earth was used to display Chesapeake Bay’s relative salt (top) and oxygen (bottom) content (higher concentrations in red).One goal is to visualize simulation data post-processed by CMB tools. Spatiotemporal information, for example, is included in oxygen content and salinity data. Drawing data in geospatial context lets users or analysts see which locations are near certain features, giving the data orientation and scale that can easily be understood. Figure 3 shows the oxygen and salt content of Chesapeake Bay, where red shows higher concentrations and blue shows lower concentrations.Moving ForwardVisualizations that can be understood at all levels will be key in politics, economics, national security, urban planning and countless other fields. As information becomes increasingly complex, it will be harder for computers to extract and display those insights in ways people can understand.More research must be done in new geospatial analysis and visualization capabilities before we drown in our own data. And it’s even more important to educate people in how to use and interpret the wealth of analysis tools already available, extending beyond the basic road map.High schools, colleges and the media should push the envelope with new types of visuals and animations that show data in richer ways. The price of explaining these new views will be repaid when audiences gain deeper insights into the real issues otherwise hidden by simple summaries. Progress isn’t limited by the volume of available information, but by the ability to consume it.翻译:你所看到的,你得到了什么?地理空间可视化的处理规模和可用性作者:AashishChaudhary和包密斯·杰夫无限的空间信息现在就在每个人的指尖,其与扩散的嵌入式GPS移动设备和大型网上地理空间数据库。
ARCGIS英汉对照
AAbsolute X,Y X,Y的绝对坐标Abstract 抽象,抽象类Access 数据库文件Activate 激活,使数据框架进入操作状态Alias 字段假名Aligned,alignment 字符注记对齐Allocation 空间配置,临近分配Animation 动画Annotation 地图注记、注记要素Application 应用,应用单元Attribute 属性Attribute table 属性表B Background 地图显示、制图的背景Band 影像波段Barrier 网络障碍Basic tool bar 基本工具条BMP 一种通用的图像数据格式Border 地图外框线、图廓线Brightness 图像显示亮度Buffer 临近、缓冲Buffer zone 临近区、缓冲区CCAD feature dataset CAD数据集Callout 引线式注记Catalog ArcCatalog的目录表、目录窗口Categories 定性分类Cell 栅格单元Cell size 栅格单元大小Charts 统计图(同Graph)Class 类Classification 分类Clip 裁剪,一种叠合处理方式Coclass visual basic 的组件类Closest facility 最近设施Cluster tolerance 线簇容差Color ramp 色彩过渡表Commands 命令Connectivity 网络连接Contract 图像显示的对比度Contour 等值线,等高线Control point 校正坐标用的控制点Coordinate system 坐标系,坐标系统Copy parallel 平行复制Cost distance 考虑成本的距离Cost weighted distance 以成本为权重的距离Coverage ArcInfo的一种数据格式Customize 用户化,自定制Cut/fill 填挖方DDangle node 悬结点Data frame 数据框架Data frame properties 数据框架特征设置对话框Data source 数据源Data view 数据视图Dataset 数据集dBASE 一种数据库管理软件的名称DBF,dbf 一种属性数据库的文件格式(dBASE的)Delta X,Y 相对偏移坐标Density 密度DGN 一种CAD数据文件格式Digitizing 数字化,矢量要素输入计算机Dimensions 相对距离注记Dirty area 问题区,可能存在违反拓扑规则要素的范围Display units 地图显示单位Dissolve 多边形归并、融合Drawing tool bar 绘图工具条Drop shadow 使制图元素具有阴影效果Dot density 点密度地图DXF 一种CAD数据文件交换格式DWG 一种CAD数据文件格式EEdge 网络线段,网络边线Edge match 地图接边Element 图形元素Elevation 高程End 端点End node 线的终点Endpoint 同End nodeEqual interval 等间距分类Extend 线要素延伸Extent(s) 数据的空间范围Extensions 扩展、软件的扩展模块FFacility 设施Feature 要素、地理要素Feature attribute table 要素属性表Feature class 要素类Feature dataset 要素数据集Field 属性表的字段Fill symbol 填充符号Fillet 加圆角From end 网络线段的起点、端点GGeodatabase 地理数据库、空间数据库Geographic coordinate system 地理坐标系Geometric network 几何网络用于市政公用设施的网络数据模型Geoprocessing 地理处理、空间处理Gradient fill symbol 渐变填充符号Graduated color 颜色渐变图Graduated symbols 符号渐变图Graph 统计图Graphic 图形Graphic element 图形元素Graphic text 图形注记Grid 格网HHistogram 直方图(常用于影像分类)Hyperlink 超链接IIcon 图标Identify 要素识别,显示要素的属性Image 影像、图像Image adjust 影像配准Incident 网络分析中的事件Index 索引Info arcinfo的属性数据库,和coverage对应Impedance 网络阻抗Integer 整数型数据Intersect 交叉,一种叠合处理方式Interpolate,interpolation 插值、空间插值Item 数据项JJoin 连接,表和表连接Junction 网络中线段端点和端点的交汇处LLabel 地图标注、属性标注Latitude 纬度、纬线Layer 地图图层,专题图层Layer properties 图层特征Layer file 图层设置文件Layout 地图布局Layout view 地图布局视图Legend 图例Line(feature) 线、线状要素Line symbol 线状要素符号Linear reference 线性参照Longitude 经度、经线MMacro(s) 宏命令,宏语言Marker symbol 点要素符号Map document 地图文档Map elements 地图制图元素Map template 地图制图模板Map topology 地图拓扑Map units 地图单位Match to symbol in a style 匹配某个格式文件中的符号Merge 要素合并Metadata 元要素Multi band 多波段影像Multi-part feature 组合要素,一个要素有多部分合并而成Multiple attributes 多重属性NNatural breaks 自然区分类Neatline 图廓线、图框线、地图分割线Network 网络Network dataset 网络数据集No data 无值的栅格单元Nodata 同No dataNormalization 归一化North arrow 指北针OOverlay 叠合、叠置Overshoot 过长OMDs(object model diagrams) 对象模型图OLE(object linking and embedding) 对象连接和嵌入Oneway 交通单向行驶PPan 图形平移Path 基于栅格的路径Parallel 平行Perpendicular 垂线Personal Geodatabase 个人地理数据库Picture 图片Pixel 像元、像素Pixel value 栅格单元值、像素单元值Point(feature) 点元素Polygon(feature) 多边形要素Polyline(feature) 线要素Precision 精度Preview 预览Profile 剖面Projected coordinate system 投影坐标系Project 项目、工程Projective 投影变换Proportional symbols 比例分配图Proximity 邻近、相邻Pseudo node 伪结点Pyramids 金字塔数据结构、数据索引QQuantities 定量分类(地图)Quartile 等量分类(地图)Query builder 查询工具,条件组合查询Query text box 查询文本框RRank 等级Raster 栅格Reclassify 再分类、重分类Record 记录,属性表的行Reference scale 参照比例显示、制图Reflection 偏转角度Relate 表和表的关联、连接Relational 关系型、关系模型Report 报表Residual error 残差,坐标转换后控制点和参照点坐标的差距RMS(root mean square) 坐标转换残差、平均根方差Rotate 要素旋转Route 网络路径Rubber sheeting 橡皮拉伸、坐标拉伸Rule 规则,拓扑规则Rulers 标尺SScale 地图比例要素缩放Scale bar 比例尺、图形比例尺Scale range 比例范围Scale text 比例说明、文字型比例尺SDE(spatial database engine) 空间数据引擎Segment 线要素的某一段Select 选择Selectable layer 可选要素的图层Selected feature 被选要素、入选要素Selected layer 被选图层Selection 选择、选择集Service area 基于网络的服务区Shape 要素的几何类型Shapefile 一种空间数据格式Shortest path (基于栅格的)最短路径、最佳路径Sketch 任意线Slope 坡度Snap,snapping 捕捉Spatial adjustment 空间校正Spatial join 空间连接Spatial reference 空间参照Split 线要素打断,插入结点Standard tool bar 标准工具条Start node 线要素的起点、起结点Start point 文字注记的起始点Stop (网络)停靠站Stretch 拉伸,调整影像的显示灰度、颜色Style 地图符号式样Surface 地面、地表Summarize 汇总统计Symbol 符号Symbology 符号规则,用于控制要素显示符号的对话框Symbol property editor 符号特征编辑器TTable 表、属性表Table of contents 操作界面中的目录表Target(layer) 编辑的目标图层Template 模板、制图模板Thiessen (polygon) 泰森多边形Thumbnail 缩略图TIN(triangular irregular network) 不规则三角网Title 标题,地图标题、插图标题To end 线段的终点Tolerance 容差Topology 拓扑Topology relation 拓扑关系Topology rule 拓扑规则Transform 坐标转换Transparence 透明方式显示图层Transparency 图像显示的透明度Trim 线要素剪切UUndershoot 线过短Union 合并,一种叠合计算方式Unique values 唯一值Utility(network) 市政公共设施(网络)U-Turn 转弯调头VValue 属性值,数值取值VBA(visual basic for application) 编程语言Vector 矢量Vertex 线的拐点Viewshed 视域Visible 字段的可见性,地物的可见W Workspace 工作空间XXML(extensible markup language) 可扩展标记语言Z Zoom 图形缩放Zoom in 图形放大Zoom out 图形缩小。
【精品】GIS-毕业设计-文献翻译-中英文-地理信息系统网络应用电力系统克里特岛
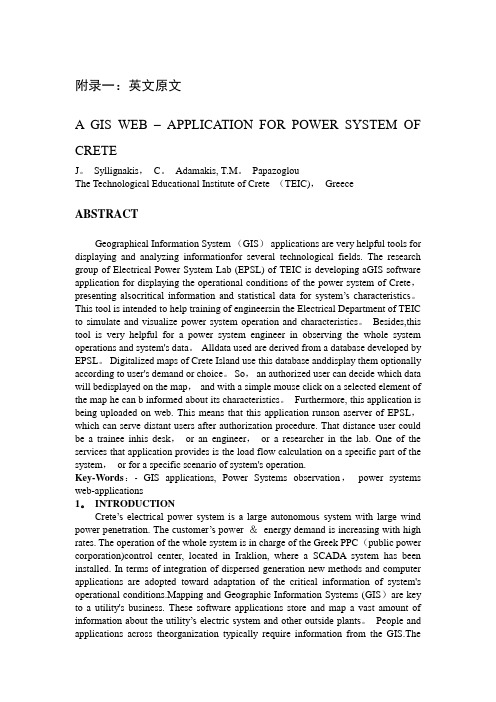
附录一:英文原文A GIS WEB –APPLICATION FOR POWER SYSTEM OF CRETEJ。
Syllignakis,C。
Adamakis, T.M。
PapazoglouThe Technological Educational Institute of Crete (TEIC),Greece ABSTRACTGeographical Information System (GIS)applications are very helpful tools for displaying and analyzing informationfor several technological fields. The research group of Electrical Power System Lab (EPSL) of TEIC is developing aGIS software application for displaying the operational conditions of the power system of Crete,presenting alsocritical information and statistical data for system’s characteristics。
This tool is intended to help training of engineersin the Electrical Department of TEIC to simulate and visualize power system operation and characteristics。
Besides,this tool is very helpful for a power system engineer in observing the whole system operations and system's data。
地理信息科学专业课程设置

2062402
自然地理学(上)
Physical Geography(I)
3.0
48
48
必修
16.5学分
资环
学院
3
A6
B8B11
C5C6
2062403
自然地理学(下)
Physical Geography(II)
3.0
48
48
资环
学院
4
A6
B8B11
C5C6
2062404
人文地理学
Human Geography
学院
6
A9A11
B9
C5C6C7C8
4064420
精准农业
Precision Agriculture
2.0
32
32
资环
学院
7
A9
B9B10
C6C7C9
4064432
数据结构
Data Structures
2.5
56
40
16
资环
学院
7
A7A11
B9
C8C9
4064430
数字地球原理与技术
Theory and Technology of Digital Globe
空间分析与模型
Spatial Analysis and Modeling
2.0
40
24
16
资环
学院
6
A9A11
B9
C5C6C7C8
3064415
网络地理信息系统
Web Geographic Information System
2.0
40
24
- 1、下载文档前请自行甄别文档内容的完整性,平台不提供额外的编辑、内容补充、找答案等附加服务。
- 2、"仅部分预览"的文档,不可在线预览部分如存在完整性等问题,可反馈申请退款(可完整预览的文档不适用该条件!)。
- 3、如文档侵犯您的权益,请联系客服反馈,我们会尽快为您处理(人工客服工作时间:9:00-18:30)。
This course is an introduction to the basic theory of visualization and spatial information. The course will mainly examine the following subjects: (i) the foundation of realizing visualization; (ii) the technology of visualization, including point and two dimensional scalar data; (iii) the visualization of 3D scalar data field; (iv) the visualization of vector field; (v) the computer dynamic visualization; (vi) the 3D visualization theory of spatial information.
Course Information(课程信息表)
Colleges andUnit(学院): School of Geoscience(地球科学学院)
Major(专业):GIS(地理信息系统)
Course Name
(课程名称)
Computer Graphics(计算机图形学)
Course No
(课程编码)
Instructor
(主讲教师)
()
Prerequisites
(先修课程):
Data Structure(数据结构)Principles of Database(数据库原理)
Course Description(课程简介):
中文:
本课程是介绍人工智能与专家系统的基础理论课程,该课程主要研究内容包括:1、人工智能中常用的知识表示技术;2、启发式搜索策略;3、消解原理;4、产生式系统;5、LISP程序设计。
Multimedia Technology(计算机多媒体技术)
Course No
(课程编码)
132017
Total Hours
(总学时)
32
Credits
(学分)
2
Semester
ቤተ መጻሕፍቲ ባይዱ(开课学期)
7
Course Type
(课程性质)
Compulsory(必修)□
Elective(选修)■
Instructor
英文:
This course is an introduction to thebasictheory ofartificial intelligenceandexpert system.The course will mainly examine the following subjects: (i) the technology of knowledge representation commonly used in artificial intelligence; (ii) the heuristic search; (iii) the principle of resolution; (iv)theproduction system; (v) LISP program design.
Principles of WebGIS(网络地理信息系统原理)
Course No
(课程编码)
132083
Total Hours
(总学时)
32
Credits
(学分)
2
Semester
(开课学期)
6
Course Type
(课程性质)
Compulsory(必修)□
Elective(选修)■
Instructor
学院(系、部)教学委员会主任签字:
年月日
学院(系、部)教学院长(主任)签字:
年月日
Course Information(课程信息表)
Colleges andUnit(学院): School of Geoscience(地球科学学院)
Major(专业):GIS(地理信息系统)
Course Name
(课程名称)
英文:
This course is an introduction to thebasictheory andmethodofWebGIS.The course will mainly examine the following subjects: (i) the basic principle of WebGIS technology; (ii) the data transfer model commonly used in WebGIS; (iii)thespatial data organization of WebGIS; (iv) the mobile GIS; (v)thedevelopment of application, including ArcIMS and ArcGIS Server; (vi) the open source platform of WebGIS
英文:
This course is an introduction to the theory andmethodofmultimedia technology.The course will mainly examine the following subjects: (i) the computer multimedia concept; (ii) the acquisition and processing of information, including video and audio; (iii)thedata compression technology; (iv)theproduction technology of hypertext and hypermedia; (v)The design principle and method of multimedia products.
(主讲教师)
()
Prerequisites
(先修课程):
Principles of Geographic Information System
(地理信息系统原理)
Network Programming(网络编程)
Course Description(课程简介):
中文:
本课程是介绍网络地理信息系统基础理论及实现方法的课程,该课程主要研究内容包括:1、WebGIS基本技术原理;2、WebGIS常用的数据传输模型;3、Web GIS空间数据组织;4、移动GIS;5、ArcIMS及ArcGIS Server开发;6、开源WebGIS平台
Artificial Intelligence & Expert System(人工智能与专家系统)
Course No
(课程编码)
132008
Total Hours
(总学时)
32
Credits
(学分)
2
Semester
(开课学期)
7
Course Type
(课程性质)
Compulsory(必修)□
Elective(选修)■
学院(系、部)教学委员会主任签字:
年月日
学院(系、部)教学院长(主任)签字:
年月日
Course Information(课程信息表)
Colleges andUnit(学院): School of Geoscience(地球科学学院)
Major(专业):GIS(地理信息系统)
Course Name
(课程名称)
(主讲教师)
()
Prerequisites
(先修课程):
Basis ofComputerEngineering;(计算机基础)
Course Description(课程简介):
中文:
本课程是介绍计算机多媒体技术理论及方法的应用课程。该课程主要研究内容包括:1、计算机多媒体概念;2、视频、音频信息的获取与处理;3、数据压缩编码技术;4、超文本和超媒体的制作技术;5、多媒体产品的设计原则和方法。
学院(系、部)教学委员会主任签字:
年月日
学院(系、部)教学院长(主任)签字:
年月日
Course Information(课程信息表)
Colleges andUnit(学院): School of Geoscience(地球科学学院)
Major(专业):GIS(地理信息系统)
Course Name
(课程名称)
学院(系、部)教学委员会主任签字:
年月日
学院(系、部)教学院长(主任)签字:
年月日
Course Information(课程信息表)
Colleges andUnit(学院): School of Geoscience(地球科学学院)
Major(专业):GIS(地理信息系统)
Course Name
(课程名称)
Visualization of Spatial Information(空间信息可视化)
Course No
(课程编码)
Total Hours
(总学时)
32
Credits
(学分)
2
Semester
(开课学期)
7
Course Type
(课程性质)
Compulsory(必修)□
Elective(选修)■
Course Description(课程简介):
中文:
本课程是介绍计算机图形理论基础课程。该课程主要研究内容包括:1、计算机图形系统组成;2、直线、圆基本图形生成算法;3、图形变换;4、曲线和曲面生成;5、OpenGL程序设计。