matlab答案
matlab 部分答案
课
D=A.*B
后
答
MATLAB: A=[1,4,8,13; -3,6,-5,-9; 2,-7,-12,-8];
案
网
8 13 ⎤ ⎡ 5 4 3 −2 ⎤ ⎡1 4 ⎥ ⎢ ⎥ 10. 设 A = ⎢ −3 6 −5 −9 ⎥ , B = ⎢ ⎢ 6 −2 3 − 8 ⎥ ⎢ ⎢ ⎣ −1 3 −9 7 ⎥ ⎦ ⎣ 2 −7 −12 −8⎥ ⎦
2
+ y2 )
,求定义域 x = [−2, 2] , y = [−2, 2] 内的 z 值(网格取 0.1 见方) ,并绘制
15.设 x = cos(t ) , y = sin( Nt + α ) ,若 N = 2 , α = 0, π / 3, π / 2, π ,在 4 个子图中分别画出其
MATLAB: t=0:0.01:3; N=2;
4. 用三点公式计算 y=f(x)在 x=1.0,1.2 处的导数值, f(x)值由下表给出; x f(x)
5
1.0 0.25
4
1.1
ww w
1.2
2
.k
1.3 0.1890 1.4 0.1736
后
7. 求解下列线性常微分方程的解析解。
答
6.设方程的根为 x = [−3, −5, −8, −9] ,求它们对应的 x 多项式的系数。
π
2π
课
=∫
0
17.设 ( X , Y ) 的概率密度为
网
⎧ d 2 x dy + − x = et ⎪ ⎪ dt 2 dt ⎨ 2 ⎪ d y + dx + y = 0 ⎪ ⎩ dt 2 dt
dy 。 dx
2π
matlab考试题库及答案大学
matlab考试题库及答案大学# MATLAB考试题库及答案大学一、选择题1. MATLAB中用于生成0到1之间均匀分布随机数的函数是: - A. rand- B. randi- C. randperm- D. randn答案:A2. 下列哪个命令可以用于绘制函数图像?- A. plot- B. text- C. title- D. xlabel答案:A3. MATLAB中,以下哪个不是矩阵的属性?- A. size- B. length- C. rank- D. transpose答案:D4. 以下哪个函数可以用于求解线性方程组?- A. solve- B. linsolve- C. linprog- D. fsolve答案:A5. MATLAB中,用于计算矩阵特征值的函数是:- A. eig- B. eign- C. eigen- D. eigenvalue答案:A二、填空题1. MATLAB的基本数据单位是________。
答案:矩阵2. 使用MATLAB进行数值计算时,可以利用________来存储数据。
答案:变量3. MATLAB中的向量可以是________或________。
- 答案:行向量;列向量4. 矩阵的转置可以通过________操作实现。
答案:.'5. MATLAB中,使用________函数可以计算矩阵的行列式。
答案:det三、简答题1. 简述MATLAB中使用循环结构的注意事项。
答案:在MATLAB中使用循环结构时,应注意以下几点:确保循环体内部逻辑正确,避免无限循环;使用for循环时,循环变量的初始化和步长设置要合理;使用while循环时,循环条件要明确,确保循环能够正常退出。
2. 描述MATLAB中如何实现数组的多维索引。
答案:在MATLAB中,多维数组的索引可以通过使用圆括号来实现,每个维度的索引用逗号分隔。
例如,对于一个三维数组A,可以使用A(i,j,k)来访问第i行、第j列、第k层的元素。
matlab课后习题答案(附图)

matlab课后习题答案(附图)习题2.1画出下列常见曲线的图形y (1)⽴⽅抛物线3x命令:syms x y;ezplot('x.^(1/3)')(2)⾼斯曲线y=e^(-X^2);命令:clearsyms x y;ezplot('exp(-x*x)')(3)笛卡尔曲线命令:>> clear>> syms x y;>> a=1;>> ezplot(x^3+y^3-3*a*x*y)(4)蔓叶线命令:>> clear>> syms x y;>> a=1ezplot(y^2-(x^3)/(a-x))(5)摆线:()()tsin-=,=-by1命令:>> clear>> t=0:0.1:2*pi;>> x=t-sin(t);>>y=2*(1-cos(t)); >> plot(x,y)7螺旋线命令:>> clear >> t=0:0.1:2*pi; >> x=cos(t); >> y=sin(t); >> z=t;>>plot3(x,y,z)(8)阿基⽶德螺线命令:clear>> theta=0:0.1:2*pi;>> rho1=(theta);>> subplot(1,2,1),polar(theta,rho1)(9) 对数螺线命令:cleartheta=0:0.1:2*pi;rho1=exp(theta);subplot(1,2,1),polar(theta,rho1)(12)⼼形线命令:>> clear >> theta=0:0.1:2*pi; >> rho1=1+cos(theta); >> subplot(1,2,1),polar(theta,rho1)练习2.21. 求出下列极限值(1)nnn n3→命令:>>syms n>>limit((n^3+3^n)^(1/n)) ans = 3(2))121(lim n n n n ++-+∞→命令:>>syms n>>limit((n+2)^(1/2)-2*(n+1)^(1/2)+n^(1/2),n,inf) ans = 0(3)x x x 2cot lim 0→命令:syms x ;>> limit(x*cot(2*x),x,0) ans = 1/2 (4))(coslimcm xx ∞→命令:syms x m ; limit((cos(m/x))^x,x,inf) ans = 1(5))111(lim 1--→exx x命令:syms x>> limit(1/x-1/(exp(x)-1),x,1) ans =(exp(1)-2)/(exp(1)-1) (6))(2lim x x xx -+∞>> limit((x^2+x)^(1/2)-x,x,inf)ans = 1/2练习2.41. 求下列不定积分,并⽤diff 验证:(1)+x dxcos 1>>Clear >> syms x y >> y=1/(1+cos(x)); >> f=int(y,x) f =tan(1/2*x) >> y=tan(1/2*x); >> yx=diff(y ,x); >> y1=simple(yx) y1 =1/2+1/2*tan(1/2*x)^2 (2)+exdx1clear syms x yy=1/(1+exp(x));f=int(y,x) f =-log(1+exp(x))+log(exp(x)) syms x yy=-log(1+exp(x))+log(exp(x)); yx=diff(y,x); y1=simple(yx) y1 = 1/(1+exp(x)) (3)dx x x ?sin 2syms x yy=x*sin(x)^2; >> f=int(y,x) f =x*(-1/2*cos(x)*sin(x)+1/2*x)-1/4*cos(x)^2-1/4*x^2 clearsyms x y y=x*(-1/2*cos(x)*sin(x)+1/2*x)-1/4*cos(x)^2-1/4*x^2; yx=diff(y,x); >> y1=simple(yx) y1 = x*sin(x)^2 (4)xdx ?sec3syms x y y=sec(x)^3;f=int(y,x) f =1/2/cos(x)^2*sin(x)+1/2*log(sec(x)+tan(x)) clear syms x yy=1/2/cos(x)^2*sin(x)+1/2*log(sec(x)+tan(x)); yx=diff(y,x); y1=simple(yx) y1 =1/cos(x)^32. 求下列积分的数值解 1)dx x-10clearsyms xy=int(x^(-x),x,0,1) y =int(x^(-x),x = 0 .. 1) vpa(y,10) ans =1.291285997 2)xdx e x cos3202?πclearsyms xy=int(exp(2*x)*cos(x)^3,x, clear syms xy=int((1/(2*pi)^(1/2))*exp(-x^2/2),x,0,1) y =7186705221432913/36028797018963968*erf(1/2*2^(1/2))*2^(1/2)*pi^(1/0,2*pi) y =22/65*exp(pi)^4-22/65vpa(ans,10)(3)dx xe21221-π>> clear >> syms x>> y=int(1/(2*pi)^(1/2)*exp(-x^2/2),0,1); >> vpa(y,14) ans =.341344746068552(4)>> clear >> syms x>> y=int(x*log(x^4)*asin(1/x^2),1,3); Warning: Explicit integral could not be found. > In sym.int at 58 >> vpa(y,14) ans = 2.45977212823752(5) >> clear >> syms x1判断下列级数的收敛性,若收敛,求出其收敛值。
MATLAB)课后实验答案
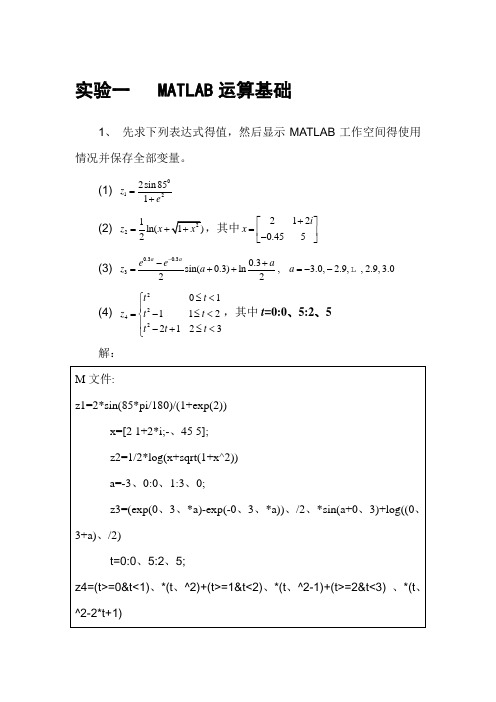
实验一 MATLAB 运算基础1、 先求下列表达式得值,然后显示MATLAB 工作空间得使用情况并保存全部变量。
(1) 0122sin 851z e =+(2) 21ln(2z x =+,其中2120.455i x +⎡⎤=⎢⎥-⎣⎦ (3) 0.30.330.3sin(0.3)ln , 3.0, 2.9,,2.9,3.022a a e e a z a a --+=++=--L (4) 2242011122123t t z t t t t t ⎧≤<⎪=-≤<⎨⎪-+≤<⎩,其中t =0:0、5:2、5 解:4、 完成下列操作:(1) 求[100,999]之间能被21整除得数得个数。
(2) 建立一个字符串向量,删除其中得大写字母。
解:(1) 结果:(2)、 建立一个字符串向量 例如:ch='ABC123d4e56Fg9';则要求结果就是:实验二 MATLAB 矩阵分析与处理1、 设有分块矩阵33322322E R A O S ⨯⨯⨯⨯⎡⎤=⎢⎥⎣⎦,其中E 、R 、O 、S 分别为单位矩阵、随机矩阵、零矩阵与对角阵,试通过数值计算验证22E R RS A OS +⎡⎤=⎢⎥⎣⎦。
解: M 文件如下;5、 下面就是一个线性方程组:1231112340.951110.673450.52111456x x x ⎡⎤⎢⎥⎡⎤⎡⎤⎢⎥⎢⎥⎢⎥⎢⎥=⎢⎥⎢⎥⎢⎥⎢⎥⎢⎥⎢⎥⎣⎦⎣⎦⎢⎥⎢⎥⎣⎦(1) 求方程得解。
(2) 将方程右边向量元素b 3改为0、53再求解,并比较b 3得变化与解得相对变化。
(3) 计算系数矩阵A 得条件数并分析结论。
解: M 文件如下:实验三 选择结构程序设计1、 求分段函数得值。
2226035605231x x x x y x x x x x x x ⎧+-<≠-⎪=-+≤<≠≠⎨⎪--⎩且且及其他用if 语句实现,分别输出x=-5、0,-3、0,1、0,2、0,2、5,3、0,5、0时得y 值。
matlab试题及答案

matlab试题及答案# MATLAB试题及答案一、选择题1. MATLAB的基本数据单位是:A. 矩阵B. 向量C. 标量D. 数组答案:A2. 下列哪个命令可以用来绘制函数图形?A. `plot`B. `graph`C. `draw`D. `chart`答案:A3. MATLAB中,以下哪个是正确的矩阵转置操作?A. `transpose(A)`B. `A'`C. `A^T`D. `flip(A)`答案:B二、简答题1. 简述MATLAB中矩阵的基本操作。
答案:在MATLAB中,矩阵是最基本的数据结构,可以进行加、减、乘、除等基本运算。
矩阵的创建可以使用方括号`[]`,例如`A = [1 2;3 4]`。
矩阵的转置使用单引号`'`,例如`A'`。
矩阵的求逆使用`inv`函数,例如`inv(A)`。
2. MATLAB中如何实现循环结构?答案:MATLAB中实现循环结构主要有两种方式:`for`循环和`while`循环。
`for`循环用于已知迭代次数的情况,例如:```matlabfor i = 1:5disp(i);end````while`循环用于迭代次数未知的情况,例如:```matlabi = 1;while i <= 5disp(i);i = i + 1;end```三、计算题1. 给定矩阵A和B,请计算它们的乘积C,并求C的行列式。
A = [1 2; 3 4]B = [5 6; 7 8]答案:首先计算矩阵乘积C:```matlabC = A * B;```然后计算C的行列式:```matlabdetC = det(C);```结果为:```matlabC = [19 22; 43 50]detC = -16```2. 编写一个MATLAB函数,计算并返回一个向量的范数。
答案:```matlabfunction norm_value = vector_norm(v)norm_value = norm(v);end```四、编程题1. 编写一个MATLAB脚本,实现以下功能:- 随机生成一个3x3的矩阵。
MATLAB习题及参考答案
习题:1, 计算⎥⎦⎤⎢⎣⎡=572396a 与⎥⎦⎤⎢⎣⎡=864142b 的数组乘积。
2, 对于B AX =,如果⎥⎥⎥⎦⎤⎢⎢⎢⎣⎡=753467294A ,⎥⎥⎥⎦⎤⎢⎢⎢⎣⎡=282637B ,求解X 。
3, 已知:⎥⎥⎥⎦⎤⎢⎢⎢⎣⎡=987654321a ,分别计算a 的数组平方和矩阵平方,并观察其结果。
4, 角度[]604530=x ,求x 的正弦、余弦、正切和余切。
(应用sin,cos,tan.cot)5, 将矩阵⎥⎦⎤⎢⎣⎡=7524a 、⎥⎦⎤⎢⎣⎡=3817b 和⎥⎦⎤⎢⎣⎡=2695c 组合成两个新矩阵: (1)组合成一个4⨯3的矩阵,第一列为按列顺序排列的a 矩阵元素,第二列为按列顺序排列的b 矩阵元素,第三列为按列顺序排列的c 矩阵元素,即 ⎥⎥⎥⎥⎦⎤⎢⎢⎢⎢⎣⎡237912685574(2)按照a 、b 、c 的列顺序组合成一个行矢量,即 []2965318772546, 将(x -6)(x -3)(x -8)展开为系数多项式的形式。
(应用poly,polyvalm)7, 求解多项式x 3-7x 2+2x +40的根。
(应用roots)8, 求解在x =8时多项式(x -1)(x -2) (x -3)(x -4)的值。
(应用poly,polyvalm)9, 计算多项式9514124234++--x x x x 的微分和积分。
(应用polyder,polyint ,poly2sym)10, 解方程组⎥⎥⎥⎦⎤⎢⎢⎢⎣⎡=⎥⎥⎥⎦⎤⎢⎢⎢⎣⎡66136221143092x 。
(应用x=a\b)11, 求欠定方程组⎥⎦⎤⎢⎣⎡=⎥⎦⎤⎢⎣⎡5865394742x 的最小范数解。
(应用pinv)12, 矩阵⎥⎥⎥⎦⎤⎢⎢⎢⎣⎡-=943457624a ,计算a 的行列式和逆矩阵。
(应用det,inv)13, y =sin(x ),x 从0到2π,∆x =0.02π,求y 的最大值、最小值、均值和标准差。
matlab期末考试题目及答案
matlab期末考试题目及答案1. 题目:编写一个MATLAB函数,实现矩阵的转置操作。
答案:可以使用`transpose`函数或`.'`操作符来实现矩阵的转置。
例如,对于一个矩阵`A`,其转置可以通过`A'`或`transpose(A)`来获得。
2. 题目:使用MATLAB求解线性方程组Ax=b,其中A是一个3x3的矩阵,b是一个3x1的向量。
答案:可以使用MATLAB内置的`\`操作符来求解线性方程组。
例如,如果`A`和`b`已经定义,求解方程组的代码为`x = A\b`。
3. 题目:编写MATLAB代码,计算并绘制函数f(x) = sin(x)在区间[0, 2π]上的图像。
答案:首先定义x的范围,然后计算对应的函数值,并使用`plot`函数绘制图像。
代码示例如下:```matlabx = linspace(0, 2*pi, 100); % 定义x的范围y = sin(x); % 计算函数值plot(x, y); % 绘制图像xlabel('x'); % x轴标签ylabel('sin(x)'); % y轴标签title('Plot of sin(x)'); % 图像标题```4. 题目:使用MATLAB编写一个脚本,实现对一个给定的二维数组进行排序,并输出排序后的结果。
答案:可以使用`sort`函数对数组进行排序。
如果需要对整个数组进行排序,可以使用`sort`函数的两个输出参数来获取排序后的索引和值。
代码示例如下:```matlabA = [3, 1, 4; 1, 5, 9; 2, 6, 5]; % 给定的二维数组[sortedValues, sortedIndices] = sort(A(:)); % 对数组进行排序sortedMatrix = reshape(sortedValues, size(A)); % 将排序后的值重新构造成矩阵disp(sortedMatrix); % 显示排序后的结果```5. 题目:编写MATLAB代码,实现对一个字符串进行加密,加密规则为将每个字符的ASCII码值增加3。
matlab期末考试题及答案
matlab期末考试题及答案MATLAB期末考试题及答案一、选择题(每题2分,共20分)1. MATLAB中用于创建向量的函数是:A. vectorB. arrayC. linspaceD. ones答案:D2. 下列哪个命令可以计算矩阵的行列式?A. detB. diagC. traceD. rank答案:A3. 在MATLAB中,以下哪个选项是用于绘制三维图形的?A. plotB. plot3C. barD. scatter答案:B4. MATLAB中,用于计算向量范数的函数是:A. normB. meanC. medianD. std答案:A5. 下列哪个命令可以用于创建一个二维数组?A. array2dB. matrixC. create2dD. make2d答案:B6. MATLAB中,用于求解线性方程组的函数是:A. solveB. linsolveC. equationD. linprog答案:A7. 以下哪个函数可以用于生成随机数?A. randB. randomC. randnD. randi答案:A8. MATLAB中,用于实现循环结构的关键字是:A. loopB. forC. whileD. repeat答案:B9. 下列哪个命令可以用于绘制函数图形?A. plotB. graphC. drawD. functionplot答案:A10. MATLAB中,用于计算矩阵特征值的函数是:A. eigB. eigenvalueC. characteristicD. eigen答案:A二、简答题(每题5分,共30分)1. 简述MATLAB中矩阵的基本操作有哪些?答案:矩阵的基本操作包括矩阵的创建、矩阵的加法、减法、乘法、转置、求逆、求行列式等。
2. MATLAB中如何实现条件语句?答案:MATLAB中实现条件语句主要使用if-else结构,也可以使用switch-case结构。
3. 请解释MATLAB中的函数定义方式。
Matlab习题答案
参考答案: (1) >> (3-5*i)*(4+2*i) ans =
22.0000 -14.0000i
(2) >> sin(2-8*i) ans =
1.3553e+003 +6.2026e+002i
5.判断下面语句的运算结果。 (1) 4 < 20 (2) 4 <= 20 (3) 4 == 20 (4) 4 ~= 20 (5) 'b'<'B' 参考答案: (1) >> 4<20 ans =
y_nearest(i)=interp1(x,y,scalar_x(i),'nearest'); y_linear(i) =interp1(x,y,scalar_x(i),'linear'); y_spline(i) =interp1(x,y,scalar_x(i),'spline'); y_cubic(i) =interp1(x,y,scalar_x(i),'cubic'); end subplot(2,2,1),plot(x,y,'*'),hold on,plot(scalar_x,y_nearest),title('method=nearest'); subplot(2,2,2),plot(x,y,'*'),hold on,plot(scalar_x,y_linear),title('method=linear'); subplot(2,2,3),plot(x,y,'*'),hold on,plot(scalar_x,y_spline),title('method=spline'); subplot(2,2,4),plot(x,y,'*'),hold on,plot(scalar_x,y_cubic),title('method=cubic'); 得到结果为:
matlab教材习题答案
matlab教材习题答案Matlab是一种广泛应用于科学与工程领域的计算机编程语言和环境。
它具备强大的数值计算和数据可视化功能,被广泛用于数据分析、信号处理、图像处理、机器学习等领域。
对于初学者而言,掌握Matlab的基本语法和常用函数是非常重要的,而教材习题则是帮助学生巩固所学知识的重要资源。
本文将为大家提供一些Matlab教材习题的参考答案,以帮助读者更好地学习和应用Matlab。
1. 基本语法练习题1.1 计算并输出1到10的平方for i = 1:10fprintf('%d的平方是:%d\n', i, i^2);end1.2 计算并输出1到10的阶乘for i = 1:10fact = 1;for j = 1:ifact = fact * j;endfprintf('%d的阶乘是:%d\n', i, fact);end2. 数值计算练习题2.1 求解一元二次方程的根a = 1;b = -3;c = 2;delta = b^2 - 4*a*c;x1 = (-b + sqrt(delta))/(2*a);x2 = (-b - sqrt(delta))/(2*a);fprintf('一元二次方程的根为:%f, %f\n', x1, x2);2.2 求解线性方程组的解A = [1 2; 3 4];B = [5; 6];X = inv(A) * B;fprintf('线性方程组的解为:%f, %f\n', X(1), X(2));3. 数据处理练习题3.1 统计一个数组中的最大值、最小值和平均值data = [1, 2, 3, 4, 5];max_value = max(data);min_value = min(data);average_value = mean(data);fprintf('最大值:%f\n最小值:%f\n平均值:%f\n', max_value, min_value, average_value);3.2 对一个矩阵进行排序matrix = [4 2 3; 1 5 6; 9 8 7];sorted_matrix = sort(matrix);fprintf('排序后的矩阵为:\n');disp(sorted_matrix);4. 图像处理练习题4.1 读取并显示一张图片image = imread('image.jpg');imshow(image);4.2 对一张图片进行灰度化处理gray_image = rgb2gray(image);imshow(gray_image);5. 信号处理练习题5.1 生成并绘制正弦信号t = 0:0.01:2*pi;x = sin(t);plot(t, x);5.2 对一段音频信号进行傅里叶变换[y, fs] = audioread('audio.wav');Y = fft(y);plot(abs(Y));通过以上几个例子,我们可以看到Matlab的强大功能和灵活性。
- 1、下载文档前请自行甄别文档内容的完整性,平台不提供额外的编辑、内容补充、找答案等附加服务。
- 2、"仅部分预览"的文档,不可在线预览部分如存在完整性等问题,可反馈申请退款(可完整预览的文档不适用该条件!)。
- 3、如文档侵犯您的权益,请联系客服反馈,我们会尽快为您处理(人工客服工作时间:9:00-18:30)。
第五章
1.绘制下列曲线。
(1)2
1100
x
y += (2)22
21x e y -=π (3)12
2
=+y x (4)⎩
⎨⎧==3
2
5t y t x 答:
(1) x=-10:0.1:10; y=100./(1+x.^2); plot(x,y)
(2) x=-10:0.1:10;
y=1/(2*pi)*exp(-x.^2/2); plot(x,y)
(3) ezplot('x^2+y^2=1')
(4)
t=-10:0.1:10; x=t.^2; y=5*t.^3;
plot(x,y)
2. 绘制下列三维图形。
(1)⎪⎩
⎪
⎨⎧===t z t y t x sin cos
(2)⎪⎩
⎪
⎨⎧=+=+=u z v u y v u x sin sin )cos 1(cos )cos 1(
(3)5=z
(4)半径为10的球面(提示:用sphere 函数
答: (1)
t=0:pi/100:2*pi; x=cos(t); y=sin(t); z=t;
plot3(x,y,z)
(2)
u=0:pi/100:2*pi;
v=0:pi/100:2*pi;
x=(1+cos(u)).*cos(v);
y=(1+cos(u)).*sin(v);
z=sin(u);
plot3(x,y,z)
(3)
[x,y]=meshgrid(-100:100); z=5*ones(size(x));
mesh(x,y,z)
(4)
[x,y,z] = sphere; %等价于sphere(20) 20是画出来的球面的经纬分面数...20的话就是20个经度, 20个纬度,或者说“就是划出20╳20面的单位球体,把球的表面分成400个小网格”
surf(x,y,z); %绘制单位球面 x = 10*x; y = 10*y; z = 10*z;
surf(x,y,z); %绘制半径为10的球面 axis equal
3.在同一图形窗口中采用子图形式分别绘制正方形、圆、三角形和六边形。
答:
n=[3 4 6 2^10] for i=1:4
subplot(2,2,i)
theta=linspace(pi/n(i),2*pi+pi/n(i),n(i)+1); plot(cos(theta),sin(theta)); axis equal; end
4. 分别用plot 和fplot 绘制下列分段函数的曲线。
⎪⎩⎪⎨⎧<--+=>+++=0,510,00,51)(342x x x x x x x x f
答:
plot 函数: 方法一:
x=linspace(-10,10,200); y=[]; for x0=x if x0>0
y=[y,x0.^2+(1+x0).^(1/4)+5]; elseif x0==0 y=[y,0]; elseif x0<0
y=[y,x0.^3+sqrt(1-x0)-5]; end end
plot(x,y)
方法二:
x=linspace(-10,10,200);
y=(x<0).*(x.^3+sqrt(1-x)-5)+(x==0).*0+(x>0).*(x.^2+(1+x).^(1/4)+5);
plot(x,y)
用fplot函数:
fplot('(x<0).*(x.^3+sqrt(1-x)-5)+(x==0).*0+(x>0).*(x.^2+(1+x).^(1/4)+5)',[-10,10])
5. 在同一坐标轴中绘制下列两条曲线并标注两曲线的交叉点。
(1)5.02-=x y
(2)⎪⎩
⎪
⎨
⎧=≤≤=t t y t t t x sin )3sin(0cos )3sin(π 答: 相邻两点x1、x2 曲线(1)相应的y 值为y11、y12, 曲线(2)y 相应的y 值y21、y22, 若(y11-y21)与(y12-y22)符号相反或等于0,则x1或x2就是一个交叉点。
方法一:
t=linspace(0,pi,300); x=sin(3*t).*cos(t); y1=2*x-0.5;
y2=sin(3*t).*sin(t); len=length(t); p=y1-y2;
x3=x((find(p(1:len-1).*p(2:len)<=0))); y3=2*x3-0.5;
plot(x,y1,x,y2,x3,y3,'rd')
方法二:用循环 %t=0:0.01:pi;
t=linspace(0,pi,100); x=sin(3*t).*cos(t); y1=2*x-0.5;
y2=sin(3*t).*sin(t); plot(x,y1,x,y2);grid; delta_y=y1-y2;
% figure;stem(delta_y); j=1;
for i=1:length(t)-1
if delta_y(i)*delta_y(i+1)<=0 position(j)=i+1; j=j+1; end end hold on;
plot(x(position),y1(position),'ro'); title('两条曲线相交'); xlabel('x');ylabel('y'); h = legend('y1','y2');。