广东统计年鉴2015社会经济发展指标:各市普通中学情况(2014年)续表1
合集下载
广东统计年鉴2015社会经济发展指标:城镇单位工资总额(2014年)

按产业分
Grouped by Industry
第一产业
Primary Industry
第二产业
Secondary Industry
第三产业
Tertiary Industry
11471.24
9396.35 1348.25
649.77 18.81 58.06
16.36 23.17 5302.70 291.08
582.06 532.32 604.09 140.50 366.88
510.42 329.78 366.98 293.64
74.47
33.03 776.04 428.82
78.51 720.39
16.36 6199.02 5255.87
2667.14
693.77 1292.13
649.39 1.42
30.43
14.64 5.06
43.17 80.93
92.19 55.26 125.95 13.09 33.03
141.90 22.78 60.66 86.48 49.35
8.82 688.56 377.33
49.35 718.58
14.64 221.36 2431.14
221.64 8582.47
4-13 城镇单位在岗职工工资总额 (2014年)
Total Wages Bill of Fully Employed Staff and Workers in Urban Units (2014)
单位:亿元 项目
(100 million
合计
国有单位
城镇集体单 位
yuan) 其他单位
Total State-owned Urban
教育
广东统计年鉴2015社会经济发展指标:国有控股工业企业主要经济指标(2014年)
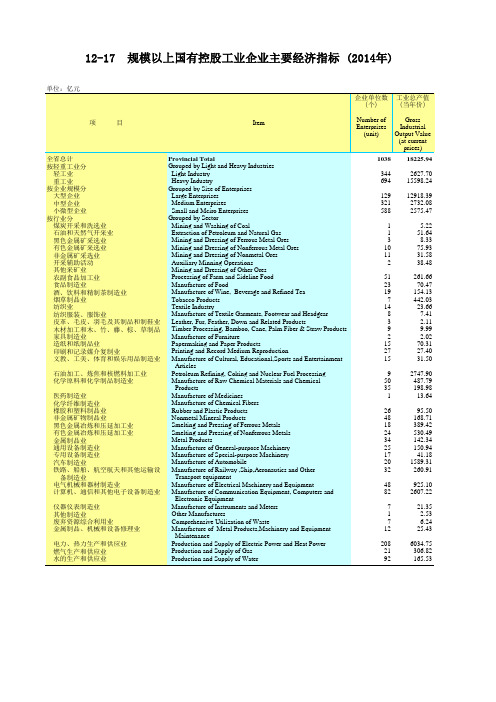
12-17 规模以上国有控股工业企业主要经济指标 (2014年)
单位:亿元
企业单位数 工业总产值
(个)
(当年价)
项
目
全省总计 按轻重工业分
轻工业 重工业 按企业规模分 大型企业 中型企业 小微型企业 按行业分 煤炭开采和洗选业 石油和天然气开采业 黑色金属矿采选业 有色金属矿采选业 非金属矿采选业 开采辅助活动 其他采矿业 农副食品加工业 食品制造业 酒、饮料和精制茶制造业 烟草制品业 纺织业 纺织服装、服饰业 皮革、毛皮、羽毛及其制品和制鞋业 木材加工和木、竹、藤、棕、草制品 家具制造业 造纸和纸制品业 印刷和记录媒介复制业 文教、工美、体育和娱乐用品制造业
Maintenance Production and Supply of Electric Power and Heat Power Production and Supply of Gas Production and Supply of Water
Number of Enterprises
(unit)
石油加工、炼焦和核燃料加工业 化学原料和化学制品制造业
医药制造业 化学纤维制造业 橡胶和塑料制品业 非金属矿物制品业 黑色金属冶炼和压延加工业 有色金属冶炼和压延加工业 金属制品业 通用设备制造业 专用设备制造业 汽车制造业 铁路、船舶、航空航天和其他运输设
备制造业 电气机械和器材制造业 计算机、通信和其他电子设备制造业
Gross Industrial Output Value (at current
prices)
1038 18225.94
344
2627.70
694 15598.24
129 12918.39
321
广东统计年鉴2015社会经济发展指标:居民消费价格分类指数(2014年)

Fresh Vegetables Dried Vegetables and Vegetable Products Flavoring Carbohydrate Sugar Candy Tea and Beverages Tea Beverages Dried and Fresh Melons and Fruits Fresh Melons and Fruits Cake, Biscuit and Bread Milk and Its Products Outward Dinner Food Other Foods Tobacco, Liquor and Articles Tobacco Liquor Clothing Garments Clothing Material Footgear and Hats
98.8 107.2 107.5 101.6 101.0 106.1 102.7
99.7 97.2 101.7 101.0 101.3 100.7 115.5 119.1 101.0 105.9 104.1 101.2 99.6 100.1 98.8 103.0 103.4 100.0 102.2
102.3 101.2 102.1 100.4 101.3 102.0 102.4 104.5 102.7 101.2 103.1 100.9 102.8
95.8 103.8
99.1 107.1 107.7 101.5 100.9 106.5 102.6
99.5 97.1 101.7 100.9 101.3 100.7 115.1 118.6 101.1 106.1 104.1 101.3 99.2 99.6 98.7 103.2 103.6 100.0 102.3
99.0 101.7 101.9 100.1 101.1
广东统计年鉴2015社会经济发展指标:城镇单位就业人员年末人数(2014年)续表1
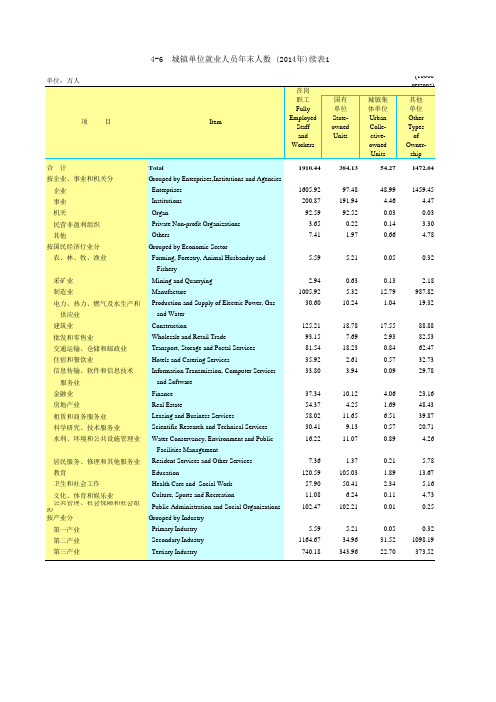
4-6 城镇单位就业人员年末人数 (2014年)续表1
单位:万人 项目
在岗
职工
Fully
Item
Employed
Staff
and
Workers
合计 按企业、事业和机关分
企业 事业 机关 民营非盈利组织 其他 按国民经济行业分 农、林、牧、渔业
采矿业 制造业 电力、热力、燃气及水生产和
供应业 建筑业 批发和零售业 交通运输、仓储和邮政业 住宿和餐饮业 信息传输、软件和信息技术
740.18
国有 单位 Stateowned Units
384.13
97.48 191.94
92.52 0.22 1.97
5.21
0.63 5.32 10.24
18.78 7.69
18.23 2.61 3.94
10.12 4.25
11.65 9.13
11.07
1.37 105.03
50.41 6.24
Enterprises Institutions Organ Private Non-profit Organizations Others Grouped by Economic Sector Farming, Forestry, Animal Husbandry and
Fishery Mining and Quarrying Manufacture Production and Supply of Electric Power, Gas
and Water Construction Wholesale and Retail Trade Transport, Storage and Postal Services Hotels and Catering Services Information Transmission, Computer Services
广东统计年鉴2015社会经济发展指标:教育科技主要指标
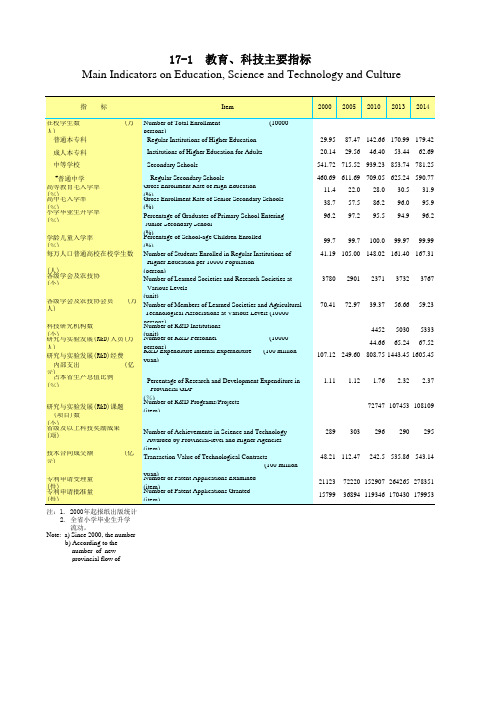
17-1 教育、科技主要指标 Main Indicators on Education, Science and Technology and Culture
指标
Item
在校学生数 人)
普通本专科
(万 Number of Total Enrollment persons) Regular Institutions of Higher Education
(N%um) ber of R&D Programs/Projects (item)
Number of Achievements in Science and Technology Awarded by Provincial-level and Higher Agencies
(item) Transaction Value of Technological Contracts
(100 million yNuuamn)ber of Patent Applications Examined (Nituemmb)er of Patent Applications Granted (item)
注:1. 2000年起报纸出版统计 2. 全省小学毕业生升学 流动。
Note: a) Since 2000, the number b) According to the number of new provincial flow of
(P%er)centage of School-age Children Enrolled
(%)
Number of Students Enrolled in Regular Institution per 10000 Population
(person)
广东统计年鉴2015社会经济发展指标:出口主要商品数量金额续表1
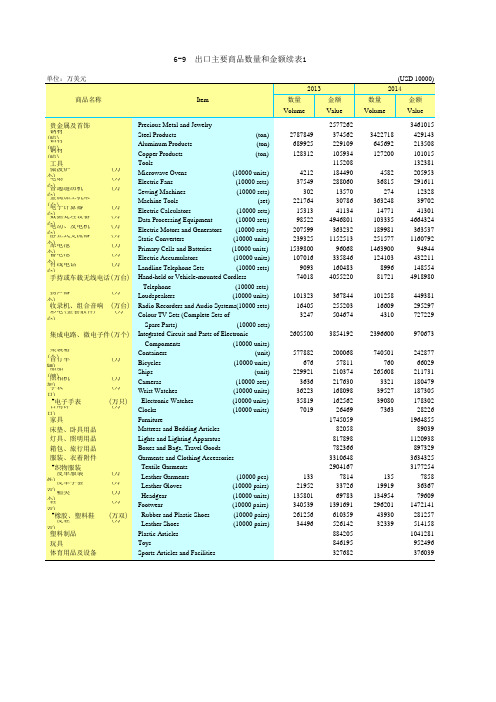
4664324 363537
1160792 94944
432211 148554 4918980
101323 16405 3247
367844 255203 504674
101258 16609 4310
449381 295297 727229
2605500 3854192 2396600
970673
Compoments
(10000 units)
Containers
(unit)
Bicycles
(10000 units)
Ships
(unit)
Cameras
(10000 sets)
Wrist Watches
(10000 units)
Electronic Watches
(10000 units)
Clocks
Leather Garments
(10000 pcs)
Leather Gloves
(10000 pairs)
Headgear
(10000 units)
Footwear
(10000 pairs)
Rubber and Plastic Shoes
(10000 pairs)
Leather Shoes
(10000 pairs)
577882 676
229921 3636
36223 35819
7019
133 21952 135801 340539 261256 34496
200068 57811
210374 217630 168098 162562
26469 1745059
82058 817898 782366 3310648 2904167
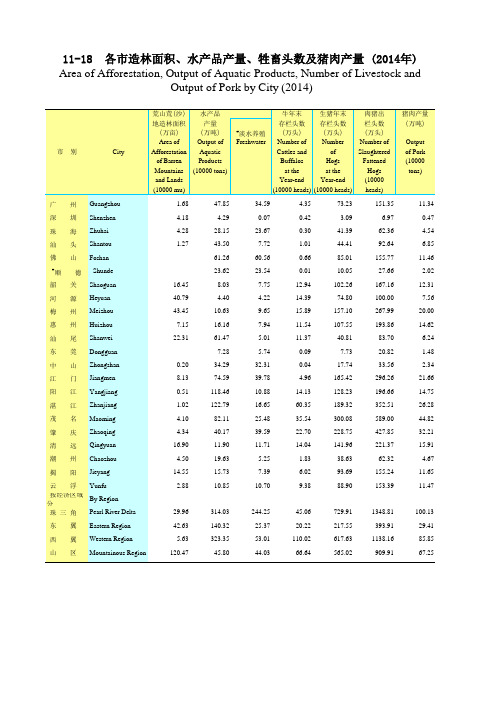
广东统计年鉴2015社会经济发展指标:各市造林面积水产品产量牲畜头数及猪肉产量(2014年)
(10000 heads) (10000 heads) heads)
广 州 Guangzhou
1.68
47.85
34.59
4.35
73.23
151.35
11.34
深 圳 Shenzhen
4.18
4.29Βιβλιοθήκη 0.070.423.09
6.97
0.47
珠 海 Zhuhai 汕 头 Shantou
4.28
28.15
of
Slaughtered of Pork
of Barren Products
Buffalos
Hogs
Fattened
(10000
Mountains (10000 tons)
at the
at the
Hogs
tons)
and Lands
Year-end Year-end
(10000
(10000 mu)
244.25
6.02
93.69
155.24
11.65
9.38
88.90
153.39
11.47
45.06
729.91
1348.81
100.13
东 翼 Eastern Region
42.63
140.32
25.37
20.22
217.55
393.91
29.41
西 翼 Western Region 山 区 Mountainous Region
0.66 0.01 12.94 14.39
85.01 10.05 102.26 74.80
155.77 27.66
167.16 100.00
广东统计年鉴2015社会经济发展指标:各县(市)区人均地区生产总值及增长速度续表1
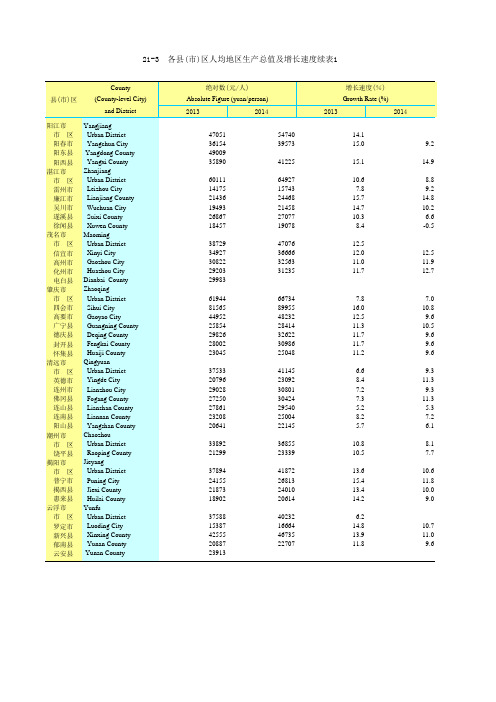
37533 20796 29028 27250 27861 23208 20641
33892 21299
37894 24155 21873 18902
37588 15387 42555 20887 23913
54740 39573
41225
64927 15743 24468 21458 27077 19078
增长速度(%)
Growth Rate (%)
2013
2014
14.1
15.0
9.2
15.1
14.9
10.6
8.8
7.8
9.2
15.7
14.8
14.7
10.2
10.3
6.6
8.4
-0.5
12.5
12.0
12.5
11.0
11.9
11.712.7787.016.0
10.8
12.5
9.6
11.3
10.5
11.7
绝对数(元/人)
Absolute Figure (yuan/person)
2013
2014
47051 36154 49009 35890
60111 14175 21436 19493 26867 18457
38729 34927 30822 29203 29983
61944 81565 44952 25854 29826 28002 23045
9.6
11.7
9.6
11.2
9.6
6.6
9.3
8.4
11.3
7.2
9.3
7.3
11.3
5.2
5.3
8.2