data mining 练习题
数据挖掘思考和练习题汇总

数据挖掘思考和练习题第一章1.1 什么是数据挖掘?什么是知识发现?简述KDD的主要过程。
答:(1)数据挖掘(Data Mining)是指从大量结构化和非结构化的数据中提取有用的信息和知识的过程,它是知识发现的有效手段。
(2)知识发现是从大量数据中提取有效的、新颖的、潜在的有用的,以及最终可理解的模式的非平凡过程。
(3)KDD的过程主要包括:KDD的过程主要由数据整理、数据挖掘、结果的解释评论三部分组成。
可以由模型表示出来:1.确定挖掘目标:了解应用领域及相关的经验知识,从用户的观点出发确定数据挖掘的目标。
这一步是实现数据挖掘的重要因素,相当于系统分析,需要系统分析员和用户的共同参与。
2.建立目标数据集:从现有的数据中,确定哪些数据是与本次数据分析任务相关的。
根据挖掘目标,从原始数据中选择相关数据集,并将不同数据源中的数据集中起来。
在这一阶段需要解决数据挖掘平台、操作系统和数据源数据类型等不同所产生的数据格式差异。
3.数据清洗和预处理:这一阶段即是将数据转变成“干净”的数据。
目标数据集中不可避免地存在着不完整、不一致、不精确和冗余地数据。
数据抽取之后必须利用专业领域地知识对“脏数据”进行清洗。
然后再对它们实施相应的方法,神经网络方法和模糊匹配技术分析多数据源之间联系,然后再对它们实施相应的处理。
4.数据降维和转换:在对数据库和数据子集进行预处理之后,考虑了数据的不变表示或发现了数据的不变的表示情况下,减少变量的实际数目,设法将数据转换到一个更易找到了解的空间上。
5.选择挖掘算法使用合适的数据挖掘算法完成数据分析。
确定实现挖掘目标的数据挖掘功能,这些功能方法包括概念描述、分类、聚类、关联规则。
其次选择合适的模式搜索算法,包括模型和参数的确定。
6.模式评价和解释根据最终用户的决策目的对数据挖掘发现的模式进行评价,将有用的模式或描述有用模式的数据以可视化技术和知识表示技术展示给用户,让用户能够对模型结果作出解释,评价模式的有效性。
数据挖掘考试题库
一、填空题1.Web挖掘可分为、和3大类。
2.数据仓库需要统一数据源,包括统一、统一、统一和统一数据特征4个方面。
3.数据分割通常按时间、、、以及组合方法进行。
4.噪声数据处理的方法主要有、和。
5.数值归约的常用方法有、、、和对数模型等。
6.评价关联规则的2个主要指标是和。
7.多维数据集通常采用或雪花型架构,以表为中心,连接多个表。
8.决策树是用作为结点,用作为分支的树结构。
9.关联可分为简单关联、和。
10.B P神经网络的作用函数通常为区间的。
11.数据挖掘的过程主要包括确定业务对象、、、及知识同化等几个步骤。
12.数据挖掘技术主要涉及、和3个技术领域。
13.数据挖掘的主要功能包括、、、、趋势分析、孤立点分析和偏差分析7个方面。
14.人工神经网络具有和等特点,其结构模型包括、和自组织网络3种。
15.数据仓库数据的4个基本特征是、、非易失、随时间变化。
16.数据仓库的数据通常划分为、、和等几个级别。
17.数据预处理的主要内容(方法)包括、、和数据归约等。
18.平滑分箱数据的方法主要有、和。
19.数据挖掘发现知识的类型主要有广义知识、、、和偏差型知识五种。
20.O LAP的数据组织方式主要有和两种。
21.常见的OLAP多维数据分析包括、、和旋转等操作。
22.传统的决策支持系统是以和驱动,而新决策支持系统则是以、建立在和技术之上。
23.O LAP的数据组织方式主要有和2种。
24.S QL Server2000的OLAP组件叫,OLAP操作窗口叫。
25.B P神经网络由、以及一或多个结点组成。
26.遗传算法包括、、3个基本算子。
27.聚类分析的数据通常可分为区间标度变量、、、、序数型以及混合类型等。
28.聚类分析中最常用的距离计算公式有、、等。
29.基于划分的聚类算法有和。
30.C lementine的工作流通常由、和等节点连接而成。
31.简单地说,数据挖掘就是从中挖掘的过程。
32.数据挖掘相关的名称还有、、等。
数据挖掘试题参考答案
大学课程《数据挖掘》试题参考答案范围:∙ 1.什么是数据挖掘?它与传统数据分析有什么区别?定义:数据挖掘(Data Mining,DM)又称数据库中的知识发现(Knowledge Discover in Database,KDD),是目前人工智能和数据库领域研究的热点问题,所谓数据挖掘是指从数据库的大量数据中揭示出隐含的、先前未知的并有潜在价值的信息的非平凡过程。
数据挖掘是一种决策支持过程,它主要基于人工智能、机器学习、模式识别、统计学、数据库、可视化技术等,高度自动化地分析企业的数据,做出归纳性的推理,从中挖掘出潜在的模式,帮助决策者调整市场策略,减少风险,做出正确的决策。
区别:(1)数据挖掘的数据源与以前相比有了显著的改变;数据是海量的;数据有噪声;数据可能是非结构化的;(2)传统的数据分析方法一般都是先给出一个假设然后通过数据验证,在一定意义上是假设驱动的;与之相反,数据挖掘在一定意义上是发现驱动的,模式都是通过大量的搜索工作从数据中自动提取出来。
即数据挖掘是要发现那些不能靠直觉发现的信息或知识,甚至是违背直觉的信息或知识,挖掘出的信息越是出乎意料,就可能越有价值。
在缺乏强有力的数据分析工具而不能分析这些资源的情况下,历史数据库也就变成了“数据坟墓”-里面的数据几乎不再被访问。
也就是说,极有价值的信息被“淹没”在海量数据堆中,领导者决策时还只能凭自己的经验和直觉。
因此改进原有的数据分析方法,使之能够智能地处理海量数据,即演化为数据挖掘。
∙ 2.请根据CRISP-DM(Cross Industry Standard Process for Data Mining)模型,描述数据挖掘包含哪些步骤?CRISP-DM 模型为一个KDD工程提供了一个完整的过程描述.该模型将一个KDD工程分为6个不同的,但顺序并非完全不变的阶段.1: business understanding: 即商业理解. 在第一个阶段我们必须从商业的角度上面了解项目的要求和最终目的是什么. 并将这些目的与数据挖掘的定义以及结果结合起来.2.data understanding: 数据的理解以及收集,对可用的数据进行评估.3: data preparation: 数据的准备,对可用的原始数据进行一系列的组织以及清洗,使之达到建模需求.4:modeling: 即应用数据挖掘工具建立模型.5:evaluation: 对建立的模型进行评估,重点具体考虑得出的结果是否符合第一步的商业目的.6: deployment: 部署,即将其发现的结果以及过程组织成为可读文本形式.(数据挖掘报告)∙ 3.请描述未来多媒体挖掘的趋势随着多媒体技术的发展,人们接触的数据形式不断地丰富,多媒体数据库的日益增多,原有的数据库技术已满足不了应用的需要,人们希望从这些媒体数据中得到一些高层的概念和模式,找出蕴涵于其中的有价值的知识。
数据挖掘与数据分析,数据可视化试题
数据挖掘与数据分析,数据可视化试题1. Data Mining is also referred to as ……………………..data analysisdata discovery(正确答案)data recoveryData visualization2. Data Mining is a method and technique inclusive of …………………………. data analysis.(正确答案)data discoveryData visualizationdata recovery3. In which step of Data Science consume Almost 80% of the work period of the procedure.Accumulating the dataAnalyzing the dataWrangling the data(正确答案)Recapitulation of the Data4. Which Step of Data Science allows the model to consistently improve and provide punctual performance and deliverapproximate results.Wrangling the dataAccumulating the dataRecapitulation of the Data(正确答案)Analyzing the data5. Which tool of Data Science is robust machine learning library, which allows the implementation of deep learning ?algorithms. STableauD3.jsApache SparkTensorFlow(正确答案)6. What is the main aim of Data Mining ?to obtain data from a less number of sources and to transform it into a more useful version of itself.to obtain data from a less number of sources and to transform it into a less useful version of itself.to obtain data from a great number of sources and to transform it into a less useful version of itself.to obtain data from a great number of sources and to transform it into a more useful version of itself.(正确答案)7. In which step of data mining the irrelevant patterns are eliminated to avoid cluttering ? Cleaning the data(正确答案)Evaluating the dataConversion of the dataIntegration of data8. Data Science t is mainly used for ………………. purposes. Data mining is mainly used for ……………………. purposes.scientific,business(正确答案)business,scientificscientific,scientificNone9. Pandas ………………... is a one dimensional labeled array capable of holding data of any type (integer, string, float, python objects, etc.).Series(正确答案)FramePanelNone10. How many principal components Pandas DataFrame consists of ?4213(正确答案)11. Important data structure of pandas is/are ___________SeriesData FrameBoth(正确答案)None of the above12. Which of the following command is used to install pandas?pip install pandas(正确答案)install pandaspip pandasNone of the above13. Which of the following function/method help to create Series? series()Series()(正确答案)createSeries()None of the above14. NumPY stands for?Numbering PythonNumber In PythonNumerical Python(正确答案)None Of the above15. Which of the following is not correct sub-packages of SciPy? scipy.integratescipy.source(正确答案)scipy.interpolatescipy.signal16. How to import Constants Package in SciPy?import scipy.constantsfrom scipy.constants(正确答案)import scipy.constants.packagefrom scipy.constants.package17. ………………….. involveslooking at and describing the data set from different angles and then summarizing it ?Data FrameData VisualizationEDA(正确答案)All of the above18. what involves the preparation of data sets for analysis by removing irregularities in the data so that these irregularities do not affect further steps in the process of data analysis and machine learning model building ?Data AnalysisEDA(正确答案)Data FrameNone of the above19. What is not Utility of EDA ?Maximize the insight in the data setDetect outliers and anomaliesVisualization of dataTest underlying assumptions(正确答案)20. what can hamper the further steps in the machine learning model building process If not performed properly ?Recapitulation of the DataAccumulating the dataEDA(正确答案)None of the above21. Which plot for EDA to check the dependency between two variables ? HistogramsScatter plots(正确答案)MapsTime series plots22. What function will tell you the top records in the data set?shapehead(正确答案)showall of the aboce23. what type of data is useful for internal policymaking and business strategy building for an organization ?public dataprivate data(正确答案)bothNone of the above24. The ………… function can “fill in” NA valueswith non-null data ?headfillna(正确答案)shapeall of the above25. If you want to simply exclude the missing values, then what function along with the axis argument will be use?fillnareplacedropna(正确答案)isnull26. Which of the following attribute of DataFrame is used to display data type of each column in DataFrame?DtypesDTypesdtypes(正确答案)datatypes27. Which of the following function is used to load the data from the CSV file into a DataFrame?read.csv()readcsv()read_csv()(正确答案)Read_csv()28. how to Display first row of dataframe ‘DF’ ?print(DF.head(1))print(DF[0 : 1])print(DF.iloc[0 : 1])All of the above(正确答案)29. Spread function is known as ................ in spreadsheets ?pivotunpivot(正确答案)castorder30. ................. extract a subset of rows from a data fram based on logical conditions ? renamefilter(正确答案)setsubset31. We can shift the DataFrame’s index by a certain number of periods usingthe …………. Method ?melt()merge()tail()shift()(正确答案)32. We can join melted DataFrames into one Analytical Base Table using the ……….. function.join()append()merge()(正确答案)truncate()33. What methos is used to concatenate datasets along an axis ?concatenate()concat()(正确答案)add()merge()34. Rows can be …………….. if the number of missing values is insignificant, as thiswould not impact the overall analysis results.deleted(正确答案)updatedaddedall35. There is a specific reason behind the missing value.What stands for Missing not at randomMCARMARMNAR(正确答案)None of the above36. While plotting data, some values of one variable may not lie beyond the expectedrange, but when you plot the data with some other variable, these values may lie far from the expected value.Identify the type of outliers?Univariate outliersMultivariate outliers(正确答案)ManyVariate outlinersNone of the above37. if numeric values are stored as strings, then it would not be possible to calculatemetrics such as mean, median, etc.Then what type of data cleaning exercises you will perform ?Convert incorrect data types:(正确答案)Correct the values that lie beyond the rangeCorrect the values not belonging in the listFix incorrect structure:38. Rows that are not required in the analysis. E.g ifobservations before or after a particular date only are required for analysis.What steps we will do when perform data filering ?Deduplicate Data/Remove duplicateddataFilter rows tokeep only therelevant data.(正确答案)Filter columns Pick columnsrelevant toanalysisBring the datatogether, Groupby required keys,aggregate therest39. you need to…………... the data in order to get what you need for your analysis. searchlengthorderfilter(正确答案)40. Write the output of the following ?>>> import pandas as pd >>> series1 =pd.Series([10,20,30])>>> print(series1)0 101 202 30dtype: int64(正确答案)102030dtype: int640 1 2 dtype: int64None of the above41. What will be output for the following code?import numpy as np a = np.array([1, 2, 3], dtype = complex) print a[[ 1.+0.j, 2.+0.j, 3.+0.j]][ 1.+0.j]Error[ 1.+0.j, 2.+0.j, 3.+0.j](正确答案)42. What will be output for the following code?import numpy as np a =np.array([1,2,3]) print a[[1, 2, 3]][1][1, 2, 3](正确答案)Error43. What will be output for the following code?import numpy as np dt = dt =np.dtype('i4') print dtint32(正确答案)int64int128int1644. What will be output for the following code?import numpy as np dt =np.dtype([('age',np.int8)]) a = np.array([(10,),(20,),(30,)], dtype = dt)print a['age'][[10 20 30]][10 20 30](正确答案)[10]Error45. We can add a new row to a DataFrame using the _____________ methodrloc[ ]iloc[ ]loc[ ](正确答案)None of the above46. Function _____ can be used to drop missing values.fillna()isnull()dropna()(正确答案)delna()47. The function to perform pivoting with dataframes having duplicate values is _____ ? pivot(unique = True)pivot()pivot_table(unique = True)pivot_table()(正确答案)48. A technique, which when performed on a dataframe, rearranges the data from rows and columns in a report form, is called _____ ?summarisingreportinggroupingpivoting(正确答案)49. Normal Distribution is symmetric is about ___________ ?VarianceMean(正确答案)Standard deviationCovariance50. Write a statement to display “Amount” as x-axis label. (consider plt as an alias name of matplotlib.pyplot)bel(“Amount”)plt.xlabel(“Amount”)(正确答案)plt.xlabel(Amount)None of the above51. Fill in the blank in the given code, if we want to plot a line chart for values of list ‘a’ vs values of list ‘b’.a = [1, 2, 3, 4, 5]b = [10, 20, 30, 40, 50]import matplotlib.pyplot as pltplt.plot __________(a, b)(正确答案)(b, a)[a, b]None of the above52. #Loading the datasetimport seaborn as snstips =sns.load_dataset("tips")tips.head()In this code what is tips ?plotdataset name(正确答案)paletteNone of the above53. Visualization can make sense of information by helping to find relationships in the data and support (or disproving) ideas about the dataAnalyzeRelationShip(正确答案)AccessiblePrecise54. In which option provides A detailed data analysis tool that has an easy-to-use tool interface and graphical designoptions for visuals.Jupyter NotebookSisenseTableau DesktopMATLAB(正确答案)55. Consider a bank having thousands of ATMs across China. In every transaction, Many variables are recorded.Which among the following are not fact variables.Transaction charge amountWithdrawal amountAccount balance after withdrawalATM ID(正确答案)56. Which module of matplotlib library is required for plotting of graph?plotmatplotpyplot(正确答案)None of the above57. Write a statement to display “Amount” as x-axis label. (consider plt as an alias name of matplotlib.pyplot)bel(“Amount”)plt.xlabel(“Amount”)(正确答案)plt.xlabel(Amount)None of the above58. What will happen when you pass ‘h’ as as a value to orient parameter of the barplot function?It will make the orientation vertical.It will make the orientation horizontal.(正确答案)It will make line graphNone of the above59. what is the name of the function to display Parameters available are viewed .set_style()axes_style()(正确答案)despine()show_style()60. In stacked barplot, subgroups are displayed as bars on top of each other. How many parameters barplot() functionhave to draw stacked bars?OneTwoNone(正确答案)three61. In Line Chart or Line Plot which parameter is an object determining how to draw the markers for differentlevels of the style variable.?x.yhuemarkers(正确答案)legend62. …………………..similar to Box Plot but with a rotated plot on each side, giving more information about the density estimate on the y axis.Pie ChartLine ChartViolin Chart(正确答案)None63. By default plot() function plots a ________________HistogramBar graphLine chart(正确答案)Pie chart64. ____________ are column-charts, where each column represents a range of values, and the height of a column corresponds to how many values are in that range.Bar graphHistograms(正确答案)Line chartpie chart65. The ________ project builds on top of pandas and matplotlib to provide easy plotting of data.yhatSeaborn(正确答案)VincentPychart66. A palette means a ________.. surface on which a painter arranges and mixed paints. circlerectangularflat(正确答案)all67. The default theme of the plotwill be ________?Darkgrid(正确答案)WhitegridDarkTicks68. Outliers should be treated after investigating data and drawing insights from a dataset.在调查数据并从数据集中得出见解后,应对异常值进行处理。
数据分析英语试题及答案
数据分析英语试题及答案一、选择题(每题2分,共10分)1. Which of the following is not a common data type in data analysis?A. NumericalB. CategoricalC. TextualD. Binary2. What is the process of transforming raw data into an understandable format called?A. Data cleaningB. Data transformationC. Data miningD. Data visualization3. In data analysis, what does the term "variance" refer to?A. The average of the data pointsB. The spread of the data points around the meanC. The sum of the data pointsD. The highest value in the data set4. Which statistical measure is used to determine the central tendency of a data set?A. ModeB. MedianC. MeanD. All of the above5. What is the purpose of using a correlation coefficient in data analysis?A. To measure the strength and direction of a linear relationship between two variablesB. To calculate the mean of the data pointsC. To identify outliers in the data setD. To predict future data points二、填空题(每题2分,共10分)6. The process of identifying and correcting (or removing) errors and inconsistencies in data is known as ________.7. A type of data that can be ordered or ranked is called________ data.8. The ________ is a statistical measure that shows the average of a data set.9. A ________ is a graphical representation of data that uses bars to show comparisons among categories.10. When two variables move in opposite directions, the correlation between them is ________.三、简答题(每题5分,共20分)11. Explain the difference between descriptive andinferential statistics.12. What is the significance of a p-value in hypothesis testing?13. Describe the concept of data normalization and its importance in data analysis.14. How can data visualization help in understanding complex data sets?四、计算题(每题10分,共20分)15. Given a data set with the following values: 10, 12, 15, 18, 20, calculate the mean and standard deviation.16. If a data analyst wants to compare the performance of two different marketing campaigns, what type of statistical test might they use and why?五、案例分析题(每题15分,共30分)17. A company wants to analyze the sales data of its products over the last year. What steps should the data analyst take to prepare the data for analysis?18. Discuss the ethical considerations a data analyst should keep in mind when handling sensitive customer data.答案:一、选择题1. D2. B3. B4. D5. A二、填空题6. Data cleaning7. Ordinal8. Mean9. Bar chart10. Negative三、简答题11. Descriptive statistics summarize and describe thefeatures of a data set, while inferential statistics make predictions or inferences about a population based on a sample.12. A p-value indicates the probability of observing the data, or something more extreme, if the null hypothesis is true. A small p-value suggests that the observed data is unlikely under the null hypothesis, leading to its rejection.13. Data normalization is the process of scaling data to a common scale. It is important because it allows formeaningful comparisons between variables and can improve the performance of certain algorithms.14. Data visualization can help in understanding complex data sets by providing a visual representation of the data, making it easier to identify patterns, trends, and outliers.四、计算题15. Mean = (10 + 12 + 15 + 18 + 20) / 5 = 14, Standard Deviation = √[(Σ(xi - mean)^2) / N] = √[(10 + 4 + 1 + 16 + 36) / 5] = √52 / 5 ≈ 3.816. A t-test or ANOVA might be used to compare the means ofthe two campaigns, as these tests can determine if there is a statistically significant difference between the groups.五、案例分析题17. The data analyst should first clean the data by removing any errors or inconsistencies. Then, they should transformthe data into a suitable format for analysis, such ascreating a time series for monthly sales. They might also normalize the data if necessary and perform exploratory data analysis to identify any patterns or trends.18. A data analyst should ensure the confidentiality andprivacy of customer data, comply with relevant data protection laws, and obtain consent where required. They should also be transparent about how the data will be used and take steps to prevent any potential misuse of the data.。
数据挖掘习题及解答-完美版
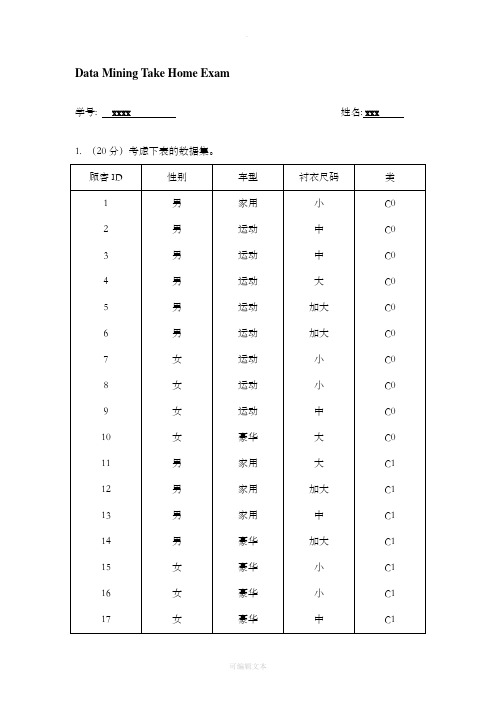
Data Mining Take Home Exam学号: xxxx 姓名: xxx 1. (20分)考虑下表的数据集。
(1)计算整个数据集的Gini 指标值。
(2)计算属性性别的Gini 指标值(3)计算使用多路划分属性车型的Gini 指标值 (4)计算使用多路划分属性衬衣尺码的Gini 指标值(5)下面哪个属性更好,性别、车型还是衬衣尺码?为什么? 解:(1) Gini=1-(10/20)^2-(10/20)^2=0.5 (2)Gini=[{1-(6/10)^2-(4/10)^2}*1/2]*2=0.48 (3)Gini={1-(1/4)^2-(3/4)^2}*4/20+{1-(8/8)^2-(0/8)^2}*8/20+{1-(1/8)^2-(7/8)^2}*8/2 0=26/160=0.1625(4)Gini={1-(3/5)^2-(2/5)^2}*5/20+{1-(3/7)^2-(4/7)^2}*7/20+[{1-(2/4)^2-(2/4)^2}*4/ 20]*2=8/25+6/35=0.4914(5)比较上面各属性的Gini值大小可知,车型划分Gini值0.1625最小,即使用车型属性更好。
2. (20分)考虑下表中的购物篮事务数据集。
(1) 将每个事务ID视为一个购物篮,计算项集{e},{b,d} 和{b,d,e}的支持度。
(2)使用(1)的计算结果,计算关联规则{b,d}→{e}和{e}→{b,d}的置信度。
(3)将每个顾客ID作为一个购物篮,重复(1)。
应当将每个项看作一个二元变量(如果一个项在顾客的购买事务中至少出现一次,则为1,否则,为0)。
(4)使用(3)的计算结果,计算关联规则{b,d}→{e}和{e}→{b,d}的置信度。
答:(1)由上表计数可得{e}的支持度为8/10=0.8;{b,d}的支持度为2/10=0.2;{b,d,e}的支持度为2/10=0.2。
(2)c[{b,d}→{e}]=2/8=0.25; c[{e}→{b,d}]=8/2=4。
数据挖掘试题
数据挖掘试题1. 解释什么是数据挖掘(Data Mining)。
答:数据挖掘是通过应用统计学、机器学习和模式识别等技术,从大量数据中发现隐藏在其中的模式、关联和规律的过程。
它可以帮助人们从原始数据中提取有价值的信息,以支持决策、预测和优化等任务。
2. 请说明数据挖掘的主要任务。
答:数据挖掘的主要任务包括以下几个方面:- 分类:根据已有的数据标签和特征构建分类模型,将新的数据实例分到预定义的类别中。
- 聚类:根据数据的相似性将其分组,以发现隐藏的数据群体和类别。
- 关联规则挖掘:发现数据项之间的关联和依赖关系,如购物篮分析中发现常一起购买的商品。
- 预测分析:通过已有的数据建立预测模型,用于预测未来的趋势、结果或行为。
- 回归分析:根据数据的特征和标签之间的关系建立回归模型,用于预测连续值的结果。
- 异常检测:发现与正常模式不符的异常数据点,如欺诈检测。
- 文本挖掘:从大量的文本数据中提取有意义的信息和知识,如情感分析、主题提取等。
- 图像和视频挖掘:从图片和视频数据中提取有价值的信息和特征。
3. 请列举常用的数据挖掘算法。
答:常用的数据挖掘算法包括:- 决策树算法(Decision Tree)- 支持向量机算法(Support Vector Machine)- 贝叶斯分类算法(Naive Bayes)- 逻辑回归算法(Logistic Regression)- 人工神经网络算法(Artificial Neural Networks)- 随机森林算法(Random Forest)- 聚类算法(K-means,DBSCAN等)- 关联规则挖掘算法(Apriori,FP-Growth等)- 主成分分析算法(Principal Component Analysis)- 线性回归算法(Linear Regression)4. 数据预处理在数据挖掘中的作用是什么?答:数据预处理是数据挖掘的一个重要步骤,其作用主要有以下几个方面:- 数据清洗:处理缺失值、异常值和噪声,以确保数据的完整性和质量。
数据挖掘第二次作业
数据挖掘第二次作业第一题:1.a) Compute the Information Gain for Gender, Car Type and Shirt Size.b) Construct a decision tree with Information Gain.答案:a)因为class分为两类:C0和C1,其中C0的频数为10个,C1的频数为10,所以class元组的信息增益为Info(D)==11.按照Gender进行分类:Info gender(D)==0.971Gain(Gender)=1-0.971=0.0292.按照Car Type进行分类Info carType(D)==0.314 Gain(Car Type)=1-0.314=0.6863.按照Shirt Size进行分类:Info shirtSize(D)==0.988Gain(Shirt Size)=1-0.988=0.012b)由a中的信息增益结果可以看出采用Car Type进行分类得到的信息增益最大,所以决策树为:第二题:2. (a) Design a multilayer feed-forward neural network (one hidden layer) for thedata set in Q1. Label the nodes in the input and output layers.(b) Using the neural network obtained above, show the weight values after oneiteration of the back propagation algorithm, given the training instance “(M, Family, Small)". Indicate your initial weight values and biases and the learning rate used.a)x 11x 12x 21x 22x 23x 31x 32x 33x 34输入层隐藏层输出层b) 由a 可以设每个输入单元代表的属性和初始赋值由于初始的权重和偏倚值是随机生成的所以在此定义初始值为:净输入和输出:每个节点的误差表:10 0.0089 11 0.0030 12 -0.12权重和偏倚的更新: W 1,10 W 1,11 W 2,10 W 2,11 W 3,10 W 3,11 W 4,10 W 4,11 W 5,10 W 5,11 0.201 0.198 -0.211 -0.099 0.4 0.308 -0.202 -0.098 0.101 -0.100 W 6,10 W 6,11 W 7,10 W 7,11 W 8,10 W 8,11 W 9,10 W 9,11 W 10,12 W 11,12 0.092 -0.211 -0.400 0.198 0.201 0.190 -0.110 0.300 -0.304 -0.099 θ10 θ11 θ12 -0.287 0.1790.344第三题:3.a) Suppose the fraction of undergraduate students who smoke is 15% and thefraction of graduate students who smoke is 23%. If one-fifth of the college students are graduate students and the rest are undergraduates, what is the probability that a student who smokes is a graduate student?b) Given the information in part (a), is a randomly chosen college student morelikely to be a graduate or undergraduate student?c) Suppose 30% of the graduate students live in a dorm but only 10% of theundergraduate students live in a dorm. If a student smokes and lives in the dorm, is he or she more likely to be a graduate or undergraduate student? You can assume independence between students who live in a dorm and those who smoke.答:a) 定义:A={A 1 ,A 2}其中A 1表示没有毕业的学生,A 2表示毕业的学生,B 表示抽烟则由题意而知:P(B|A 1)=15% P(B|A 2)=23% P(A 1)= P(A 2)=则问题则是求P(A 2|B)由()166.0)()|B ()()|B (B 2211=+=A P A p A P A P P则()277.0166.02.023.0)()()|(|222=⨯=⨯=B P A P A B P B APb) 由a 可以看出随机抽取一个抽烟的大学生,是毕业生的概率是0.277,未毕业的学生是0.723,所以有很大的可能性是未毕业的学生。
数据挖掘一些简答题
一简答题4x5二专业翻译3x15三计算1x15四算法描述Why Data Mining?there are some reasons below:1.The explosive growth of data:from terabytes to petabytes2.We are drowning in data but starving for knowledge3.“Necessity is the mother of invention”,data mining can meet the need that automated analysis of massive data sets.What Is Data Mining?Data Mining is the process of discovering interesting patterns from massive amounts of data. as a knowledge discovery process, it typically involves :data cleaning,data integration,data selection,data transformation,data mining,pattern evaluation,knowledge presentation.A Multi-Dimensional View of Data Miningthe major dimensions are data ,knowledge,technology,and application.What Kinds of Data Can Be Mined?as a general technology,data mining can be applied to any kind of data as long as the data are meaningful for a target application.the most basic forms of data for mining application are database data,data warehouse data,transaction data .advanced data can be mined: time-related or sequence data,data streams,spatial data and spatiotemporal data,text data,multimedia data , graph or network data,and web data.What Kinds of Patterns Can Be Mined????a pattern is interesting if it is valid on test data with some degree of certainty,novel,potentially useful,and easily understood by humans,Interesting patterns represent knowledge.Measures of pattern interestingness,either objective or subjective ,can be used to guide the discovery process.What Kinds of Technologies Are Used?statics;machine learning; pattern recognition; visualization; algorithms; high-performance computing; application; information retrieval; data warehouse; database systems.What Kinds of Applications Are Targeted?Data mining has many successful applications, such as business intelligence, Web search, bioinformatics,Major Issues in Data MiningThere are many challenging issues in data mining research. Areas include mining methodology, user interaction,efficiency and scalability, and dealing with diverse data types. Data mining research has strongly impactedsociety and will continue to do so in the future.。
北京大学《数据仓库与数据挖掘》试题答案整理
《数据仓库与数据挖掘》试题与答案整理2013级智能系高飙1.名词解释5x4(1)主题主题(Subject):宏观分析领域所涉及的分析对象。
是在较高层次上将企业信息系统中的数据进行综合、归类和分析利用的一个抽象概念,每一个主题基本对应一个宏观的分析领域。
面向主题的数据组织方式:在较高的层次上对分析对象的数据的一个完整、一致的描述。
(2)事实(P联机分析)事实是数值度量的;存储一个多维数据,表达期望分析的主题(目的、感兴趣的事情、事件或者指标等);具有一定的粒度,粒度的大小与维层次相关;一个事实中通常包含一个或者多个度量一个事实的两个组件:数字型指标、聚集函数(3)数据归约(P数据预处理)在可能获得相同或相似结果的前提下,对数据的容量进行有效的缩减数据归约的方法:1数据立方体聚集:聚集操作作用于立方体中的数据2减少数据维度(维归约):可以检测并删除不相关、弱相关或者冗余的属性或维3数据压缩:使用编码机制压缩数据集4数值压缩:用替代的、较小的数据表示替换或估计数据5数据离散化以及概念层次的建立:属性的原始值用区间值或较高层的概念予以替换(4)兴趣度(P数据挖掘)一个数据挖掘系统的挖掘结果可能会产生成千上万个模式,但是并不是所有的模式都有意义。
兴趣度度量用于将不感兴趣的模式从知识中分开。
他们可以用于指导挖掘过程,或在挖掘之后,评估发现的模式。
不同类型的数据需要不同的兴趣度量。
兴趣度的度量:一个模式是否感兴趣,取决于它是否容易被用户所理解,是否有效可信,是否潜在有用,是否新颖等兴趣度的度量:客观的度量: 从模式的角度出发,基于模式结构的某些统计的结果,如:支持度(support)、置信度(confidence)等。
主观的度量:从用户的角度出发,对模式的信任程度,如:新颖性、可操作性等。
(5)数据分区(片)(P数据仓库设计)把逻辑上统一的数据分割成较小的、可以独立管理的物理单元(分片)进行存储。
可按时间、按地区、按业务类型进行数据分片(6)数据挖掘数据挖掘是识别数据中有效的、新颖的、潜在有用的和最终可被理解的模式(Pattern)的非平凡过程。
- 1、下载文档前请自行甄别文档内容的完整性,平台不提供额外的编辑、内容补充、找答案等附加服务。
- 2、"仅部分预览"的文档,不可在线预览部分如存在完整性等问题,可反馈申请退款(可完整预览的文档不适用该条件!)。
- 3、如文档侵犯您的权益,请联系客服反馈,我们会尽快为您处理(人工客服工作时间:9:00-18:30)。
1.Below is a table representing eight transactions and five items: Beer, Coke, Pepsi,Milk, and Juice. The items are represented by their first letters; e.g., "M" = milk.which of the pairs are frequent itemsets?2.Here is a table with seven transactions and six items, A through F. An "x"indicates that the item is in the transaction.A B C D E Fx x x x xx x x x xx x x xx x xx x x x xx x xx x xAssume that the support threshold is 2. Find all the closed frequent itemsets. Answer: There are many ways to find the frequent itemsets, but the amount of data is small, so we'll just list the results.Among the pairs, all but AF are frequent. The counts are:AC, CE: 5AE, CD: 4AD, BC, BD, BE, BF, DE: 3AB, CF, DF, EF: 2Here are the counts of the frequent triples:ACE: 4ACD, BCE, CDE: 3ABC, ABE, ADE, BCD, BDE, BDF, BCF, BEF, CEF: 2There are four quadruples that are frequent, all with counts of 2: BCEF, BCDE, ACDE, and ABCE. There are no frequent sets of five items.To be closed, the itemset must have a larger count than all of its immediate supersets. Thus, all four of the listed quadruples are closed. A triple with a count of 2 cannot be closed unless it is contained in none of the four frequent quadruples. Among these, only BDF qualifies as closed. However, each of the triples with a count of 3 or 4 is closed, since there are no quadruples with counts this high.Among the pairs, only AC, CD, BD, and BF are closed. Among the singletons, only A and F are not closed. A, which appears 5 times, is contained in AC, which also occurs 5 times, and F, which occurs 3 times, is not closed because BF also appears 3 times.3. Find the set of 2-shingles for the "document":ABRACADABRAand also for the "document":BRICABRACAnswer the following questions:1.How many 2-shingles does ABRACADABRA have?2.How many 2-shingles does BRICABRAC have?3.How many 2-shingles do they have in common?4.What is the Jaccard similarity between the two documents"?Answer: The 2-shingles for ABRACADABRA: AB, BR, RA, AC, CA, AD, DA. The 2-shingles for BRICABRAC: BR, RI, IC, CA, AB, RA, AC.There are 5 shingles in common:AB, BR, RA, AC, CA.As there are 9 different shingles in all, the Jaccard similarity is 5/9.State the correct minhash value of each column.Answer: Look at the rows in the stated order R4, R6, R1, R3, R5, R2, and for each row, make that row be the minhash value of a column if the column has not yet beenassigned a minhash value. We sart with R4, which only has 1 in column C3, so the minhash value for C3 is R4.Next, we consider R6, which has 1 in C2 only. Since C2 does not yet have a minhash value, R6 becomes its value.Next is R1, with 1's in C2 and C3. However, both these columns already have minhash values, so we do nothing.Next, consider R3. It has 1's in C2 and C4. C2 already has a minhash value, but C4 does not. Thus, the minhash value of C4 is R3.When we consider R5 next, we see it has 1's in C1 and C3. The latter already has a minhash value, but R5 becomes the minhash value for C1. Since all columns now have minhash values, we are done.5. Perform a hierarchical clustering of the following six points:using the centroid proximity measure (distance between two clusters is the distance between their centroids). If you do this task correctly, you will find that there is a stage at which there is a tie for which pair of clusters is closest. Follow both choices. You will find that some sets of points are clusters in both cases, some sets are clusters in only one, and some are not clusters regardless of which choice you make. Answer: First, A and B, being the closest pair of points gets merged. The centroid for this pair is at (5,5). The next closest pair of centroids is C and F, so these are merged and their centroid is at (24.5, 13.5). At this time, there is a tie for closest centroids. AB and CF have centroids at distance sqrt(452.5), and so do D and CF. Thus, there are two possible third merges:1.Merge AB and CF, giving three clusters ABCF, D, and E. The centroid of ABCF is(14.75, 9.25). In this case, the next merge is ABCD with E.2.Merge CF with D, giving three clusters CDF, AB, and E. The centroid of CDF is at(27.33, 20). In this case, the next merge is E with AB.As a result, the two sequences of clusters created are:1.AB, CF, ABCF, ABCEF, ABCDEF.2.AB, CF, CDF, ABE, ABCDEF.6.Consider three Web pages with the following links:Suppose we compute PageRank with a β of 0.7, and we introduce the additional constraint that the sum of the PageRanks of the three pages must be 3, to handle the problem that otherwise any multiple of a solution will also be a solution. Compute the PageRanks a, b, and c of the three pages A, B, and C, respectively.Answer: The rules for computing the next value of a, b, or c as we iterate are:a <- .3b <- .7(a/2) + .3c <- .7(a/2+b+c) + .3The reason is that a splits its PageRank between b and c, while b gives all of its to c, and c keeps all its own. However, all PageRank is multiplied by .7 before distribution (the "tax"), and .3 is then added to each new PageRank.In the limit, the assignments become equalities. That immediately tells us a = .3. We can then use the second equation to discover b = .7*.3/2 + .3 = .405. Finally, the third equation simplifies to c = .7(.555 + c) + .3, or .3c = .6885. From this equation we get c = 2.295. It is now a simple matter to compute the subs of each two of the variables: a+b = .705, a+c = 2.595, and b+c = 2.7.7. 分析我们提到的各种算法的优缺点。