ChartDirector图表样式示例
两款Web图表工具比较:ChartDirector与JreeChart
两款Web图表工具的比较:ChartDirector与JreeChart一、引言:我最近在做项目的时候,要用到图表,其中画图表工具有好多种,今天我们就对ChartDirector与JreeChart这2种进行学习和比较,掌握技术路径,即掌握安装配置方式,接口,调用方法,例子等。
下载了ChartDirector,挺简单的,照着提供的jsp的例子,改一下数据、横坐标内容就马上能运行了,提供的函数命名也很规范,一看大概就知道用途,挺好理解的,生成的图表也很漂亮。
下载JreeChart,这个东西配置也挺简单的,图表质量不如ChartDirector好看,而且生成的图片的大小还大。
二、ChartDirector与JreeChart的介绍与比较官方网址ChartDirector: /JreeChart: /jfreechart/index.html基本介绍两款都是流行的Web图表工具:ChartDirector:ChartDirector控件使用方便,快捷,灵活,功能强大,交互性强。
在Web服务器以及嵌入式应用程序开发中,它是一种非常理想的工具,拥有丰富的图表图形组件库。
支持多种图表样式,如圆形图表(饼状图),圆环图,柱形图(条形图),直线图,曲线图,梯级线图,趋势线图,曲线拟合图,线间色图,区域图,散布图(散形图),泡沫图等。
采用多线程结构,特别应用于具有高性能要求的服务器端应用程序开发。
拥有基于API(应用编程接口)的对象,允许用户控制和定制图表细节,从而设计出用户满意的图表。
JreeChart:JFreeChart是一个开源的 JAVA 项目,它主要用来开发各种各样的图表,这些图表包括:饼图、柱状图 ( 普通柱状图以及堆栈柱状图 ) 、线图、区域图、分布图、混合图、甘特图以及一些仪表盘等等。
在这些不同式样的图表上可以满足目前商业系统的要求。
JFreeChart 是一种基于 JAVA 语言的图表开发技术。
柱状图英文描述范文

柱状图英文描述范文英文回答:A bar chart is a graphical representation of data that uses vertical or horizontal bars to show the values of different categories. Each bar represents a single category, and the length of the bar represents the value of that category. Bar charts are often used to compare different values or to show trends over time.There are two main types of bar charts: vertical bar charts and horizontal bar charts. Vertical bar charts have bars that are drawn vertically, while horizontal bar charts have bars that are drawn horizontally. The choice of which type of bar chart to use depends on the data being represented.Bar charts are a versatile type of chart that can be used to represent a variety of data. They are easy to understand and interpret, and they can be used to quicklycompare different values or trends. However, bar charts can be limited in the amount of data that they can represent, and they can be difficult to use to represent complex data.Here is an example of a bar chart that shows the sales of different products in a store:[Image of a bar chart]The x-axis of the chart shows the different products, and the y-axis shows the sales in dollars. The length of each bar represents the sales of that product. The chart shows that Product A had the highest sales, followed by Product B and Product C.中文回答:柱形图是一种图形化表示数据的图表,它使用垂直或水平条来显示不同类别的值。
使用DevExpress的WebChartControl控件绘制图表(柱状图、折线图、饼图)
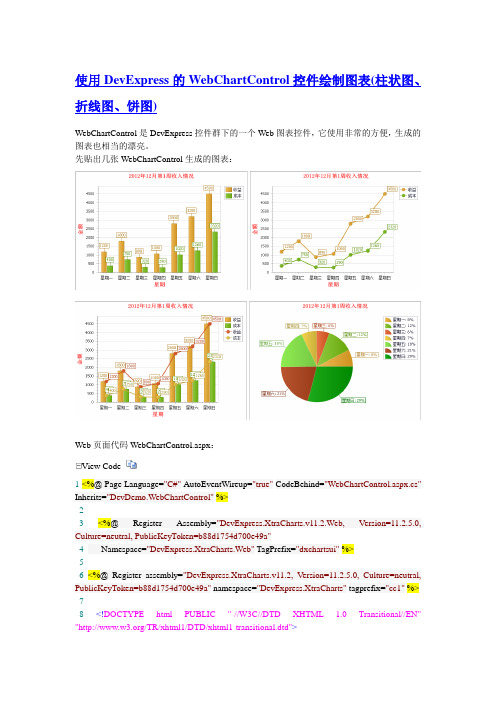
使用DevExpress的WebChartControl控件绘制图表(柱状图、折线图、饼图)WebChartControl是DevExpress控件群下的一个Web图表控件,它使用非常的方便,生成的图表也相当的漂亮。
先贴出几张WebChartControl生成的图表:Web页面代码WebChartControl.aspx:View Code1 <%@ Page Language="C#" AutoEventWireup="true" CodeBehind="WebChartControl.aspx.cs" Inherits="DevDemo.WebChartControl" %>23<%@ Register Assembly="DevExpress.XtraCharts.v11.2.Web, Version=11.2.5.0, Culture=neutral, PublicKeyToken=b88d1754d700e49a"4Namespace="DevExpress.XtraCharts.Web" TagPrefix="dxchartsui" %>56<%@ Register assembly="DevExpress.XtraCharts.v11.2, Version=11.2.5.0, Culture=neutral, PublicKeyToken=b88d1754d700e49a" namespace="DevExpress.XtraCharts" tagprefix="cc1" %> 78<!DOCTYPE html PUBLIC "-//W3C//DTD XHTML 1.0 Transitional//EN" "/TR/xhtml1/DTD/xhtml1-transitional.dtd">910<html xmlns="/1999/xhtml">11<head runat="server">12<title></title>13</head>14<body>15<form id="form1"runat="server">16<div>17<dxchartsui:WebChartControl ID="WebChartControl1"runat="server" Width="500px"Height="350px">18</dxchartsui:WebChartControl>1920<dxchartsui:WebChartControl ID="WebChartControl3"runat="server" Width="500px"Height="350px">21</dxchartsui:WebChartControl>22<dxchartsui:WebChartControl ID="WebChartControl2"runat="server" Width="500px"Height="350px">23</dxchartsui:WebChartControl>24<dxchartsui:WebChartControl ID="WebChartControl4"runat="server" Width="500px"Height="350px">25</dxchartsui:WebChartControl>26</div>27</form>28</body>29</html>Web页面后台代码WebChartControl.aspx.csView Code1using System;2using System.Collections.Generic;3using System.Linq;4using System.Web;5using System.Web.UI;6using System.Web.UI.WebControls;7using System.Data;8using DevExpress.XtraCharts;9using System.Drawing;1011namespace DevDemo12 {13public partial class WebChartControl : System.Web.UI.Page14{15protected void Page_Load(object sender, EventArgs e)17this.DrawBar();18this.DrawLine();19this.DrawPie();20this.DrawBarAndLine();21}2223///<summary>24///绘制柱状图25///</summary>26private void DrawBar()27{2829ChartServices.SetChartTitle(this.WebChartControl1, true, "2012年12月第1周收入情况", true, 2, StringAlignment.Center, ChartTitleDockStyle.Top, true, new Font("宋体", 12, FontStyle.Bold), Color.Red, 10); //如不需显示图表标题可不用调用本段代码,下同30ChartServices.DrawChart(this.WebChartControl1, "收益", ViewType.Bar, ServiceData.GetWeekMoneyAndCost(), "week", "money");31ChartServices.DrawChart(this.WebChartControl1, "成本", ViewType.Bar, ServiceData.GetWeekMoneyAndCost(), "week", "cost");32ChartServices.SetAxisX(this.WebChartControl1, true, StringAlignment.Center, "星期", Color.Red, true, new Font("宋体", 12, FontStyle.Bold)); //如不需显示X轴标题,可不调用该行代码,下同33ChartServices.SetAxisY(this.WebChartControl1, true, StringAlignment.Center, "金额", Color.Red, true, new Font("宋体", 12, FontStyle.Bold)); //如不需显示Y轴标题,可不调用该行代码,下同34}3536///<summary>37///绘制折线图38///</summary>39private void DrawLine()40{41ChartServices.SetChartTitle(this.WebChartControl3,true,"2012年12月第1周收入情况", true, 2, StringAlignment.Center, ChartTitleDockStyle.Top, true, new Font("宋体", 12, FontStyle.Bold), Color.Red, 10);42ChartServices.DrawChart(this.WebChartControl3, "收益", ViewType.Line, ServiceData.GetWeekMoneyAndCost(), "week", "money");43ChartServices.DrawChart(this.WebChartControl3, "成本", ViewType.Line, ServiceData.GetWeekMoneyAndCost(), "week", "cost");44ChartServices.SetAxisX(this.WebChartControl3, true, StringAlignment.Center, "星期", Color.Red, true, new Font("宋体", 12, FontStyle.Bold));45ChartServices.SetAxisY(this.WebChartControl3, true, StringAlignment.Center, "金额", Color.Red, true, new Font("宋体", 12, FontStyle.Bold));4748///<summary>49///柱状图和折线图在同一图表中50///</summary>51private void DrawBarAndLine()52{53ChartServices.SetChartTitle(this.WebChartControl2,true,"2012年12月第1周收入情况", true, 2, StringAlignment.Center, ChartTitleDockStyle.Top, true, new Font("宋体", 12, FontStyle.Bold), Color.Red, 10);54ChartServices.DrawChart(this.WebChartControl2, "收益", ViewType.Bar, ServiceData.GetWeekMoneyAndCost(), "week", "money");55ChartServices.DrawChart(this.WebChartControl2, "成本", ViewType.Bar, ServiceData.GetWeekMoneyAndCost(), "week", "cost");56ChartServices.SetAxisX(this.WebChartControl2, true, StringAlignment.Center, "星期", Color.Red, true, new Font("宋体", 12, FontStyle.Bold));57ChartServices.SetAxisY(this.WebChartControl2, true, StringAlignment.Center, "金额", Color.Red, true, new Font("宋体", 12, FontStyle.Bold));5859ChartServices.SetChartTitle(this.WebChartControl2,false,"2012年12月第1周收入情况", true, 2, StringAlignment.Center, ChartTitleDockStyle.Top, true, new Font("宋体", 12, FontStyle.Bold), Color.Red, 10);60ChartServices.DrawChart(this.WebChartControl2, "收益", ViewType.Line, ServiceData.GetWeekMoneyAndCost(), "week", "money");61ChartServices.DrawChart(this.WebChartControl2, "成本", ViewType.Line, ServiceData.GetWeekMoneyAndCost(), "week", "cost");62ChartServices.SetAxisX(this.WebChartControl2, true, StringAlignment.Center, "星期", Color.Red, true, new Font("宋体", 12, FontStyle.Bold));63ChartServices.SetAxisY(this.WebChartControl2, true, StringAlignment.Center, "金额", Color.Red, true, new Font("宋体", 12, FontStyle.Bold));64}6566///<summary>67///绘制饼图68///</summary>69private void DrawPie()70{71ChartServices.SetChartTitle(this.WebChartControl4,true,"2012年12月第1周收入情况", true, 2, StringAlignment.Center, ChartTitleDockStyle.Top,true,new Font("宋体", 12, FontStyle.Bold), Color.Red, 10);72ChartServices.DrawChart(this.WebChartControl4, ServiceData.GetWeekMoneyAndCost().Rows[0][0].ToString(), ViewType.Pie, ServiceData.GetWeekMoneyAndCost(), "week", "money");73}74}75 }数据提供类ServiceData.cs,主要作用为图表控件提供数据源View Code1using System;2using System.Collections.Generic;3using System.Linq;4using System.Web;5using System.Data;67namespace DevDemo8 {9public static class ServiceData10{11///<summary>12///获取一周收入和支出数据13///</summary>14///<returns>Datatable数据集合(可从数据库读取以datatable形式返回,此处为演示方便直接构造)</returns>15public static DataTable GetWeekMoneyAndCost()16{17DataTable dt = new DataTable();18dt.Columns.Add("week", typeof(string));19dt.Columns.Add("money", typeof(decimal));20dt.Columns.Add("cost", typeof(decimal));2122dt.Rows.Add("星期一", 1200,400);23dt.Rows.Add("星期二", 1800,750);24dt.Rows.Add("星期三", 890,320);25dt.Rows.Add("星期四", 1080,290);26dt.Rows.Add("星期五", 2800,1020);27dt.Rows.Add("星期六", 3200,1260);28dt.Rows.Add("星期日", 4500,2320);29return dt;30}31}32 }图表控件辅助类ChartServices.cs,控制生成图表View Code1using System;2using System.Collections.Generic;3using System.Linq;4using System.Web;5using System.Drawing;6using DevExpress.XtraCharts;7using System.Data;89namespace DevDemo10 {11public static class ChartServices12{13///<summary>14///绘制图形15///</summary>16///<param name="control">图表控件</param>17///<param name="seriesName">系列名</param>18///<param name="type">类型</param>19///<param name="dt">数据源</param>20///<param name="column1"></param>21///<param name="column2"></param>22public static void DrawChart(DevExpress.XtraCharts.Web.WebChartControl control, string seriesName, ViewType type, DataTable dt, string column1, string column2)23{24Series series = new Series(seriesName, type);25DataTable table = dt;26SeriesPoint point=null;27for (int i = 0; i < table.Rows.Count; i++)28{29point= new SeriesPoint(table.Rows[i][column1].ToString(), Convert.ToDouble(table.Rows[i][column2].ToString()));30series.Points.Add(point);31}32control.Series.Add(series);33//针对饼图的特殊处理34if(type==ViewType.Pie)35{36//设置显示方式(Argument:显示图例说明,ArgumentAndValues:显示图例内容和数据)bel.PointOptions.PointView = PointView.ArgumentAndValues; 38//设置数据显示形式(Percent:百分比,Currency:货币类型,数据前添加¥,Scientific:科学计数法)bel.PointOptions.V alueNumericOptions.Format = NumericFormat.Percent;40//数据是否保留小数(0:不保留小数位,1保留一位小数,2保留两位小数)bel.PointOptions.ValueNumericOptions.Precision = 0;4243//数据以百分比显示时只能是Default和None44((PieSeriesLabel)bel).ResolveOverlappingMode =ResolveOverlappingMode.Default;45}46}4748///<summary>49///设置图表标题50///</summary>51///<param name="control">图表控件</param>52//////<param name="isVisible">标题是否可见</param>53///<param name="text">标题文本</param>54///<param name="isWordWrop">是否换行</param>55///<param name="maxLineCount">最大允许行数</param>56///<param name="alignment">对齐方式</param>57///<param name="dock">位置</param>58///<param name="isAntialiasing">是否允许设置外观</param>59///<param name="font">字体</param>60///<param name="textColor">文本颜色</param>61///<param name="indent">字体缩进值</param>62public static void SetChartTitle(DevExpress.XtraCharts.Web.WebChartControl control,bool isVisible,String text, bool isWordWrop, int maxLineCount, StringAlignment alignment, ChartTitleDockStyle dock, bool isAntialiasing, Font font, Color textColor, int indent) 63{64//设置标题65ChartTitle title = new ChartTitle();66title.Visible = isVisible;67//显示文本68title.Text = text;69//是否允许换行70title.WordWrap = isWordWrop;71//最大允许行数72title.MaxLineCount = maxLineCount;73//对齐方式74title.Alignment = alignment;75//位置76title.Dock = dock;77//是否允许设置外观78title.Antialiasing = isAntialiasing;79//字体80title.Font = font;81//字体颜色82title.TextColor = textColor;83//缩进值84title.Indent = indent;85control.Titles.Add(title);86}878889///<summary>90///为X轴添加标题91///</summary>92///<param name="control">图形控件</param>93///<param name="isVisible">标题是否可见</param>94///<param name="aligment">对齐方式</param>95///<param name="text">标题显示文本</param>96///<param name="color">标题字体颜色</param>97///<param name="isAntialiasing">是否允许设置外观</param>98///<param name="font">字体</param>99public static void SetAxisX(DevExpress.XtraCharts.Web.WebChartControl control, bool isVisible, StringAlignment aligment, string text, Color color, bool isAntialiasing, Font font) 100{101XYDiagram xydiagram = (XYDiagram)control.Diagram;102xydiagram.AxisX.Title.Visible = isVisible;103xydiagram.AxisX.Title.Alignment = aligment;104xydiagram.AxisX.Title.Text = text;105xydiagram.AxisX.Title.TextColor = color;106xydiagram.AxisX.Title.Antialiasing = isAntialiasing;107xydiagram.AxisX.Title.Font = font;108}109110///<summary>111///为X轴添加标题112///</summary>113///<param name="control">图形控件</param>114///<param name="isVisible">标题是否可见</param>115///<param name="aligment">对齐方式</param>116///<param name="text">标题显示文本</param>117///<param name="color">标题字体颜色</param>118///<param name="isAntialiasing">是否允许设置外观</param>119///<param name="font">字体</param>120public static void SetAxisY(DevExpress.XtraCharts.Web.WebChartControl control, bool isVisible, StringAlignment aligment, string text, Color color, bool isAntialiasing, Font font) 121{122XYDiagram xydiagram = (XYDiagram)control.Diagram;123xydiagram.AxisY.Title.Visible = isVisible;124xydiagram.AxisY.Title.Alignment = aligment;125xydiagram.AxisY.Title.Text = text;126xydiagram.AxisY.Title.TextColor = color;127xydiagram.AxisY.Title.Antialiasing = isAntialiasing;128xydiagram.AxisY.Title.Font = font;129}130}131 }以上为本人的一点小小研究,如有不足之处,望不吝赐教!可详见/huabao-wei/archive/2012/12/17/DevWebChartControl.html。
Flex从入门到精通 第24章
24.1.2 序列类,坐标轴类和图表事件
序列类(Series Class)用来定义什么数据要在图表控件 中显示。所有的序列类都是 mx.charts.chartClasses.Series类的子类。每种图表类型 都有自己特有的序列类。例如条形图表控件就有相应的 BarSeries类来为BarChart控件定义数据。 一个序列的首要目的是定义在图表中显示的数据。使用序 列定义在数据源中的哪一部分应该用来显示图表X、Y轴上 的数据。它使用xField和yField属性来定义。每个序列都 有一组序列项目组成的。当建立一个新的序列时,就定义 displayName属性,此属性显示其序列,例如数据提示。通 常图表只定义一种序列,编程者也可以使用第二个序列。
24.1 图表组件概览
一个简单的图表表达了一个单个的数据序列。一 个序列是一系列的相关的数据点。例如,一个数 据序列可以是一个年度报告中的月销售额,或者 酒店每日的入住率。这些数据都由在二维象限的 图形,更直接,清晰的表现出来。
24.1.1 使用图表组件
Flex提供了大量的控件来显示图表。 除了饼图表之外的图表控件都是CartesianChart 类的子类。笛卡尔(Cartesian)图表是指在一个 方形的区域,二维象限的空间来表现一组数据。 饼图表是PolarChart类的子类,极面(Polar)图 表在一个圆形的区域显示数据。
BubbleChart控件每个数据点都显示了三项数据: 一个定义x坐标位置的值;一个定义y坐标位置的 值;一个定义图表符号相对于其它数据点大小的 值。使用BubbleSeries图表序列来定义 BubbleChart控件的数据。
24.2.4 蜡烛图表(Candlestick Chart)示例 CandlestickChart控件显示了金融数据为一系列 蜡烛图,以体现其高,低,开和关的数值。每个 蜡烛图垂直线上的上顶和下底代表了每个数据点 高和低的数据值,填充盒子的上顶和下底代表开 放和关闭的数值。基于每个数据点关闭的数值相 对开发的数值是高,还是低,每个蜡烛图就被不 同方式填充。 CandlestickChart控件的CandlestickSeries需要 所有四项数据:高,低,开,关。
学术英语图表描述范文

学术英语图表描述范文英文回答:Chart Description.The provided chart illustrates the average number of visitors to a particular national park over a six-year period. The data is presented in a bar graph, with the X-axis representing the year and the Y-axis representing the number of visitors in millions.The chart reveals a steady increase in the number of visitors to the park over the six-year period. In 2015, the park received approximately 2 million visitors. This number rose to around 2.5 million in 2016 and continued to increase each year thereafter. In 2020, the park welcomed an estimated 3.5 million visitors, marking a significant increase from the previous year.It is evident from the chart that the number ofvisitors to the park has grown substantially since 2015. This growth trend suggests that the park is becoming increasingly popular, possibly due to factors such as improved accessibility, increased marketing efforts, or the introduction of new attractions and facilities.中文回答:图表描述。
chartdirector图表例子(鼠标可拖动)
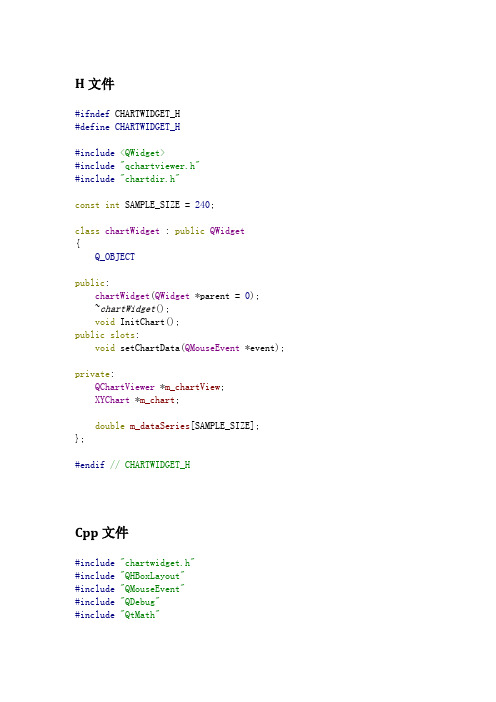
H文件#ifndef CHARTWIDGET_H#define CHARTWIDGET_H#include<QWidget>#include"qchartviewer.h"#include"chartdir.h"const int SAMPLE_SIZE=240;class chartWidget:public QWidget{Q_OBJECTpublic:chartWidget(QWidget*parent=0);~chartWidget();void InitChart();public slots:void setChartData(QMouseEvent*event);private:QChartViewer*m_chartView;XYChart*m_chart;double m_dataSeries[SAMPLE_SIZE];};#endif//CHARTWIDGET_HCpp文件#include"chartwidget.h"#include"QHBoxLayout"#include"QMouseEvent"#include"QDebug"#include"QtMath"chartWidget::chartWidget(QWidget*parent):QWidget(parent){m_chart=new XYChart(600,600,0xaaaafa);m_chartView=new QChartViewer(this);m_chartView->setGeometry(50,50,550,550);InitChart();//在QchartViewer中添加mousePressMove信号connect(m_chartView,SIGNAL(mousePressMove(QMouseEvent*)),this, SLOT(setChartData(QMouseEvent*)));QHBoxLayout*layout=new QHBoxLayout(this);layout->addWidget(m_chartView);setLayout(layout);}chartWidget::~chartWidget(){delete m_chart;}void chartWidget::InitChart(){m_chart->setPlotArea(50,50,500,500,0xcccccc);m_chart->addTitle("this is title");double values[10]={1.0,2.0,3.0,4.0,5.0,6.0,7.0,8.0,9.0};for(int i=0;i<10;++i){m_dataSeries[i]=values[i];}m_chart->yAxis()->setDateScale(0.0,15.0);m_chart->xAxis()->setDateScale(0.0,15.0);BarLayer*barLayer=m_chart->addBarLayer();barLayer->addDataSet(DoubleArray(m_dataSeries,10),0x00ff00);m_chartView->setChart(m_chart);}void chartWidget::setChartData(QMouseEvent*event)double yval=m_chart->getYValue(event->pos().y());double xval=m_chart->getXValue(event->pos().x());qDebug("(%f,%f)",xval,yval);XYChart*chart=new XYChart(600,600,0xaaaafa);chart->setPlotArea(50,50,500,500,0xcccccc);chart->addTitle("this is title");chart->yAxis()->setDateScale(0.0,15.0);chart->xAxis()->setDateScale(0.0,15.0);int pos=qFloor(xval+0.5);if(pos>=0&&pos<SAMPLE_SIZE){m_dataSeries[pos]=yval;}BarLayer*barLayer=chart->addBarLayer();barLayer->addDataSet(DoubleArray(m_dataSeries,10),0x00ff00);m_chartView->setChart(chart);delete m_chart;m_chart=chart;}。
利用pychartdir库生成图表,保存图片,转成字节数据

然后使用 office 办公软件编写所需要的模板 word,另存为 xml 文件 1.使用 office 软件编写一个所需要的 word 模板,编写好之后选择另存, 类型选择为 xml 文件。 2,使用 sublime 或者其他文本编辑打开 xml 文件,在模板相应位置替换成 渲染的数据模型,具体语法和 Django 模板的语法基本一致,如: 三 利用 jinja2 库渲染修改好的模板,然后写入.doc 文件即可 1.导入 jinja2 模块和相应模块 2.加载我们刚刚编辑好的 word 模板 3.打开和渲染模板 其中 w_id 和 w_pname 属性是 word 图片的属性,只要每一张图片 id name
一 利用 pychartdir 库生成图表,保存图片,转成字节数据 1.利用 pychartdir 库生成一个条形图 首先需要导入 pychartdir 库 我们以生成一个条形图为例子: 结果为一张图片: 2.我们在 word 中如果只是引用路径,那幺生成的 word 就会出现找不到图 片,此时,我们应该使用下面这个函数将图片转化为字节数据: 此时我们就拿到了我们想要的数据 我们可以将所需要画图的封装成一个工具类,只留取数据接口比如: 二
唯一即可 全部代码如下: 运行代码,即可生成我们想要的 word 报表 参考资料及其链接: Jinja2 安装: pychartdir 安装: Python 中要使用 pychartdir 的绘图的话需要安装 pychartdir 模块,其安装 方法不同于其他 python 模块的安装。 1.先下载 pychartdir,可从官网 advsofteng/download.html 下载对应的 zip 包 2.解压后的 doc 目录下有一个 pychartdir.chm 帮助文档
JFreeChart支持的图表类型总结
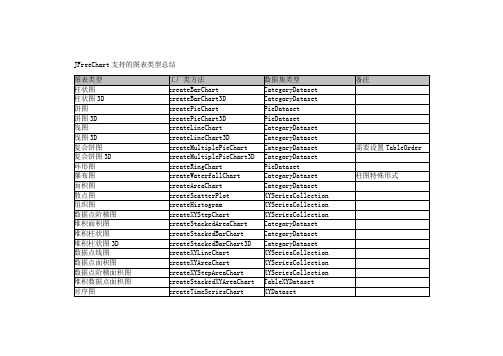
JFreeChart支持的图表类型总结JFreeChart类:void setAntiAlias(boolean flag) 字体模糊边界void setBackgroundImage(Image image) 背景图片void setBackgroundImageAlignment(int alignment) 背景图片对齐方式(参数常量在org.jfree.ui.Align类中定义)void setBackgroundImageAlpha(float alpha) 背景图片透明度(0.0~1.0)void setBackgroundPaint(Paint paint) 背景色void setBorderPaint(Paint paint) 边界线条颜色void setBorderStroke(Stroke stroke) 边界线条笔触void setBorderVisible(boolean visible) 边界线条是否可见-----------------------------------------------------------------------------------------------------------TextTitle类:void setFont(Font font) 标题字体void setPaint(Paint paint) 标题字体颜色void setText(String text) 标题内容-----------------------------------------------------------------------------------------------------------StandardLegend(Legend)类:void setBackgroundPaint(Paint paint) 图示背景色void setTitle(String title) 图示标题内容void setTitleFont(Font font) 图示标题字体void setBoundingBoxArcWidth(int arcWidth) 图示边界圆角宽void setBoundingBoxArcHeight(int arcHeight) 图示边界圆角高void setOutlinePaint(Paint paint) 图示边界线条颜色void setOutlineStroke(Stroke stroke) 图示边界线条笔触void setDisplaySeriesLines(boolean flag) 图示项是否显示横线(折线图有效)void setDisplaySeriesShapes(boolean flag) 图示项是否显示形状(折线图有效)void setItemFont(Font font) 图示项字体void setItemPaint(Paint paint) 图示项字体颜色void setAnchor(int anchor) 图示在图表中的显示位置(参数常量在Legend类中定义)-----------------------------------------------------------------------------------------------------------Axis类:void setVisible(boolean flag) 坐标轴是否可见void setAxisLinePaint(Paint paint) 坐标轴线条颜色(3D轴无效)void setAxisLineStroke(Stroke stroke) 坐标轴线条笔触(3D轴无效)void setAxisLineVisible(boolean visible) 坐标轴线条是否可见(3D轴无效)void setFixedDimension(double dimension) (用于复合表中对多坐标轴的设置)void setLabel(String label) 坐标轴标题void setLabelFont(Font font) 坐标轴标题字体void setLabelPaint(Paint paint) 坐标轴标题颜色void setLabelAngle(double angle)` 坐标轴标题旋转角度(纵坐标可以旋转)void setTickLabelFont(Font font) 坐标轴标尺值字体void setTickLabelPaint(Paint paint) 坐标轴标尺值颜色void setTickLabelsVisible(boolean flag) 坐标轴标尺值是否显示void setTickMarkPaint(Paint paint) 坐标轴标尺颜色void setTickMarkStroke(Stroke stroke) 坐标轴标尺笔触void setTickMarksVisible(boolean flag) 坐标轴标尺是否显示ValueAxis(Axis)类:void setAutoRange(boolean auto) 自动设置数据轴数据范围void setAutoRangeMinimumSize(double size) 自动设置数据轴数据范围时数据范围的最小跨度void setAutoTickUnitSelection(boolean flag) 数据轴的数据标签是否自动确定(默认为true)void setFixedAutoRange(double length) 数据轴固定数据范围(设置100的话就是显示MAXVALUE到MAXVALUE-100那段数据范围)void setInverted(boolean flag) 数据轴是否反向(默认为false)void setLowerMargin(double margin) 数据轴下(左)边距void setUpperMargin(double margin) 数据轴上(右)边距void setLowerBound(double min) 数据轴上的显示最小值void setUpperBound(double max) 数据轴上的显示最大值void setPositiveArrowVisible(boolean visible) 是否显示正向箭头(3D轴无效)void setNegativeArrowVisible(boolean visible) 是否显示反向箭头(3D轴无效)void setVerticalTickLabels(boolean flag) 数据轴数据标签是否旋转到垂直void setStandardTickUnits(TickUnitSource source) 数据轴的数据标签(可以只显示整数标签,需要将AutoTickUnitSelection设false)NumberAxis(ValueAxis)类:void setAutoRangeIncludesZero(boolean flag) 是否强制在自动选择的数据范围中包含0void setAutoRangeStickyZero(boolean flag) 是否强制在整个数据轴中包含0,即使0不在数据范围中void setNumberFormatOverride(NumberFormat formatter) 数据轴数据标签的显示格式void setTickUnit(NumberTickUnit unit) 数据轴的数据标签(需要将AutoTickUnitSelection设false)DateAxis(ValueAxis)类:void setMaximumDate(Date maximumDate) 日期轴上的最小日期void setMinimumDate(Date minimumDate) 日期轴上的最大日期void setRange(Date lower,Date upper) 日期轴范围void setDateFormatOverride(DateFormat formatter) 日期轴日期标签的显示格式void setTickUnit(DateTickUnit unit) 日期轴的日期标签(需要将AutoTickUnitSelection设false)void setTickMarkPosition(DateTickMarkPosition position) 日期标签位置(参数常量在org.jfree.chart.axis.DateTickMarkPosition类中定义)CategoryAxis(Axis)类:void setCategoryMargin(double margin) 分类轴边距void setLowerMargin(double margin) 分类轴下(左)边距void setUpperMargin(double margin) 分类轴上(右)边距void setVerticalCategoryLabels(boolean flag) 分类轴标题是否旋转到垂直void setMaxCategoryLabelWidthRatio(float ratio) 分类轴分类标签的最大宽度-----------------------------------------------------------------------------------------------------------Plot类:void setBackgroundImage(Image image) 数据区的背景图片void setBackgroundImageAlignment(int alignment) 数据区的背景图片对齐方式(参数常量在org.jfree.ui.Align类中定义)void setBackgroundPaint(Paint paint) 数据区的背景图片背景色void setBackgroundAlpha(float alpha) 数据区的背景透明度(0.0~1.0)void setForegroundAlpha(float alpha) 数据区的前景透明度(0.0~1.0)void setDataAreaRatio(double ratio) 数据区占整个图表区的百分比void setOutLinePaint(Paint paint) 数据区的边界线条颜色void setOutLineStroke(Stroke stroke) 数据区的边界线条笔触void setNoDataMessage(String message) 没有数据时显示的消息void setNoDataMessageFont(Font font) 没有数据时显示的消息字体void setNoDataMessagePaint(Paint paint) 没有数据时显示的消息颜色CategoryPlot(Plot)类:void setDataset(CategoryDataset dataset) 数据区的2维数据表void setColumnRenderingOrder(SortOrder order) 数据分类的排序方式void setAxisOffset(Spacer offset) 坐标轴到数据区的间距void setOrientation(PlotOrientation orientation) 数据区的方向(PlotOrientation.HORIZONTAL或PlotOrientation.VERTICAL)void setDomainAxis(CategoryAxis axis) 数据区的分类轴void setDomainAxisLocation(AxisLocation location) 分类轴的位置(参数常量在org.jfree.chart.axis.AxisLocation类中定义)void setDomainGridlinesVisible(boolean visible) 分类轴网格是否可见void setDomainGridlinePaint(Paint paint) 分类轴网格线条颜色void setDomainGridlineStroke(Stroke stroke) 分类轴网格线条笔触void setRangeAxis(ValueAxis axis) 数据区的数据轴void setRangeAxisLocation(AxisLocation location) 数据轴的位置(参数常量在org.jfree.chart.axis.AxisLocation类中定义)void setRangeGridlinesVisible(boolean visible) 数据轴网格是否可见void setRangeGridlinePaint(Paint paint) 数据轴网格线条颜色void setRangeGridlineStroke(Stroke stroke) 数据轴网格线条笔触void setRenderer(CategoryItemRenderer renderer) 数据区的表示者(详见Renderer组)void addAnnotation(CategoryAnnotation annotation) 给数据区加一个注释void addRangeMarker(Marker marker,Layer layer) 给数据区加一个数值范围区域PiePlot(Plot)类:void setDataset(PieDataset dataset) 数据区的1维数据表void setIgnoreNullValues(boolean flag) 忽略无值的分类void setCircular(boolean flag) 饼图是否一定是正圆void setStartAngle(double angle) 饼图的初始角度void setDirection(Rotation direction) 饼图的旋转方向void setExplodePercent(int section,double percent) 抽取的那块(1维数据表的分类下标)以及抽取出来的距离(0.0~1.0),3D饼图无效void setLabelBackgroundPaint(Paint paint) 分类标签的底色void setLabelFont(Font font) 分类标签的字体void setLabelPaint(Paint paint) 分类标签的字体颜色void setLabelLinkMargin(double margin) 分类标签与图的连接线边距void setLabelLinkPaint(Paint paint) 分类标签与图的连接线颜色void setLabelLinkStroke(Stroke stroke) 分类标签与图的连接线笔触void setLabelOutlinePaint(Paint paint) 分类标签边框颜色void setLabelOutlineStroke(Paint paint) 分类标签边框笔触void setLabelShadowPaint(Paint paint) 分类标签阴影颜色void setMaximumLabelWidth(double width) 分类标签的最大长度(0.0~1.0)void setPieIndex(int index) 饼图的索引(复合饼图中用到)void setSectionOutlinePaint(int section,Paint paint) 指定分类饼的边框颜色void setSectionOutlineStroke(int section,Stroke stroke) 指定分类饼的边框笔触void setSectionPaint(int section,Paint paint) 指定分类饼的颜色void setShadowPaint(Paint paint) 饼图的阴影颜色void setShadowXOffset(double offset) 饼图的阴影相对图的水平偏移void setShadowYOffset(double offset) 饼图的阴影相对图的垂直偏移void setLabelGenerator(PieSectionLabelGenerator generator) 分类标签的格式,设置成null则整个标签包括连接线都不显示void setToolTipGenerator(PieToolTipGenerator generator) MAP中鼠标移上的显示格式void setURLGenerator(PieURLGenerator generator) MAP中钻取链接格式PiePlot3D(PiePlot)类:void setDepthFactor(double factor) 3D饼图的Z轴高度(0.0~1.0)MultiplePiePlot(Plot)类:void setLimit(double limit) 每个饼图之间的数据关联(详细比较复杂)void setPieChart(JFreeChart pieChart) 每个饼图的显示方式(见JFreeChart类个PiePlot类)-----------------------------------------------------------------------------------------------------------AbstractRenderer类:void setItemLabelAnchorOffset(double offset) 数据标签的与数据点的偏移void setItemLabelsVisible(boolean visible) 数据标签是否可见void setItemLabelFont(Font font) 数据标签的字体void setItemLabelPaint(Paint paint) 数据标签的字体颜色void setItemLabelPosition(ItemLabelPosition position) 数据标签位置void setPositiveItemLabelPosition(ItemLabelPosition position) 正数标签位置void setNegativeItemLabelPosition(ItemLabelPosition position) 负数标签位置void setOutLinePaint(Paint paint) 图形边框的线条颜色void setOutLineStroke(Stroke stroke) 图形边框的线条笔触void setPaint(Paint paint) 所有分类图形的颜色void setShape(Shape shape) 所有分类图形的形状(如折线图的点)void setStroke(Stroke stroke) 所有分类图形的笔触(如折线图的线)void setSeriesItemLabelsVisible(int series,boolean visible) 指定分类的数据标签是否可见void setSeriesItemLabelFont(int series,Font font) 指定分类的数据标签的字体void setSeriesItemLabelPaint(int series,Paint paint) 指定分类的数据标签的字体颜色void setSeriesItemLabelPosition(int series,ItemLabelPosition position) 数据标签位置void setSeriesPositiveItemLabelPosition(int series,ItemLabelPosition position) 正数标签位置void setSeriesNegativeItemLabelPosition(int series,ItemLabelPosition position) 负数标签位置void setSeriesOutLinePaint(int series,Paint paint) 指定分类的图形边框的线条颜色void setSeriesOutLineStroke(int series,Stroke stroke) 指定分类的图形边框的线条笔触void setSeriesPaint(int series,Paint paint) 指定分类图形的颜色void setSeriesShape(int series,Shape shape) 指定分类图形的形状(如折线图的点)void setSeriesStroke(int series,Stroke stroke) 指定分类图形的笔触(如折线图的线)AbstractCategoryItemRenderer(AbstractRenderer)类:void setLabelGenerator(CategoryLabelGenerator generator) 数据标签的格式void setToolTipGenerator(CategoryToolTipGenerator generator) MAP中鼠标移上的显示格式void setItemURLGenerator(CategoryURLGenerator generator) MAP中钻取链接格式void setSeriesLabelGenerator(int series,CategoryLabelGenerator generator) 指定分类的数据标签的格式void setSeriesToolTipGenerator(int series,CategoryToolTipGenerator generator) 指定分类的MAP中鼠标移上的显示格式void setSeriesItemURLGenerator(int series,CategoryURLGenerator generator) 指定分类的MAP中钻取链接格式BarRenderer(AbstractCategoryItemRenderer)类:void setDrawBarOutline(boolean draw) 是否画图形边框void setItemMargin(double percent) 每个BAR之间的间隔void setMaxBarWidth(double percent) 每个BAR的最大宽度void setMinimumBarLength(double min) 最短的BAR长度,避免数值太小而显示不出void setPositiveItemLabelPositionFallback(ItemLabelPosition position) 无法在BAR中显示的正数标签位置void setNegativeItemLabelPositionFallback(ItemLabelPosition position) 无法在BAR中显示的负数标签位置BarRenderer3D(BarRenderer)类:void setWallPaint(Paint paint) 3D坐标轴的墙体颜色StackedBarRenderer(BarRenderer)类:没有特殊的设置StackedBarRenderer3D(BarRenderer3D)类:没有特殊的设置GroupedStackedBarRenderer(StackedBarRenderer)类:void setSeriesToGroupMap(KeyToGroupMap map) 将分类自由的映射成若干个组(KeyToGroupMap.mapKeyToGroup(series,group))LayeredBarRenderer(BarRenderer)类:void setSeriesBarWidth(int series,double width) 设定每个分类的宽度(注意设置不要使某分类被覆盖)WaterfallBarRenderer(BarRenderer)类:void setFirstBarPaint(Paint paint) 第一个柱图的颜色void setLastBarPaint(Paint paint) 最后一个柱图的颜色void setPositiveBarPaint(Paint paint) 正值柱图的颜色void setNegativeBarPaint(Paint paint) 负值柱图的颜色IntervalBarRenderer(BarRenderer)类:需要传IntervalCategoryDataset作为数据源GanttBarRenderer(IntervalBarRenderer)类:void setCompletePaint(Paint paint) 完成进度颜色void setIncompletePaint(Paint paint) 未完成进度颜色void setStartPercent(double percent) 设置进度条在整条中的起始位置(0.0~1.0)void setEndPercent(double percent) 设置进度条在整条中的结束位置(0.0~1.0)StatisticBarRenderer(BarRenderer)类:需要传StatisticCategoryDataset作为数据源LineAndShapeRenderer(AbstractCategoryItemRenderer)类:void setDrawLines(boolean draw) 是否折线的数据点之间用线连void setDrawShapes(boolean draw) 是否折线的数据点根据分类使用不同的形状void setShapesFilled(boolean filled) 所有分类是否填充数据点图形void setSeriesShapesFilled(int series,boolean filled) 指定分类是否填充数据点图形void setUseFillPaintForShapeOutline(boolean use) 指定是否填充数据点的Paint也被用于画数据点形状的边框LevelRenderer(AbstractCategoryItemRenderer)类:void setItemMargin(double percent) 每个分类之间的间隔void setMaxItemWidth(double percent) 每个分类的最大宽度CategoryStepRenderer(AbstractCategoryItemRenderer)类:void setStagger(boolean shouldStagger) 不同分类的图是否交错MinMaxCategoryRenderer(AbstractCategoryItemRenderer)类:void setDrawLines(boolean drawLines) 是否在每个分类线间画连接线void setGroupPaint(Paint groupPaint) 一组图形连接线的颜色void setGroupStroke(Stroke groupStroke) 一组图形连接线的笔触void setMaxIcon(Icon maxIcon) 最大值的ICONvoid setMinIcon(Icon minIcon) 最小值的ICONvoid setObjectIcon(Icon objectIcon) 所有值的ICONAreaRender(AbstractCategoryItemRenderer)类:没有特殊的设置StackedAreaRender(AreaRender)类:没有特殊的设置。