数据结构说明书
数据结构说明书
p = Stack[top];
top--;
p = p -> RChild;
}
}
}
//用栈实现中序遍历
void InOrderTree(BiTree root)
{
int top = -1;
BiTNode* Stack[MAX_STACK_SIZE]={NULL};
BiTNode* p;
p = root;
遍历是二叉树上最重要的运算之一,是二叉树上进行其它运算之基础。
2.2遍历方案
2.2.1
从二叉树的递归定义可知,一棵非空的二叉树由根结点及左、右子树这三个基本部分组成。因此,在任一给定结点上,可以按某种次序执行三个操作:
(1)访问结点本身(N),
(2)遍历该结点的左子树(L),
(3)遍历该结点的右子树(R)。
③LRN:后序遍历(PostOrderTree l)
——访问结点的操作发生在遍历其左右子树之后。
2.3
2.3.1
二叉树的每个结点最多有两个孩子。用链接方式存储二叉树时,每个结点除了存储结点本身的数据外,还应设置两个指针域lchild和rchild,分别指向该结点的左孩子和右孩子。结点的结构为:
图1链式存储结点结构
{
printf("%c ", p -> data);
q = p;
top--;
p = NULL;
}
else
{
p = p -> RChild;
以上三种操作有六种执行次序:
NLR、LNR、LRN、NRL、RNL、RLN。
2.2.2
根据访问结点操作发生位置命名:
①NLR:前序遍历(亦称(PreOrderTree先序遍历))
数据结构设计说明书

[键入公司名称]设计说明书航空订票系统软件***班***2018/1/9[在此处键入文档摘要。
摘要通常为文档内容的简短概括。
在此处键入文档摘要。
摘要通常为文档内容的简短概括。
]设计说明书设计说明书 (1)1.程序系统的结构 (2)2.程序1 (标识符)设计说明 (2)1)程序描述 (2)2)功能 (2)3)性能 (2)4)输入项 (2)5)输出项 (2)6)算法 (3)7)流程逻辑 (3)8)接口 (3)9)存储分配 (3)10)注释设计 (3)11)限制条件 (3)12)测试计划 (3)13)尚未解决的问题 (3)3.程序2 (标识符)设计说明 (4)1 .程序系统的结构用一系列图表列出本程序系统内的每个程序(包括每个模块和子程序)的名称、标识符和它们之间的层次结构关系。
实现的功能:2.程序1 (标识符)设计说明从本节开始,逐个地给出各个层次中的每个程序的设计考虑。
以下给出的提纲是针对一般情况的。
对于一个具体的模块,尤其是层次比较低的模块或子程序,其很多条目的内容往往与它所隶属的上一层模块的对应条目的内容相同,在这种情况下,只要简单地说明这一点即可。
1)程序描述给出对该程序的简要描述,主要说明安排设计本程序的目的意义,并且,还要说明本程序的特点(如是否有返回值?等)。
2)功能说明该程序应具有的功能,可采用输入一处理一输出的形式。
3)性能说明对该程序的全部性能要求,包括对精度、灵活性和时间特性的要求。
4)输入项给出对每一个输入项的特性,包括名称、标识、数据的类型和格式、数据值的有效范围、输入的方式。
数量和频度、输入媒体(例如键盘,文件等、输入数据的来源和安全保密条住笺笺件等等。
5)输出项给出对每一个输出项的特性,包括名称、标识、数据的类型和格式,数据值的有效范围,输出的形式、数量和频度,输出(例如显示器,文件等、对输出图形及符号的说明、安全保密条件等等。
6)算法详细说明本程序所选用的算法,具体的计算公式和计算步骤。
数据结构课程设计说明书

车厢调度问题摘要:实现栈的基本操作,即实现类型。
程序对栈的任何存取,即更改,读取和状态判别等操作,必须借助于基本操作。
在操作过程中的任何状态下都有两种可能的操作:“入”“出”。
每个状态下处理问题的方法都是相同的,具有递归特性。
关键字:栈递归打印0.引言《数据结构》是计算机科学与技术、软件工程及相关学科的专业基础课,也是软件设计的技术基础。
《数据结构》课程的教学要求之一是训练学生进行复杂的程序设计的技能和培养良好程序设计的风格,其重要程度决不亚于理论知识的传授,因此课程设计环节是一个至关重要的环节,是训练学生从事工程科技的基本能力,是培养创新意识和创新能力的极为重要的环节。
基本要求如下:(1) 熟练掌握基本的数据结构;(2) 熟练掌握各种算法;(3) 运用高级语言编写质量高、风格好的应用程序。
1.需求分析(1)这个实验要求我用栈实现车厢调度.(2)车厢的个数是由用户输入的.(3)程序会自动给车厢进行从1到 n的编号.(4)用户输入车厢个数后,程序打印出所有可能的车厢出站顺序.2.数据结构设计在这个程序中存储结构是栈,对于栈的声明和定义如下:typedef struct SqStack{int *top; /*栈顶指针*/int *base;/*在栈构造之前和销毁之后.base的值为NULL*/int stacksize; /*当前分配的存储空间*/}SqStack; /*顺序栈的结构体声明和定义*/3.算法设计3.1 对算法的简单描述这个实验中, 要求用到栈. 实现栈的基本操作,即实现类型。
程序对栈的任何存取(即更改,读取和状态判别等操作)必须借助于基本操作。
在操作过程中的任何状态下都有两种可能的操作:“入”“出”。
每个状态下处理问题的方法都是相同的,具有递归特性。
栈实现是方便的无论如何调度,我们的操作都是入栈和出栈,设定入栈为1,出栈为-1,对n列车厢有2n次这样的操作,例如n=4,则有操作1111-1-1-1-1、1-11-11-11-1等.所以还要构造一个操作命令队列trainlist[]。
Umatrix高维数据结构可视化工具说明书
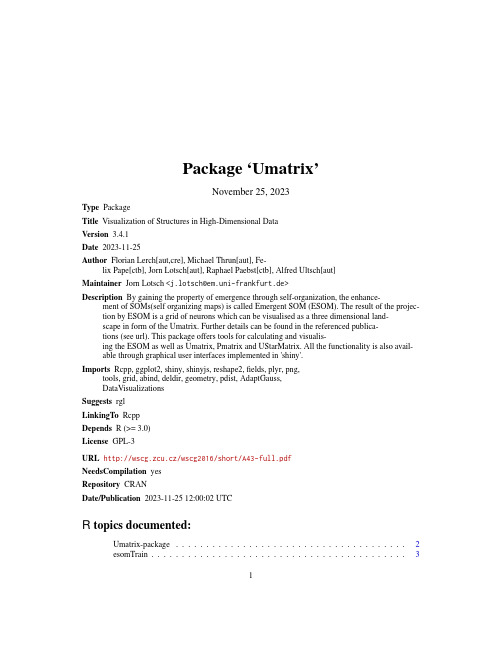
Package‘Umatrix’November25,2023Type PackageTitle Visualization of Structures in High-Dimensional DataVersion3.4.1Date2023-11-25Author Florian Lerch[aut,cre],Michael Thrun[aut],Fe-lix Pape[ctb],Jorn Lotsch[aut],Raphael Paebst[ctb],Alfred Ultsch[aut]Maintainer Jorn Lotsch<*************************.de>Description By gaining the property of emergence through self-organization,the enhance-ment of SOMs(self organizing maps)is called Emergent SOM(ESOM).The result of the projec-tion by ESOM is a grid of neurons which can be visualised as a three dimensional land-scape in form of the Umatrix.Further details can be found in the referenced publica-tions(see url).This package offers tools for calculating and visualis-ing the ESOM as well as Umatrix,Pmatrix and UStarMatrix.All the functionality is also avail-able through graphical user interfaces implemented in'shiny'.Imports Rcpp,ggplot2,shiny,shinyjs,reshape2,fields,plyr,png,tools,grid,abind,deldir,geometry,pdist,AdaptGauss,DataVisualizationsSuggests rglLinkingTo RcppDepends R(>=3.0)License GPL-3URL http://wscg.zcu.cz/wscg2016/short/A43-full.pdfNeedsCompilation yesRepository CRANDate/Publication2023-11-2512:00:02UTCR topics documented:Umatrix-package (2)esomTrain (3)12Umatrix-package Hepta (4)iClassification (5)iEsomTrain (6)iUmapIsland (7)iUstarmatrix (7)plotMatrix (8)pmatrixForEsom (10)showMatrix3D (11)umatrixForEsom (12)ustarmatrixCalc (12)Index14 Umatrix-package Umatrix-packageDescriptionThe ESOM(emergent self organizing map)is an improvement of the regular SOM(self organizing map)which allows for toroid grids of neurons and is intended to be used in combination with the Umatrix.The set of neurons is referred to as weights within this package,as they represent the values within the high dimensional space.The neuron with smallest distance to a datapoint is calleda Bestmatch and can be considered as projection of said datapoint.As the Umatrix is usually toroid,it is drawn four consecutive times to remove border effects.An island,or Imx,is afilter mask,which cuts out a subset of the Umatrix,which shows every point only a single time while avoiding border effects cutting through potential clusters.Finally the Pmatrix shows the density structures within the grid,by a set radius.It can be combined with the Umatrix resulting in the UStarMatrix,which is therefore a combination of density based structures as well as clearly divided ones. ReferencesUltsch,A.:Data mining and knowledge discovery with emergent self-organizing feature maps for multivariate time series,In Oja,E.&Kaski,S.(Eds.),Kohonen maps,(1ed.,pp.33-46),Elsevier, 1999.Ultsch,A.:Maps for the visualization of high-dimensional data spaces,Proc.Workshop on Self organizing Maps(WSOM),pp.225-230,Kyushu,Japan,2003.Ultsch,A.:U*C:Self-organized Clustering with Emergent Feature Maps,Lernen,Wissensent-deckung und Adaptivitaet(LWA),pp.240-244,Saarbruecken,Germany,2005.Loetsch,J.,Ultsch,A.:Exploiting the Structures of the U-Matrix,in Villmann,T.,Schleif,F.-M., Kaden,M.&Lange,M.(eds.),Proc.Advances in Self-Organizing Maps and Learning Vector Quantization,pp.249-257,Springer International Publishing,Mittweida,Germany,2014.Ultsch,A.,Behnisch,M.,Loetsch,J.:ESOM Visualizations for Quality Assessment in Clustering, In Merenyi,E.,Mendenhall,J.M.&O’Driscoll,P.(Eds.),Advances in Self-Organizing Maps and Learning Vector Quantization:Proceedings of the11th International Workshop WSOM2016,pp.39-48,Houston,Texas,USA,January6-8,2016,(10.1007/978-3-319-28518-4_3),Cham,Springer International Publishing,2016.esomTrain3 Thrun,M.C.,Lerch,F.,Loetsch,J.,Ultsch,A.:Visualization and3D Printing of Multivariate Data of Biomarkers,in Skala,V.(Ed.),International Conference in Central Europe on Computer Graphics,Visualization and Computer Vision,Plzen,2016.esomTrain Train an ESOM(emergent self organizing map)and project dataDescriptionThe ESOM(emergent self organizing map)algorithm as defined by[Ultsch1999].A set of weigths(neurons)on a two-dimensional grid get trained to adapt the given datastructure.The weights will be used to project data on a two-dimensional space,by seeking the BestMatches for every datapoint.ArgumentsData Data that will be used for training and projectionLines Height of gridColumns Width of gridEpochs Number of Epochs the ESOM will runToroid If TRUE,the grid will be toroidNeighbourhoodFunctionType of Neighbourhood;Possible values are:"cone","mexicanhat"and"gauss"StartLearningRateInitial value for LearningRateEndLearningRateFinal value for LearningRateStartRadius Start value for the Radius in which will be searched for neighboursEndRadius End value for the Radius in which will be searched for neighboursNeighbourhoodCoolingCooling method for radius;"linear"is the only available option at the moment LearningRateCoolingCooling method for LearningRate;"linear"is the only available option at themomentshinyProgress Generate progress output for shiny if Progress Object is givenShiftToHighestDensityIf True,the Umatrix will be shifted so that the point with highest density will beat the centerInitMethod name of the method that will be used to choose initializations Valid Inputs: "uni_min_max":uniform distribution with minimum and maximum from sam-pleData"norm_mean_2std":normal distribuation based on mean and standarddeviation of sampleDataKey Vector of numeric keys matching the datapoints.Will be added to Bestmatches UmatrixForEsom If TRUE,Umatrix based on resulting ESOM is calculated and returned4HeptaDetailsOn a toroid grid,opposing borders are connected.ValueList withBestMatches BestMatches of datapointsWeights Trained weightsLines Height of gridColumns Width of gridToroid TRUE if grid is a toroidReferencesKohonen,T.,Self-organized formation of topologically correct feature maps.Biological cybernet-ics,1982.43(1):p.59-69.Ultsch,A.,Data mining and knowledge discovery with emergent self-organizing feature maps for multivariate time series.Kohonen maps,1999.46:p.33-46.Examplesdata( Hepta )res=esomTrain(Hepta$Data,Key=1:nrow(Hepta$Data))Hepta Hepta from FCPS(Fundamental Clustering Problem Suite)DescriptionDataset with7easily seperable classes.Usagedata("Hepta")DetailsSize212,Dimensions3,stored in Hepta$DataClasses7,stored in Hepta$ClsReferencesUltsch,A.:U*C:Self-organized Clustering with Emergent Feature Maps,Lernen,Wissensent-deckung und Adaptivitaet(LW A),pp.240-244,Saarbruecken,Germany,2005.iClassification5 Examplesdata(Hepta)str(Hepta)iClassification GUI for manual classificationDescriptionThis tool is a’shiny’GUI that visualizes a given Umatrix and allows the user to select areas and mark them as clusters.ArgumentsUmatrix Matrix of Umatrix HeightsBestMatches Array with positions of BestmatchesCls Classification of the BestmatchesImx Matrix of an island that will be cut out of the UmatrixToroid Are BestMatches placed on a toroid grid?TRUE by defaultValueA vector containing the selected class ids.The order is corresponding to the given BestmatchesReferencesThrun,M.C.,Lerch,F.,Loetsch,J.,Ultsch,A.:Visualization and3D Printing of Multivariate Data of Biomarkers,in Skala,V.(Ed.),International Conference in Central Europe on Computer Graphics,Visualization and Computer Vision,Plzen,2016.Examples##Not run:data("Hepta")e=esomTrain(Hepta$Data,Key=1:nrow(Hepta$Data))cls=iClassification(e$Umatrix,e$BestMatches)##End(Not run)6iEsomTrain iEsomTrain iEsomTrainDescriptionTrains the ESOM and shows the Umatrix.ArgumentsData Matrix of Data that will be used to learn.One DataPoint per rowBestMatches Array with positions of BestmatchesCls Classification of the Bestmatches as a vectorKey Numeric vector of keys matching the BestmatchesToroid Are BestMatches placed on a toroid grid?TRUE by defaultValueList withUmatrix matrix with height values of the umatrixBestMatches matrix containing the bestmatchesLines number of lines of the chosen ESOMColumns number of columns of the chosen ESOMEpochs number of epochs of the chosen ESOMWeights List of weightsToroid True if a toroid grid was usedEsomDetails Further details describing the chosen ESOM parametersReferencesThrun,M.C.,Lerch,F.,Loetsch,J.,Ultsch,A.:Visualization and3D Printing of Multivariate Data of Biomarkers,in Skala,V.(Ed.),International Conference in Central Europe on Computer Graphics,Visualization and Computer Vision,Plzen,2016.iUmapIsland7 iUmapIsland iUmapIslandDescriptionThe toroid Umatrix is usually drawn4times,so that connected areas on borders can be seen asa whole.An island is a manual cutout of such a tiled visualization,that is selected such that allconnected areas stay intact.This’shiny’tool allows the user to do this manually.ArgumentsUmatrix Matrix of Umatrix HeightsBestMatches Array with positions of BestMatchesCls Classification of the BestMatchesValueBoolean Matrix that represents the island within the tiled UmatrixReferencesThrun,M.C.,Lerch,F.,Loetsch,J.,Ultsch,A.:Visualization and3D Printing of Multivariate Data of Biomarkers,in Skala,V.(Ed.),International Conference in Central Europe on Computer Graphics,Visualization and Computer Vision,Plzen,2016.Examples##Not run:data("Hepta")e=esomTrain(Hepta$Data,Key=1:nrow(Hepta$Data))Imx=iUmapIsland(e$Umatrix,e$BestMatches)plotMatrix(e$Umatrix,e$BestMatches,Imx=Imx$Imx)##End(Not run)iUstarmatrix iUstarmatrixDescriptionCalculates the Ustarmatrix by combining a Umatrix with a Pmatrix.ArgumentsWeights Weights that were trained by the ESOM algorithmLines Height of the used gridColumns Width of the used gridData Matrix of Data that was used to train the ESOM.One datapoint per rowImx Island mask that will be cut out from displayed UmatrixCls Classification of the BestmatchesToroid Are weights placed on a toroid grid?ValueUstarmatrix matrix with height values of the UstarmatrixReferencesThrun,M.C.,Lerch,F.,Loetsch,J.,Ultsch,A.:Visualization and3D Printing of Multivariate Data of Biomarkers,in Skala,V.(Ed.),International Conference in Central Europe on Computer Graphics,Visualization and Computer Vision,Plzen,2016.plotMatrix plotMatrixDescriptionDraws a plot based of given Umatrix or Pmatrix.ArgumentsMatrix Umatrix or Pmatrix to be plottedBestMatches Positions of BestmMtches to be plotted onto the UmatrixCls Class identifier for the BestMatchesClsColors Vector of colors that will be used to colorize the different classesColorStyle If"Umatrix"the colors of a Umatrix(Blue->Green->Brown->White)will be used;If"Pmatrix"the colors of a Pmatrix(White->Yellow->Red)will beusedToroid Should the Umatrix be drawn4times?BmSize Integer between0.1and5,magnification factor of the drawn BestMatch circles DrawLegend If TRUE,a color legend will be drawn next to the plotFixedRatio If TRUE,the plot will be drawn with afixed ratio of x and y axisCutoutPol Only draws the area within given polygonNrlevels Number of height levels that will be used within the UmatrixTransparentContoursUse half transparent contours.Looks better but is slowImx Mask to cut out an island.Every value should be either1(stays in)or0(gets cut out)Clean If TRUE axis,margins,...surrounding the Umatrix image will be removed RemoveOcean If TRUE,the surrounding blue area around an island will be reduced as much as possible(while still maintaining a rectangular form)TransparentOceanIf TRUE,the surrounding blue area around an island will be transparent Title A title that will be drawn above the plotBestMatchesLabelsVector of strings corresponding to the order of BestMatches which will be drawnon the plot as labelsBestMatchesShapeNumeric value of Shape that will be used.Responds to the usual shapes ofggplotMarkDuplicatedBestMatchesIf TRUE,BestMatches that are shown more than once within an island,will bemarkedYellowCircle If TRUE,a yellow circle is drawn around Bestmatches to distinct them better from backgroundDetailsThe heightScale(nrlevels)is set at the proportion of the1percent quantile against the99percent quantile of the matrix values.ValueA’ggplot’of a MatrixReferencesThrun,M.C.,Lerch,F.,Loetsch,J.,Ultsch,A.:Visualization and3D Printing of Multivariate Data of Biomarkers,in Skala,V.(Ed.),International Conference in Central Europe on Computer Graphics,Visualization and Computer Vision,Plzen,2016.Ultsch,A.:Maps for the visualization of high-dimensional data spaces,Proc.Workshop on Self organizing Maps(WSOM),pp.225-230,Kyushu,Japan,2003.Siemon,H.P.,Ultsch,A.:Kohonen Networks on Transputers:Implementation and Animation,in: Proceedings Intern.Neural Networks,Kluwer Academic Press,Paris,pp.643-646,1990.Examplesdata("Hepta")e=esomTrain(Hepta$Data,Key=1:nrow(Hepta$Data))plotMatrix(e$Umatrix,e$BestMatches)10pmatrixForEsom pmatrixForEsom pmatrixForEsomDescriptionGenerates a Pmatrix based on the weights of an ESOM.ArgumentsData A[n,k]matrix containing the dataWeights Weights stored as a list in a2D matrixLines Number of lines of the SOM that is described by weightsColumns Number of columns of the SOM that is described by weightsRadius The radius for measuring the density within the hyperspherePlotIt If set the Pmatrix will also be plottedToroid Are BestMatches placed on a toroid grid?TRUE by defaultValueUstarMatrixReferencesUltsch,A.:Maps for the visualization of high-dimensional data spaces,Proc.Workshop on Self organizing Maps(WSOM),pp.225-230,Kyushu,Japan,2003.Ultsch,A.,Loetsch,J.:Computed ABC Analysis for Rational Selection of Most Informative Vari-ables in Multivariate Data,PloS one,V ol.10(6),pp.e0129767.doi10.1371/journal.pone.0129767, 2015.Thrun,M.C.,Lerch,F.,Loetsch,J.,Ultsch,A.:Visualization and3D Printing of Multivariate Data of Biomarkers,in Skala,V.(Ed.),International Conference in Central Europe on Computer Graphics,Visualization and Computer Vision,Plzen,2016.Examplesdata("Hepta")e=esomTrain(Hepta$Data,Key=1:nrow(Hepta$Data))Pmatrix=pmatrixForEsom(Hepta$Data,e$Weights,e$Lines,e$Columns,e$Toroid)plotMatrix(Pmatrix,ColorStyle="Pmatrix")showMatrix3D11 showMatrix3D showMatrix3DDescriptionVisualizes the matrix(Umatrix/Pmatrix)in an interactive window in3D.ArgumentsMatrix Matrix to be plottedBestMatches Positions of BestMatches to be plotted onto the matrixCls Class identifier for the BestMatch at the given pointImx a mask(island)that will be used to cut out the UmatrixToroid Should the Matrix be drawn4times(in a toroid view)HeightScale Optional.Scaling Factor for Mountain HeightBmSize Size of drawn BestMatchesRemoveOcean Remove as much area sourrounding an island as possibleColorStyle Either"Umatrix"or"Pmatrix"respectevily for their colorsShowAxis Draw an axis arround the drawn matrixSmoothSlope Try to increase the island size,to get smooth slopes around the islandClsColors Vector of colors that will be used for classesFileName Name for a stlfile to write the Matrix toDetailsThe heightScale is set at the proportion of the1percent quantile against the99percent quantile of the Matrix values.ReferencesThrun,M.C.,Lerch,F.,Loetsch,J.,Ultsch,A.:Visualization and3D Printing of Multivariate Data of Biomarkers,in Skala,V.(Ed.),International Conference in Central Europe on Computer Graphics,Visualization and Computer Vision,Plzen,2016.Examples##Not run:data("Hepta")e=esomTrain(Hepta$Data,Key=1:nrow(Hepta$Data))showMatrix3D(e$Umatrix)##End(Not run)umatrixForEsom umatrixForEsomDescriptionCalculate the Umatrix for given ESOM projectionArgumentsWeights Weights from which the Umatrix will be calculatedLines Number of lines of the SOM that is described by weightsColumns Number of columns of the SOM that is described by weightsToroid Boolean describing if the neural grid should be borderlessValueUmatrixReferencesUltsch,A.and H.P.Siemon,Kohonen’s Self Organizing Feature Maps for Exploratory Data Anal-ysis.1990.Examplesdata("Hepta")e=esomTrain(Hepta$Data,Key=1:nrow(Hepta$Data))umatrix=umatrixForEsom(e$Weights,Lines=e$Lines,Columns=e$Columns,Toroid=e$Toroid)plotMatrix(umatrix,e$BestMatches)ustarmatrixCalc ustarmatrixCalcDescriptionThe UStarMatrix is a combination of the Umatrix(average distance to neighbours)and Pmatrix (density in a point).It can be used to improve the Umatrix,if the dataset contains density based structures.ArgumentsUmatrix A given UmatrixPmatrix A density matrixValueUStarMatrixReferencesUltsch,A.U*C:Self-organized Clustering with Emergent Feature Maps.in Lernen,Wissensent-deckung und Adaptivitaet(LW A).2005.Saarbruecken,Germany.Examplesdata("Hepta")e=esomTrain(Hepta$Data,Key=1:nrow(Hepta$Data))Pmatrix=pmatrixForEsom(Hepta$Data,e$Weights,e$Lines,e$Columns,e$Toroid)Ustarmatrix=ustarmatrixCalc(e$Umatrix,Pmatrix)plotMatrix(Ustarmatrix,e$BestMatches)Index∗ESOMesomTrain,3Umatrix-package,2∗High-Dimensional Data Umatrix-package,2∗High-dimensionalUmatrix-package,2∗HighdimensionalUmatrix-package,2∗P-MatrixpmatrixForEsom,10∗P-matrixpmatrixForEsom,10∗PmatrixpmatrixForEsom,10∗ProjectionUmatrix-package,2∗SOMesomTrain,3Umatrix-package,2∗U*-MatrixustarmatrixCalc,12∗U*-matrixustarmatrixCalc,12∗U*matrixustarmatrixCalc,12∗U-MatrixUmatrix-package,2umatrixForEsom,12∗U-matrixumatrixForEsom,12∗UmatrixUmatrix-package,2umatrixForEsom,12∗Ustar-MatrixustarmatrixCalc,12∗Ustar-matrixustarmatrixCalc,12∗UstarmatrixustarmatrixCalc,12∗VisualizationUmatrix-package,2∗datasets Hepta FCPSHepta,4∗esomesomTrain,3∗self organizing mapesomTrain,3∗somesomTrain,3esomTrain,3Hepta,4iClassification,5iEsomTrain,6iUmapIsland,7iUstarmatrix,7plotMatrix,8pmatrixForEsom,10showMatrix3D,11Umatrix-package,2umatrixForEsom,12ustarmatrixCalc,1214。
(完整word版)数据结构图书管理系统

数据结构课程设计说明书年月日1设计目的(小标题黑体五号字)设计一个计算机管理系统完成图书管理基本业务(数据可以存储在一个数据文件中,数据结构、具体数据自定)。
2.设计内容和要求具体功能有:1)每种书的登记内容包括书号、书名、著作者、出版单位、现存量和库存量;2)对书号建立索引表(线性表)以提高查找效率;3)采编入库:新购一种书,确定书号后,登记到图书帐目表中,如果表中已有,则只将库存量增加;4)借阅:如果一种书的现存量大于0,则借出一本,登记借阅者的书证号和归还期限,改变现存量;5)归还:注销对借阅者的登记,改变该书的现存量.3.本设计所采用的数据结构所用数据结构:线性表、查找、排序链表:用一组地址任意的存储单元存放线性表中的数据元素.以元素(数据元素的映象) + 指针(指示后继元素存储位置)= 结点(表示数据元素或数据元素的映象)以“结点的序列”表示线性表称作线性链表(单链表)单链表是一种链式存取的结构,为找第i 个数据元素必须先找到第i—1 个数据元素。
因此,查找第i 个数据元素的基本操作为:移动指针,比较j 和i。
(1)malloc(size)在内存的动态存储区申请一个长度为size字节的连续空间.(2)calloc(n,size)在内存的动态存储区申请n个长度为size字节的连续空间,函数返回值为分配空间的首地址.若此函数未被成功执行,函数返回值为0。
(3)free(p)释放由指针p所指向的存储单元,而存储单元的大小是最近一次调用malloc()或calloc()函数时所申请的存储空间。
运用了单链表的插入、删除、排序、修改等一些操作!4.功能模块详细设计4。
1 详细设计思想(一)基本思想:(二)图书信息录入、图书信息的查询、图书信息的排序、图书信息的修改、图书信息的删除、图书的借阅、图书的归还、退出图书管理系统。
(三)程序中的主要函数有:void main()//主函数int CreateListR(LinkList *L)//尾插法建表void LocateElem(LinkList *L) //查询int Sort(LinkList *L) //递增有序排序(直接插入排序法)void Display(LinkList *L) //输出排序结果ModifyList(LinkList *L)//修改int ListDelete(LinkList *L) //删除void Borrow(LinkList *L)//借阅void Return(LinkList *L)//归还4.2 核心代码#include <stdio。
(完整word版)数据结构哈夫曼编码与译码

《数据结构》课程设计说明书题目哈夫曼编码与译码学号1267159206姓名张燕斌指导教师康懿日期2014.01。
02任务书目录第一章需求分析 (5)第二章总体设计 (6)第三章抽象数据类型定义 (7)3。
1 LinkList抽象数据类型的设计 (7)3.2 HuffmanTree抽象数据的设计 (7)第四章详细设计..。
...。
..。
....。
.....。
.。
.。
..。
.。
....。
.。
..。
..。
.。
.。
.。
.。
..。
....。
....。
.。
..。
...。
...。
7第五章测试 (10)第六章总结 (11)附录:程序代码 (12)第一章需求分析哈夫曼编码是一种编码方式,以哈夫曼树—即最优二叉树,带权路径长度最小的二叉树,经常应用于数据压缩。
哈弗曼编码使用一张特殊的编码表将源字符(例如某文件中的一个符号)进行编码。
这张编码表的特殊之处在于,它是根据每一个源字符出现的估算概率而建立起来的(出现概率高的字符使用较短的编码,反之出现概率低的则使用较长的编码,这便使编码之后的字符串的平均期望长度降低,从而达到无损压缩数据的目的)。
赫夫曼编码的应用很广泛,利用赫夫曼树求得的用于通信的二进制编码称为赫夫曼编码。
树中从根到每个叶子都有一条路径,对路径上的各分支约定:指向左子树的分支表示“0”码,指向右子树的分支表示“1”码,取每条路径上的“0”或“1”的序列作为和各个叶子对应的字符的编码,这就是赫夫曼编码。
哈弗曼译码输入字符串可以把它编译成二进制代码,输入二进制代码时可以编译成字符串。
第二章总体设计(1)输入一个字符串用结构体链表存储字符串中出现的不同字符及其出现的次数。
(2)定义赫夫曼数的结点结构体,把不同的字符及其在字符串中出现的次数作为叶子结点的元素及其权值,统计叶子结点的个数n,开辟可以存储2*n个结点的顺序表,来赫夫曼树的各个结点,然后按照一定的规则构造赫夫曼树。
(3)开辟一个可以存储叶子结点元素及指向存储其赫夫曼编码链表的指针的顺序表,然后从叶子结点开始向上访问,是左孩子的把“0”接进链表是右孩子的把“1”接进链表,直到根结点,然后把叶子结点的元素及存储其赫夫曼链表的头指针读入顺序表,直到把所有的叶子结点的元素及指向存储其赫夫曼编码链表的头指针读入顺序表,这样得到的赫夫曼编码是倒序的。
《数据结构》精品课程申报自评说明书

2006年被评为茂名学院先进个人;
二、自评分计算
该指标打85分。
Ⅱ-6 教学条件
一、佐证清单
1、教学大纲
2、实验教学大纲
3、大作业大纲
4、学期授课计划
5、学时授课计划
该课程实验使用的微机均是03年后购置的原装机,实验开出率ቤተ መጻሕፍቲ ባይዱ100%;在校外有茂名市信息中心和茂石化信息中心等2个固定的实习基地;在校内有软件实验室、现代通信实验室等教学基地;实践教学效果好。故该项打优,即95分。
任何节约归根到底是时间的节约。——马克思
Ⅱ-10 图书资料
二、自评分计算
有完善的课程教学大纲,、教学过程认真按大纲执行,其它教学文件(如实验教学大纲、大作业教学大纲)齐全。故该项打95分。
Ⅱ-7 教材建设
一、佐证清单
1、严蔚敏主编,数据结构(c语言),清华大学出版社。
2、严蔚敏主编,数据结构(c语言)习题解答与上机指导,清华大学出版社
故,该项为100分。
Ⅱ-2 学历结构
一、佐证清单
1、 博士:彭志平
2、 在读博士:陈晓龙
3、 硕 士:陈 珂,陈晓龙,李云鹤,柯文德
4、 学 士:陈少波
二、自评分计算
=100分。
Ⅱ-3 重点培养教师
一、佐证清单
彭志平 , 陈小龙:"千百十工程"校级培养对象
3、殷人昆主编,数据结构(面向对象程序设计),清华大学出版社。
4、王红梅主编,数据结构(c++版),清华大学出版社。
5、王红梅主编,数据结构(c++版)习题指导与上机指导,清华大学出版社。
《数据结构课程设计》指导书

《数据结构》课程设计指导书沈阳理工大学.信息学院2013.11.1一.目的与意义软件设计能力对计算机专业的学生是很重要。
通过数据结构的学习,使学生对软件编程能力有一定的提高。
数据结构课程设计是锻炼学生在进一步掌握模块化、结构化程序设计的方法的同时,培养学生运用已学知识分析问题、解决问题及编写实用程序的能力,通过对线性化、层次化、网络化数据结构的了解进一步掌握自然数据的结构方式及组织方式,让学生深入体会存储在计算机中的数据及程序中如何运用数据实现编程。
主要目的如下:1.通过本课程设计使学生对面向对象的设计过程有初的认识,并对面向对象的高能语言的学习打下基础,2.通过不同类型的程序设计使学生进一步掌握数据的几种不同的组织和存储方式,为高级编程做准备,3.为专业课的深入学习和毕业设计打基础二.任务和要求分析每一组题目,按要求完成相应的题目:1.题目参照附录中《数据结构课程设计》题目选题。
2. 要求:1)对相应的题目进行算法设计2)编写源代码3)上机调试4)显示调试结果5)写出实验总结3.课程设计说明书设计完成后,将自己选定的题目按上述要求完成课程设计说明书。
课程设计说明书内容包含:题目、要求、初步设计(可以是流程图、功能模块图)、详细设计、程序代码、测试数据、运行结果、遇到的问题及总结几部分。
三.进度安排设计总学时为2周第一周:查阅资料、小组讨论、进行模块划分写出分析报告,画N-S结构化框图,编写程序清单,上机调试.第二周周四、五:验收(计算机机房),并将课程设计报告交上来.四.考核标准与成绩评定方式成绩评定有如下几项参考:1.初步设计内容的考核:是否有查阅资料能力?是否有设计思想?2.程序编码能力调试能力的考核:程序是否清晰、易读?在技算计上是否可独立完成程序的调试,是否熟练?3.说明书质量的考核:设计结构是否合理?叙述是否正确?方案是否可行?4.答辩:设计结果的调试能力,对自己设计是否熟练?5.出勤率极平时表现的考核:出勤超过2次不到者成绩为不及格。
- 1、下载文档前请自行甄别文档内容的完整性,平台不提供额外的编辑、内容补充、找答案等附加服务。
- 2、"仅部分预览"的文档,不可在线预览部分如存在完整性等问题,可反馈申请退款(可完整预览的文档不适用该条件!)。
- 3、如文档侵犯您的权益,请联系客服反馈,我们会尽快为您处理(人工客服工作时间:9:00-18:30)。
if(top >= MAX_STACK_SIZE)
{
printf("栈溢出!\n");
return;
}
Stack[top] = (BiTree)malloc(sizeof(BiTபைடு நூலகம்ode));
Stack[top] = p;
p = p ->LChild;
}
if(top > -1)
{
p = Stack[top];
遍历是二叉树上最重要的运算之一,是二叉树上进行其它运算之基础。
2.2遍历方案
2.2.1
从二叉树的递归定义可知,一棵非空的二叉树由根结点及左、右子树这三个基本部分组成。因此,在任一给定结点上,可以按某种次序执行三个操作:
(1)访问结点本身(N),
(2)遍历该结点的左子树(L),
(3)遍历该结点的右子树(R)。
图4测试结果
5
通过这次的设计,我学到了很多。本次设计是一个模块划分比较清晰地程序,分别将三种遍历方式(先序、中序、后序遍历)用三个函数写出来,实现了封装性。本次设计所包含的知识面比较广,所以必须要把所学的知识融会贯通才行;当然,程序也有些许不足之处,比如:有一些模块还没有实现;软件的一些细节性问题还是有待进一步完善。细节问题是很多的,只有动手做时才知道自己学的有多么肤浅,应用不当就出错而且错误很费神,理论与实际差距的确很大,要想作出实际实用的东西来还需多多练习,不断改进,充分发挥所学知识,另外也应加强视野的开拓,现学现卖自己拯救,学会搜索有用的信息,这样才能作出满意的东西来。
图2二叉链表存储的二叉树
注意:
①一个二叉链表由根指针root惟一确定。若二叉树为空,则root=NULL;若结点的某个孩子不存在,则相应的指针为空。
②具有n个结点的二叉链表中,共有2n个指针域。其中只有n-1个用来指示结点的左、右孩子,其余的n+1个指针域为空。
//建立二叉树的二叉链表存贮结构
void CreateBiTree(BiTree *bt)
if((NULL == p -> RChild) || (p -> RChild == q))
{printf("%c ", p -> data);
q = p;
top--;
p = NULL;
}
}
printf("\n");
}
3过程论证
否
是
否
是
图3流程图
4
输入先序遍历序列ABC DE G F,即可得到非递归的先序、中序、后序遍历的结果;如下:
{
DataType data;
struct BiNode *LChild;
struct BiNode *RChild;
}BiTNode,*BiTree;
//建立二叉树的二叉链表存贮结构
void CreateBiTree(BiTree *bt)
{
DataType ch;
ch = getchar();
if(ch == ' ')
}
}
2.4
2.4.1
Void PreOrderTree(BiTree root)
{
int top = -1;
BiTNode* Stack[MAX_STACK_SIZE]={NULL};
BiTNode* p;
p = root;
while(p != NULL || top != -1)
{
while(p != NULL)
{
int top = -1;
BiTNode* Stack[MAX_STACK_SIZE]={NULL};
BiTNode* p;
p = root;
while(p != NULL || top != -1)
{
while(p != NULL)
{
if(top > MAX_STACK_SIZE)
{
return;
二叉树是树形结构的一个重要类型。许多实际问题抽象出来的数据结构往往是二叉树的形式,即使是一般的树也能简单地转换为二叉树,而且二叉树的存储结构及其算法都较为简单,因此二叉树显得特别重要。此程序主要实现二叉树的遍历并且是基于栈的非递归遍历方法。
2
2.1遍历概念
所谓遍历(Traversal)是指沿着某条搜索路线,依次对树中每个结点均做一次且仅做一次访问。访问结点所做的操作依赖于具体的应用问题。
}
}
}
2.4.3后序非递归算法
void PostOrderTree(BiTree root)
{
BiTree Stack[MAX_STACK_SIZE] = {NULL};
q = NULL;
p = root;
while(p != NULL || top != -1)
{
while(p != NULL)
{
{
int top = -1;
BiTNode *p, *q;
BiTree Stack[MAX_STACK_SIZE] = {NULL};
q = NULL;
p = root;
while(p != NULL || top != -1)
{
while(p != NULL)
{
top++;
if(top >= MAX_STACK_SIZE)
while(p != NULL || top != -1)
{
while(p != NULL)
{
if(top > MAX_STACK_SIZE)
{
return;
}
top++;
Stack[top] = (BiTNode*)malloc(sizeof(BiTNode));
if(NULL == Stack[top])
{
DataType ch;
ch = getchar();
if(ch == ' ')
{
*bt = NULL;
}
else
{
*bt = (BiTree)malloc(sizeof(BiTNode));
(*bt)->data = ch;
CreateBiTree(&((*bt)->LChild));
CreateBiTree(&((*bt)->RChild));
参考文献
[1]
[2]《数据结构教程(C语言版)》严蔚敏清华大学出版社
附录:源代码
#include <stdio.h>
#include <malloc.h>
#define MAX_STACK_SIZE 50 //栈最大长度
typedef char DataType;
//二叉树数据结构定义
typedef struct BiNode
{
if(top > MAX_STACK_SIZE)
{
return;
}
top++;
Stack[top] = (BiTNode*)malloc(sizeof(BiTNode));
if(NULL == Stack[top])
{
return;
}
Stack[top] = p;
printf("%c ", p->data);
树是一种重要的非线性数据结构,直观地看,它是数据元素(在树中称为结点)按分支关系组织起来的结构,很象自然界中的树那样。树结构在客观世界中广泛存在,如人类社会的族谱和各种社会组织机构都可用树形象表示。树在计算机领域中也得到广泛应用,如在编译源程序如下时,可用树表示源源程序如下的语法结构。又如在数据库系统中,树型结构也是信息的重要组织形式之一。一切具有层次关系的问题都可用树来描述。满二叉树,完全二叉树,排序二叉树。
{
return;
}
Stack[top] = p;
p = p -> LChild;
}
if(NULL == p && top != -1)
{
p = Stack[top];
top--;
printf("%c ", p->data);
p = p -> RChild;
}
}
}
//用栈实现后序遍历
void PostOrderTree(BiTree root)
{
printf("栈溢出!\n");
return;
}
Stack[top] = (BiTree)malloc(sizeof(BiTNode));
Stack[top] = p;
p = p ->LChild;
}
if(top > -1)
{
p = Stack[top];
if((NULL == p -> RChild) || (p -> RChild == q))
{
p = Stack[top];
top--;
p = p -> RChild;
}
}
}
//用栈实现中序遍历
void InOrderTree(BiTree root)
{
int top = -1;
BiTNode* Stack[MAX_STACK_SIZE]={NULL};
BiTNode* p;
p = root;
③LRN:后序遍历(PostOrderTree l)
——访问结点的操作发生在遍历其左右子树之后。
2.3
2.3.1
二叉树的每个结点最多有两个孩子。用链接方式存储二叉树时,每个结点除了存储结点本身的数据外,还应设置两个指针域lchild和rchild,分别指向该结点的左孩子和右孩子。结点的结构为: