mschart控件使用详解
mschart控件如何使鼠标移动到数据标记上时显示相应的内容

mschart控件如何使鼠标移动到数据标记上时显示相应的内容在MouseMove事件中可以得到鼠标的位置,再用TwipsToChartPart方法就可以知道当前位置对应的是Chart的哪个部分。
不过,这个方法的使用不太方便。
你可以使用下面的代码:Private Sub MSChart1_MouseDown(Button As Integer, Shift As Integer, X As Single, Y As Single)Dim whichPart As Integer, whichSeries As IntegerDim whichNumber As IntegerMSChart1.TwipsToChartPart X, Y, whichPart, whichSeries, whichNumber, 0, 0'Debug.Print whichPart, whichSeries, whichNumberLabel1.Caption = X & " " & Y & " " & whichPart & " " & whichSeries & " " & whichNumberEnd Sub你可以在某条曲线上点一下,这时整条曲线被选中,上面的代码输出的whichPart值为VtChPartTypeSeries(5),表示一个序列被选中了,whichSeries表示序列号。
如果你在这条选中的曲线的不是节点的某个位置上点一下,这时某个节点被选中,上面的代码输出的whichPart值为VtChPartTypePoint(7),whichNumber表示是序列中的哪个点,你就可以利用这些信息知道用户选择了哪个数据。
但是MSChart的这种方式对用户不是很方便。
c#mschart控件使用方法

c# ms chart 控件使用方法第一个简单的chart:spline// Create new data series and set it's visualattributes Series series = new Series("Spline");series.ChartType = SeriesChartType.Spline;series.BorderWidth = 3;series.ShadowOffset = 2;// Populate new series with dataseries.Points.AddY(67);series.Points.AddY(57);series.Points.AddY(83);series.Points.AddY(23);series.Points.AddY(70);series.Points.AddY(60);series.Points.AddY(90);series.Points.AddY(20);// Add series into the chart's series collectionChart1.Series.Add(series);同时显示2条曲线// Populate series with random dataRandom random = new Random();for (int pointIndex = 0; pointIndex < 10;pointIndex++){Chart1.Series["Series1"].Points.AddY(random.Next(45, 95));Chart1.Series["Series2"].Points.AddY(random.Next(5, 75));}// Set series chart typeChart1.Series["Series1"].ChartType = SeriesChartType.Line;Chart1.Series["Series2"].ChartType = SeriesChartType.Spline;// Set point labelsChart1.Series["Series1"].IsValueShownAsLabel = true;Chart1.Series["Series2"].IsValueShownAsLabel = true;// Enable X axis marginChart1.ChartAreas["ChartArea1"].AxisX.IsMarginVisible = true;// Enable 3D, and show data point marker linesChart1.ChartAreas["ChartArea1"].Area3DStyle.Enable3D = true; Chart1.Series["Series1"]["ShowMarkerLines"] = "True";Chart1.Series["Series2"]["ShowMarkerLines"] = "True";显示column类型图// Create new data series and set it's visual attributesSeries series = new Series("FlowRead");series.ChartType = SeriesChartType.Column;series.BorderWidth = 3;series.ShadowOffset = 2;// Populate new series with dataseries.Points.AddY(67);series.Points.AddY(57);series.Points.AddY(83);series.Points.AddY(23);series.Points.AddY(70);series.Points.AddY(60);series.Points.AddY(90);series.Points.AddY(20);// Add series into the chart's series collectionChart1.Series.Add(series);很多点,效率还可以// Fill series datadouble yValue = 50.0;Random random = new Random();for (int pointIndex = 0; pointIndex < 20000;pointIndex++){yValue = yValue + (random.NextDouble() * 10.0 - 5.0);Chart1.Series["Series1"].Points.AddY(yValue);}// Set fast line chart typeChart1.Series["Series1"].ChartType = SeriesChartType.FastLine;}日期,xy类型// Create a new random number generatorRandom rnd = new Random();// Data points X value is using current dateDateTime date = DateTime.Now.Date;// Add points to the stock chart seriesfor (int index = 0; index < 10; index++){Chart1.Series["Series1"].Points.AddXY(date, // X value is a daternd.Next(40,50)); //Close Y value// Add 1 day to our X valuedate = date.AddDays(1);}int-int的xy数据绘图// Create a new random number generatorRandom rnd = new Random();// Add points to the stock chart seriesfor (int index = 0; index < 10; index++){Chart1.Series["Series1"].Points.AddX Y(rnd.Next(10,90), // X value is a daternd.Next(40,50)); //Close Y value}数据库数据,datetime-int类型string connStr ="server=localhost;database=seis_project;uid=seisprjs;pwd=seisprjs";SqlConnection myConn = new SqlConnection(connStr);string selStr = "select 时间,序号from pub_log_read order by 序号asc";SqlCommand myCmd = myConn.CreateCommand();mandText = selStr;myConn.Open();SqlDataReader sdr =myCmd.ExecuteReader(CommandBehavior.CloseConnection);// Since the reader implements and IEnumerable, pass the readerdirectly into// the DataBindTable method with the name of the Column to be usedas the X ValueChart1.DataBindTable(sdr, "时间");sdr.Close();myConn.Close();数据库数据2,string-int类型string connStr ="server=localhost;database=seis_project;uid=seisprjs;pwd=seisprjs";SqlConnection myConn = new SqlConnection(connStr);string selStr = "select 帐号,count(帐号) as 次数from pub_log_read groupby 帐号order by 帐号asc";SqlCommand myCmd = myConn.CreateCommand();mandText = selStr;myConn.Open();SqlDataReader sdr =myCmd.ExecuteReader(CommandBehavior.CloseConnection);// Since the reader implements and IEnumerable, pass the readerdirectly into// the DataBindTable method with the name of the Column to be usedas the X ValueChart1.DataBindTable(sdr, "帐号");sdr.Close();myConn.Close();数据库绑定3-error?string connStr ="server=localhost;database=seis_project;uid=seisprjs;pwd=seisprjs";SqlConnection myConn = new SqlConnection(connStr);string selStr = "select 帐号,count(帐号) as 次数from pub_log_read groupby 帐号order by 帐号asc";SqlCommand myCmd = myConn.CreateCommand();mandText = selStr;myConn.Open();// Set chart data sourceChart1.DataSource = myCmd;// Set series members names for the X and Y valuesChart1.Series["Series1"].X ValueMember = "帐号";Chart1.Series["Series1"].YValueMembers = "次数";// Data bind to the selected data sourceChart1.DataBind();myConn.Close();数据库4,只绑定ystring connStr ="server=localhost;database=seis_project;uid=seisprjs;pwd=seisprjs";SqlConnection myConn = new SqlConnection(connStr);string selStr = "select 序号from pub_log_read order by 序号asc";SqlCommand myCmd = myConn.CreateCommand();mandText = selStr;myConn.Open();SqlDataReader sdr =myCmd.ExecuteReader(CommandBehavior.CloseConnection);// Since the reader implements and IEnumerable, pass the readerdirectly into// the DataBindTable method with the name of the Column to be usedas the X ValueChart1.Series[0].Points.DataBindY(sdr);sdr.Close();myConn.Close();数据库5,绑定xystring connStr ="server=localhost;database=seis_project;uid=seisprjs;pwd=seisprjs";SqlConnection myConn = new SqlConnection(connStr);string selStr = "select 帐号,count(帐号) as 次数from pub_log_read groupby 帐号order by 帐号desc";SqlCommand myCmd = myConn.CreateCommand();mandText = selStr;myConn.Open();SqlDataReader sdr =myCmd.ExecuteReader(CommandBehavior.CloseConnection);// Since the reader implements and IEnumerable, pass the readerdirectly into// the DataBindTable method with the name of the Column to be usedas the X ValueChart1.Series[0].Points.DataBindX Y(sdr, "帐号",sdr,"次数");sdr.Close();myConn.Close();数据库6,支持显示参数// Resolve the address to the Access databasestringfileNameString = this.MapPath(".");fileNameString += "..\\..\\..\\data\\chartdata.mdb";//Initialize a connectionstringstringmyConnectionString = "PROVIDER=Microsoft.Jet.OLEDB.4.0;DataSource=" + fileNameString;// Definethe databasequerystringmySelectQuery="SELECT * FROM REPSALES WHERE Year=2004;";// Createa database connection object using the connectionstringOleDbConnection myConnection = newOleDbConnection(myConnectionString);// Create adatabase command on the connection usingqueryOleDbCommandmyCommand = new OleDbCommand(mySelectQuery, myConnection);// Open theconnectionmyCommand.Connection.Open();// Create adatabasereaderOleDbDataReader myReader=myCommand.ExecuteReader(CommandBehavior.CloseConnection);// Since thereader implements and IEnumerable, pass the reader directlyinto// theDataBind method with the name of the Columns assigned to theappropriateproperty Chart1.Series["Series1"].Points.DataBind(myReader,"Name","Sales","Tooltip=Year, Label=Commissions{C2}");// Closethe reader and the connectionmyReader.Close();myConnection.Close();数据库7,支持多line// Resolve the address to the Access databasestringfileNameString = this.MapPath(".");fileNameString += "..\\..\\..\\data\\chartdata.mdb";//Initialize a connectionstringstringmyConnectionString = "PROVIDER=Microsoft.Jet.OLEDB.4.0;DataSource=" + fileNameString;// Definethe databasequerystringmySelectQuery="SELECT * FROM REPSALES;";// Createa database connection object using the connectionstringOleDbConnection myConnection = newOleDbConnection(myConnectionString);// Create adatabase command on the connection usingqueryOleDbCommandmyCommand = new OleDbCommand(mySelectQuery, myConnection);// Open theconnectionmyCommand.Connection.Open();// Create adatabasereaderOleDbDataReader myReader=myCommand.ExecuteReader(CommandBehavior.CloseConnection);// Data bindchart to a table where all rows are grouped in series by the "Name"column Chart1.DataBindCrossTable(myReader,"Name","Year","Sales","Label=Commissions{C}");// Closethe reader and the connectionmyReader.Close();myConnection.Close();数据库8,按照行添加数据// Resolve the address to the Access databasestringfileNameString = this.MapPath(".");fileNameString += "..\\..\\..\\data\\chartdata.mdb";//Initialize a connectionstringstringmyConnectionString = "PROVIDER=Microsoft.Jet.OLEDB.4.0;DataSource=" + fileNameString;// Definethe databasequerystringmySelectQuery="SELECT * FROM SALESCOUNTS;";// Createa database connection object using the connectionstringOleDbConnection myConnection = newOleDbConnection(myConnectionString);// Create adatabase command on the connection usingqueryOleDbCommandmyCommand = new OleDbCommand(mySelectQuery, myConnection);// Open theconnectionmyCommand.Connection.Open();//Initializes a new instance of the OleDbDataAdapter classOleDbDataAdapter myDataAdapter = new OleDbDataAdapter();myDataAdapter.SelectCommand = myCommand;//Initializes a new instance of the DataSet classDataSetmyDataSet = new DataSet();// Addsrows in the DataSetmyDataAdapter.Fill(myDataSet,"Query");foreach(DataRow row in myDataSet.Tables["Query"].Rows){// For each Row add a new seriesstring seriesName = row["SalesRep"].ToString();Chart1.Series.Add(seriesName);Chart1.Series[seriesName].ChartType = SeriesChartType.Line;Chart1.Series[seriesName].BorderWidth = 2;for(int colIndex = 1; colIndex <myDataSet.Tables["Query"].Columns.Count; colIndex++) {// For each column (column 1 and onward) add the value as apointstring columnName =myDataSet.Tables["Query"].Columns[colIndex].ColumnName; int YVal = (int) row[columnName];Chart1.Series[seriesName].Points.AddX Y(columnName, YVal);}}DataGrid.DataSource = myDataSet;DataGrid.DataBind();// Closesthe connection to the data source. This is the preferred// method ofclosing any open connection.myCommand.Connection.Close();使用xml数据// resolve the address to the X ML documentstringfileNameString = this.MapPath(".");stringfileNameSchema = this.MapPath(".");fileNameString += "..\\..\\..\\data\\data.xml";fileNameSchema += "..\\..\\..\\data\\data.xsd";//Initializes a new instance of the DataSet classDataSetcustDS = new DataSet();// Read X MLschema into the DataSet.custDS.ReadX mlSchema( fileNameSchema );// ReadX ML schema and data into the DataSet.custDS.ReadX ml( fileNameString );//Initializes a new instance of the DataView classDataViewfirstView = new DataView(custDS.Tables[0]);// Sincethe DataView implements and IEnumerable, pass the reader directlyinto // theDataBindTable method with the name of the column used for the X value. Chart1.DataBindTable(firstView, "Name");使用excel数据// resolve the address to the Excel filestringfileNameString = this.MapPath(".");fileNameString += "..\\..\\..\\data\\ExcelData.xls";// Createconnection object by using the preceding connection string.string sConn= "Provider=Microsoft.Jet.OLEDB.4.0;Data Source=" +fileNameString + ";Extended Properties="Excel8.0;HDR=YES"";OleDbConnection myConnection = new OleDbConnection( sConn );myConnection.Open();// Thecode to follow uses a SQL SELECT command to display the data fromthe worksheet.// Createnew OleDbCommand to return data from worksheet.OleDbCommandmyCommand = new OleDbCommand( "Select * From[data1$A1:E25]",myConnection );// createa databasereaderOleDbDataReader myReader=myCommand.ExecuteReader(CommandBehavior.CloseConnection);//Populate the chart with data in the fileChart1.DataBindTable(myReader, "HOUR");// closethe reader and the connectionmyReader.Close();myConnection.Close();使用csv数据// Filename of the CSV filestring file= "DataFile.csv";// Getthe path of the CSV filestring path= this.MapPath(".");path +="..\\..\\..\\data\";// Createa select statement and a connection string.stringmySelectQuery = "Select * from " + file;stringConStr = "Provider=Microsoft.Jet.OLEDB.4.0;Data Source="+path+ ";Extended Properties="Text;HDR=No;FMT=Delimited"";OleDbConnection myConnection = new OleDbConnection(ConStr);// Createa database command on the connection using queryOleDbCommandmyCommand = new OleDbCommand(mySelectQuery, myConnection);// Openthe connection and create the readermyCommand.Connection.Open();OleDbDataReader myReader=myCommand.ExecuteReader(CommandBehavior.CloseConnection);// Column1 is a time value, column 2 is a double// Databindthe reader to the chart using the DataBindX Y methodChart1.Series[0].Points.DataBindX Y(myReader, "1", myReader,"2");// Closeconnection and data readermyReader.Close();myConnection.Close();数组绘图// Initialize an array of doublesdouble[] yval = { 2, 6, 4, 5, 3 };// Initialize an array of stringsstring[] xval = { "Peter", "Andrew", "Julie", "Mary", "Dave" };// Bind the double array to the Y axis points of the Default dataseriesChart1.Series["Series1"].Points.DataBindX Y(xval, yval);数据库9,dataview// Resolve the address to the Access databasestringfileNameString = this.MapPath(".");fileNameString += "..\\..\\..\\data\\chartdata.mdb";//Initialize a connectionstringstringmyConnectionString = "PROVIDER=Microsoft.Jet.OLEDB.4.0;DataSource=" + fileNameString;// Definethe databasequerystringmySelectQuery="SELECT * FROM REPS;";// Createa database connection object using the connectionstringOleDbConnection myConnection = newOleDbConnection(myConnectionString);// Create adatabase command on the connection usingqueryOleDbCommandmyCommand = new OleDbCommand(mySelectQuery, myConnection);// Open theconnectionmyCommand.Connection.Open();//Initializes a new instance of the OleDbDataAdapter classOleDbDataAdapter custDA = new OleDbDataAdapter();custDA.SelectCommand = myCommand;//Initializes a new instance of the DataSet classDataSetcustDS = new DataSet();// Addsrows in the DataSetcustDA.Fill(custDS, "Customers");//Initializes a new instance of the DataView classDataViewfirstView = new DataView(custDS.Tables[0]);// Sincethe DataView implements IEnumerable, pass the dataview directlyinto // the DataBind method with thename of the Columns selected in thequeryChart1.Series["Default"].Points.DataBindX Y(firstView,"Name",firstView, "Sales");// Closesthe connection to the data source. This is the preferred// method of closing any openconnection.myCommand.Connection.Close();指定坐标轴的数据显示范围// Create a new random number generatorRandom rnd = new Random();// Add points to the stock chart seriesfor (int index = 0; index < 10; index++){Chart1.Series["Series1"].Points.AddX Y(rnd.Next(10,90), // X value is a daternd.Next(40,50)); //Close Y value}Chart1.ChartAreas[0].AxisY.Minimum = 40;Chart1.ChartAreas[0].AxisY.Maximum = 50;数据排序// Use point index for drawing the chartChart1.Series["Series1"].I sX ValueIndexed = true;// Sortseries points by second Y valueChart1.DataManipulator.Sort(PointSortOrder.Ascending, "Y2","Series1");查找数据最大值和最小值// Find point with maximum Y value and change colorDataPointmaxValuePoint =Chart1.Series["Series1"].Points.FindMaxValue();maxValuePoint.Color = Color.FromArgb(255, 128, 128);// Findpoint with minimum Y value and change colorDataPointminValuePoint =Chart1.Series["Series1"].Points.FindMinValue();minValuePoint.Color = Color.FromArgb(128, 128, 255);pie显示交互private void Page_Load(object sender, System.EventArgs e){// Addseries to the chartSeriesseries = Chart1.Series.Add("My series");// Setseries and legend tooltipsseries.ToolTip = "#VALX: #VAL{C} million";series.LegendToolTip = "#PERCENT";series.PostBackValue = "#INDEX";series.LegendPostBackValue = "#INDEX";// Populateseries datadouble[] yValues = {65.62, 75.54, 60.45, 34.73, 85.42, 32.12, 55.18, 67.15,56.24, 23.65};string[] xValues = {"France", "Canada", "Germany", "USA", "Italy", "Russia","China", "Japan", "Sweden", "Spain" };series.Points.DataBindX Y(xValues, yValues);// Setseries visual attributesseries.Type= SeriesChartType.Pie;series.ShadowOffset = 2;series.BorderColor = Color.DarkGray;series.CustomAttributes = "LabelStyle=Outside";}protected void Chart1_Click(object sender, ImageMapEventArgse){intpointIndex = int.Parse(e.PostBackValue);Seriesseries = Chart1.Series["My series"];if(pointIndex >= 0 &&pointIndex < series.Points.Count){series.Points[pointIndex].CustomProperties +="Exploded=true";}}chart点击事件/// <summary>/// Page Load event handler./// </summary>protected void Page_Load(object sender, System.EventArgs e){this.Chart1.Click += new ImageMapEventHandler(Chart1_Click);// directusing of PostBackValueforeach(Series series in this.Chart1.Series){series.PostBackValue = "series:" + + ",#INDEX";}// transferof click coordinates. getCoordinates is a javascriptfunction.stringpostbackScript =ClientScript.GetPostBackEventReference(this.Chart1,"chart:@");this.Chart1.Attributes["onclick"] = postbackScript.Replace("@'", "'+ getCoordinates(event)"); }/// <summary>/// Handles the Click event of the Chart1 control./// </summary>/// <param name="sender">The sourceof the event.</param>/// <paramname="e">The<seecref="System.Web.UI.WebControls.ImageMapEventArgs"/>instance containing the eventdata.</param>protected void Chart1_Click(object sender, ImageMapEventArgse){this.Chart1.Titles["ClickedElement"].Text = "Nothing";string[]input = e.PostBackValue.Split(':');if(input.Length == 2){string[] seriesData = input[1].Split(',');if (input[0].Equals("series")){this.Chart1.Titles["ClickedElement"].Text = "Last Clicked Element:" + seriesData[0] + " - Data Point #" + seriesData[1];}else if (input[0].Equals("chart")){// hit test of X and Y click pointHitTestResult hitTestResult=this.Chart1.HitTest(Int32.Parse(seriesData[0]),Int32.Parse(seriesData[1]));if (hitTestResult != null){this.Chart1.Titles["ClickedElement"].Text = "Last Clicked Element:" + hitTestResult.ChartElementType.ToString();}}}}。
MSChart控件教程

MSChart控件这些内容是在学习过程中进行的整理,由于感到书籍资料或软件帮助中有时让人很不容易理解,特制作这个教程,以方便其他朋友学习,从新学习此控件的人的角度来描述相应的属性,相信也能让跟我一样程度的人更容易理解,可能在学习的过程中对某些属性与方法有理解不正确,请各位指正。
附录:1、AllowDynamicRotation作用:返回或设置是否可旋转图表注:需要图表的ChartType是3d类型才可以,当AllowDynamicRotation=True时,在图表中可按住ctrl+鼠标左键旋转图表。
示例:下列代码在窗体加载时将MSChart1设置为3d柱形图,并允许按住ctrl+鼠标左键旋转。
(窗体上放一个MSChart控件)Private Sub Form_Load()With MSChart1.chartType = VtChChartType3dBar '类型为3d柱形图,类形常数详见附录.AllowDynamicRotation = True '允许旋转End WithEnd Sub下列代码将以对话框的形式返回上面示例的AllowDynamicRotation值:MsgBox MSChart1.AllowDynamicRotation2、ChartData注:书中及软件帮助文档中说到数组需要变体型数值,是指如果要将数组第一个元素作为标题,其他作为数据,那个这个数组既有字符又有数字,那么就需要一个变体形。
如果数组中并不包含标题(或是之后使用属性来赋于标题),那么数组是可以定义类形的,个人建议先给定数组类型,之后再使用属性来设置标题。
作用:设置:将一个数组的数据作表图表的显示数据返回:将图表数据赋给一个数组示例:将数组元素作为图表的显示数据制作一个1行6列的的图表(数组的维代表图表的行,每维的元素代表列)Private Sub Form_Load()Dim 一维数组(1 To 6)'为了表示得更清楚,我们采取逐个赋值的方法一维数组(1) = 1一维数组(2) = 2一维数组(3) = 3一维数组(4) = 4一维数组(5) = 5一维数组(6) = 6With MSChart1.chartType = VtChChartType2dBar '类型为3d柱形图.ChartData = 一维数组()End WithEnd Sub为了理解图表的行列与数组的维数的对应关系,再举例一个二维数组(图表对应就形成2行6列)Private Sub Form_Load()Dim 二维数组(1 To 2, 1 To 6)'为了表示得更清楚,我们采取逐个赋值的方法二维数组(1, 1) = 1二维数组(1, 2) = 2二维数组(1, 3) = 3二维数组(1, 4) = 4二维数组(1, 5) = 5二维数组(1, 6) = 6二维数组(2, 1) = 1二维数组(2, 2) = 2二维数组(2, 3) = 3二维数组(2, 4) = 4二维数组(2, 5) = 5二维数组(2, 6) = 6With MSChart1.chartType = VtChChartType2dBar '类型为2d柱形图.ChartData = 二维数组()End WithEnd Sub下面是将数组的第一个元素设置成字符,使图表加载时将其作为标题的示例:Private Sub Form_Load()Dim 二维数组(1 To 2, 1 To 6)'为了表示得更清楚,我们采取逐个赋值的方法二维数组(1, 1) = "第一行标题"二维数组(1, 2) = 2二维数组(1, 3) = 3二维数组(1, 4) = 4二维数组(1, 5) = 5二维数组(1, 6) = 6二维数组(2, 1) = "第二行标题"二维数组(2, 2) = 5二维数组(2, 3) = 4二维数组(2, 4) = 3二维数组(2, 5) = 2二维数组(2, 6) = 1With MSChart1.chartType = VtChChartType2dBar '类型为2d柱形图.ChartData = 二维数组()End WithEnd Sub最后总结数组元素与维和图表行列的对应关系,作以下关系图:上述例子是将数组的内容反应到图表中,下面我们将使用上面的一维和二维图表,从图表中获得数据给数组,并将数组显示出来以验证结果(我们采取设置一个断点,然后通过视图\本地的方式来查看生成的数组):从图中可以看到,对于我们用2给数组生成的图表,再赋给新的数组时,数组变成了3维,并且每维还多了一个元素用来存储行标签,既“R1”、“R2”,多出来的一维用来存储列标签,既“C1”、“C2”等。
MSChart控件的用法

介绍MSChart的常用属性和事件介绍MSChart的常用属性和事件MSChart的元素组成最常用的属性包括ChartAreas:增加多个绘图区域,每个绘图区域包含独立的图表组、数据源,用于多个图表类型在一个绘图区不兼容时。
AlignmentOrientation:图表区对齐方向,定义两个绘图区域间的对齐方式。
AlignmentStyle:图表区对齐类型,定义图表间用以对其的元素。
AlignWithChartArea:参照对齐的绘图区名称。
InnerPlotPosition:图表在绘图区内的位置属性。
Auto:是否自动对齐。
Height:图表在绘图区内的高度(百分比,取值在0-100)Width:图表在绘图区内的宽度(百分比,取值在0-100)X,Y:图表在绘图区内左上角坐标Position:绘图区位置属性,同InnerPlotPosition。
Name:绘图区名称。
Axis:坐标轴集合Title:坐标轴标题TitleAlignment:坐标轴标题对齐方式Interval:轴刻度间隔大小IntervalOffset:轴刻度偏移量大小MinorGrid:次要辅助线MinorTickMark:次要刻度线MajorGrid:主要辅助线MajorTickMark:主要刻度线DataSourceID:MSChart的数据源。
Legends:图例说明。
Palette:图表外观定义。
Series:最重要的属性,图表集合,就是最终看到的饼图、柱状图、线图、点图等构成的集合;可以将多种相互兼容的类型放在一个绘图区域内,形成复合图。
IsValueShownAsLabel:是否显示数据点标签,如果为true,在图表中显示每一个数据值Label:数据点标签文本LabelFormat:数据点标签文本格式LabelAngle:标签字体角度Name:图表名称Points:数据点集合XValueType:横坐标轴类型YValueType:纵坐标轴类型XValueMember:横坐标绑定的数据源(如果数据源为T able,则填写横坐标要显示的字段名称)YValueMembers:纵坐标绑定的数据源(如果数据源为Table,则填写纵坐标要显示的字段名称,纵坐标可以有两个)ChartArea:图表所属的绘图区域名称ChartType:图表类型(柱形、饼形、线形、点形等)Legend:图表使用的图例名称Titles:标题集合。
MSCHART的使用之vb中利用MSCHART控件画二维散点图
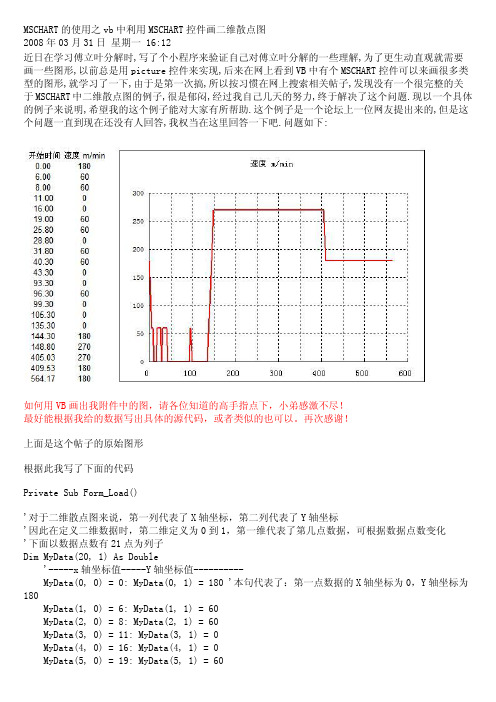
MSCHART的使用之vb中利用MSCHART控件画二维散点图2008年03月31日星期一 16:12近日在学习傅立叶分解时,写了个小程序来验证自己对傅立叶分解的一些理解,为了更生动直观就需要画一些图形,以前总是用picture控件来实现,后来在网上看到VB中有个MSCHART控件可以来画很多类型的图形,就学习了一下,由于是第一次搞,所以按习惯在网上搜索相关帖子,发现没有一个很完整的关于MSCHART中二维散点图的例子,很是郁闷,经过我自己几天的努力,终于解决了这个问题.现以一个具体的例子来说明,希望我的这个例子能对大家有所帮助.这个例子是一个论坛上一位网友提出来的,但是这个问题一直到现在还没有人回答,我权当在这里回答一下吧.问题如下:如何用VB画出我附件中的图,请各位知道的高手指点下,小弟感激不尽!最好能根据我给的数据写出具体的源代码,或者类似的也可以。
再次感谢!上面是这个帖子的原始图形根据此我写了下面的代码Private Sub Form_Load()'对于二维散点图来说,第一列代表了X轴坐标,第二列代表了Y轴坐标'因此在定义二维数据时,第二维定义为0到1,第一维代表了第几点数据,可根据数据点数变化'下面以数据点数有21点为列子Dim MyData(20, 1) As Double'-----x轴坐标值-----Y轴坐标值----------MyData(0, 0) = 0: MyData(0, 1) = 180 '本句代表了:第一点数据的X轴坐标为0,Y轴坐标为180MyData(1, 0) = 6: MyData(1, 1) = 60MyData(2, 0) = 8: MyData(2, 1) = 60MyData(3, 0) = 11: MyData(3, 1) = 0MyData(4, 0) = 16: MyData(4, 1) = 0MyData(5, 0) = 19: MyData(5, 1) = 60MyData(6, 0) = 25.8: MyData(6, 1) = 60MyData(7, 0) = 28.8: MyData(7, 1) = 0MyData(8, 0) = 31.8: MyData(8, 1) = 60MyData(9, 0) = 40.3: MyData(9, 1) = 60MyData(10, 0) = 43.3: MyData(10, 1) = 0MyData(11, 0) = 93.3: MyData(11, 1) = 0MyData(12, 0) = 96.3: MyData(12, 1) = 60MyData(13, 0) = 99.3: MyData(13, 1) = 0MyData(14, 0) = 105.3: MyData(14, 1) = 0MyData(15, 0) = 135.3: MyData(15, 1) = 0MyData(16, 0) = 144.3: MyData(16, 1) = 180MyData(17, 0) = 148.8: MyData(17, 1) = 270MyData(18, 0) = 405.03: MyData(18, 1) = 270MyData(19, 0) = 409.53: MyData(19, 1) = 180MyData(20, 0) = 564.17: MyData(20, 1) = 180'波形图外观设置With MSChart1.TitleText = "速度 m/min"' '设置图线的外观.Plot.SeriesCollection(1).Pen.Width = 30.Plot.SeriesCollection(1).Pen.Style = VtPenStyleSolid' '设置XY轴.Plot.Axis(VtChAxisIdX).ValueScale.Auto = False.Plot.Axis(VtChAxisIdY).ValueScale.Auto = False'// 设置最大值.Plot.Axis(VtChAxisIdX).ValueScale.Maximum = 600.Plot.Axis(VtChAxisIdY).ValueScale.Maximum = 300'// 设置最小值.Plot.Axis(VtChAxisIdY).ValueScale.Minimum = 0.Plot.Axis(VtChAxisIdX).ValueScale.Minimum = 0'//.Plot.Axis(VtChAxisIdX).ValueScale.MajorDivision = 6 'X轴主要网格数量 .Plot.Axis(VtChAxisIdY).ValueScale.MajorDivision = 6 'Y轴主要网格数量 .Plot.Axis(VtChAxisIdX).ValueScale.MinorDivision = 0 'X轴次要网格数量 .Plot.Axis(VtChAxisIdY).ValueScale.MinorDivision = 0 'Y轴次要网格数量 .Plot.Axis(VtChAxisIdX).AxisGrid.MajorPen.Style = VtPenStyleDotted.Plot.Axis(VtChAxisIdY).AxisGrid.MajorPen.Style = VtPenStyleDottedMSChart1.Plot.AutoLayout = FalseMSChart1.Plot.UniformAxis = FalseMSChart1.chartType = VtChChartType2dXY '设置图形为二维散点图MSChart1.ChartData = MyData '数据End WithEnd Sub运行后的效果图如下MSCHART的二维散点图对于实际工作是有很大用途的,例如数据采集中,实现时间变量的曲线等等.希望这个例子对大。
图表绘制控件mschart的使用方法1

图表绘制控件mschart的使⽤⽅法1VisualBasic中ActiveX控件MSChart的使⽤⽅法*依⽪提哈尔·穆罕买提,那斯尔江·⼟尔逊(新疆⼤学数学与系统科学学院,乌鲁⽊齐,830046)热依曼·吐尔逊(新疆⼤学信息⼯程学院,乌鲁⽊齐,830046)摘要:本⽂⾸先介绍了VisualBasic(简称VB)中MSChart控件的使⽤⽅法,然后通过简单的例⼦详细介绍了利⽤MSChart控件绘制Excel数据源图表的⽅法。
关键词:VisualBasic;MSChart控件;MicrosoftExcel数据表;图表;数据库The Methods of Using MSChart Control Based on VBIptihar.Muhammat,Nasirjan.Tursun(Mathematics and Systematic Science Institude of XinjiangUniversity,Urumqi,Xinjiang,830046)Reyima.Tursun(Information Science and Engineering Institude of Xinjiang University,Urumqi,Xinjiang,830046)Abstract:This article discusses how to use the MSChart control and how that is used in the VB project to drawing Microsoft? Excel charts.KeyWords: MSChart Control;Chartdata ;Mirosoft Excel Sheets;Chart;Database1. 引⾔Visual Basic中的MSChart控件是⼀个功能强⼤的⾼级图表⼯具,拥有丰富的图表绘制功能,⽤它来可以显⽰⼆维和三维的棒图、区域图、线形图、饼图等多种常⽤图表。
MSCHART用法
1、MSChart控件的属性(1)ChartType属性:用于设置或返回图表类型,MSChart控件图表类型与对应ChartType属性值如表8.7所示。
如,ChartType=1则显示二维直方图,ChartType=14则显示饼图。
表8.7 MSChart图表类型(2)行(格)属性①RowCount属性:用于表示图表中总格(行)数。
例如:若MSChart控件显示二维数组Array_2(M,N),则总格(行)数RowCount=M。
如:RowCount=5,表示有5格(行)数据。
若MSChart控件显示一维数组Array_1(N)的元素值,则总行数RowCount=1。
②Row属性:用于表示图表中某格(行)的序号。
若MSChart控件显示二维数组Array_2(M,N),则图表中第I格的序号Row=I,当Row=1表示第1格(行)数据。
③RowLabel属性:用于表示格(行)标签名,默认值为Ri。
用户可以修改其值,如改为无锡地区人数、南京地区人数等。
④RowLabelCount属性:用于表示格(行)标签数,MSChart控件允许设置多个格(行)标签。
通常取值为1,当需要用2行以上的标签时,才修改此属性。
⑤RowLabelIndex属性:用于表示格(行)标签序号,用户通过设置不同格(行)标签序号选择不同格(行)标签进行编辑。
(3)列属性①ColumnCount属性:用于表示图表中每格(行)中的列数,即数组中列数N。
如设置ColumnCount=3,则每格(行)中有3列,图表每数据格用3个矩形或3个扇形表示。
②Column属性:用于表示图表中某格(行)某列的列序号,例如:Row=1,Column=1,表示图表中第1格(行)第1列。
③ColumnLabel属性:用于表示图表列标签名,默认为Ci。
④ColumnLabelCount属性:用于表示图表某格中的列标签数。
⑤ColumnLabelIndex属性:用于表示图表某格中的列标签序号。
MFC中MSChart的使用示例
MFC中MSChart的使用示例最近由于工作的原因,接触了一些MSChart的东西。
在查看的资料的时候发现,网上很多资料是关于在VB和C#中利用MSChart实现图表的绘制,但关于在MFC中利用MSChart 实现图表绘制的资料甚少,因此在做的过程中遇到了很多问题,下面对MFC中使用MSChart 进行简单的小结:1.添加MSChart点击VS中的“工具-选择工具箱-COM组件”,找到Microsoft Chart Control,version 6.0(OLEDB)并勾选(注:如果COM组件中不存在该项,便可自行安装,从网上下载MSChart.exe 和MSCHART20.OCX。
首先安装MSChart.exe,然后注册MSCHART20.OCX,如果是win7下要用管理方式运行注册,方可成功)。
如下所示:2.在对话框中添加MSChart控件这个比较简单,在此不再赘述,如下所示:3.属性设置MSChart控件的属性及说明如下,可根据需要自行设置。
ChartAreas:增加多个绘图区域,每个绘图区域包含独立的图表组、数据源,用于多个图表类型在一个绘图区不兼容时。
AlignmentOrientation:图表区对齐方向,定义两个绘图区域间的对齐方式。
AlignmentStyle:图表区对齐类型,定义图表间用以对其的元素。
AlignWithChartArea:参照对齐的绘图区名称。
InnerPlotPosition:图表在绘图区内的位置属性。
Auto:是否自动对齐。
Height:图表在绘图区内的高度(百分比,取值在0-100 )Width:图表在绘图区内的宽度(百分比,取值在0-100 )X,Y:图表在绘图区内左上角坐标Position:绘图区位置属性,同InnerPlotPosition。
Name:绘图区名称。
Axis:坐标轴集合Title:坐标轴标题TitleAlignment:坐标轴标题对齐方式Interval:轴刻度间隔大小IntervalOffset:轴刻度偏移量大小MinorGrid:次要辅助线MinorTickMark:次要刻度线MajorGrid:主要辅助线MajorTickMark:主要刻度线DataSourceID:MSChart的数据源。
ASPNETMVC中使用MsChart制作图
ASP NET MVC 中使用MsChart制作图 MVC 中使用MsChart制作图表(附实例)000微软新发布的图表控件MSChart,依赖于.NET Framework3.5 sp1的环境,制作出的图表非常漂亮。
同时,支持webfrom,winform,MVC。
本文主要介绍在ASP .NET MVC 下如何使用MSCHART制作图表。
1.下面简单列举一下MSCHART的部分图表类型2维堆积饼状图2维面积图2维气泡图2维线性图二维柱状图三维饼状图三维面积图三维线性图2. 在 MVC 框架下,如何使用MSCHART.首先看效果柱状图饼状图下面介绍使用MsChart制作图表实现的步骤:首先修改web.config 1. 将控件的命名空间加到("<system.web><pages><controls>" ) : <add tagPrefix="asp" namespace="System.Web.UI.DataVisualization.Chartin g"assembly="System.Web.DataVisualization,Version=3.5 .0.0,Culture=neutral, PublicKeyToken=31bf3856ad364e35"/> 2. 添加一个httpHandler ("<httpHandlers>"下面) :<add path="ChartImg.axd" verb="GET,HEAD"type="System.Web.UI.DataVisualization.Charting.Cha rtHttpHandler,System.Web.DataVisualization, Version=3.5.0.0, Culture=neutral, PublicKeyToken=31bf3856ad364e35" validate="false"/>3. 然后根据自己的需要,绘制不同的图表。
微软图表控件MsChart使用文档
一、mschart控件使用详解 3.5 ChartAreas控件中的ChartAreas属性是ChartArea对象的集合,ChartArea负责显示容器的属性或图表的背景,由于不止一个,这就意味着MSChart控件可以包含多个图表。
在使用多个ChartAreas时理解下面几点内容非常重要:在技术上可以控制ChartArea的位置,因此多个ChartArea可以叠加,但不推荐这么做,建议在MSChart 控件内的独立区域内绘制它们,为了合并或覆盖数据点,推荐在一个ChartArea内使用多个序列,后面将会有介绍。
默认情况下,控件会为你自动调整大小和位置。
单个ChartArea将会独立调整以适应数据,正如上图所显示的,第二个ChartArea中的Y值更大,数据点也更少。
多个ChartAreas控件允许你使用多个不相容的ChartTypes(序列对象属性,控制图表的显示类型,如条形、柱状和饼状)显示图表,图表任然显示在相同的MSChart控件内。
对于单个ChartArea,有许多独立的属性可以设置和调整,这样你就可以自行调整图表区域以满足不同的需要,它的大部分属性和面板控件的属性都差不多,因此这里我们就不多说了,只说一下ChartArea 唯一的属性,下面是这些唯一属性的清单:3D样式:使用ChartArea的Area3DStyle属性和子属性,我们可以创建漂亮的、十分抢眼的3D图表,无论是在设计器中还是在代码中都必需将Enable3D属性设置为TRUE,其余的参数可以通过调整旋转、视角、照明方式和其它3D元素,让一个图像看起来具有3D效果。
坐标轴控制和样式:坐标轴集合包括x轴和y轴,以及第二个x轴和y轴,这四个项目的属性允许你设置样式、设置标签、定义间隔、设置工具提示、设置缩放等,如果你的图标要求精确的间隔、标签或其它特殊的显示需要,你可以使用这些属性。
例如,你可以颠倒坐标轴的值,或控制如何在x轴上显示标签。
- 1、下载文档前请自行甄别文档内容的完整性,平台不提供额外的编辑、内容补充、找答案等附加服务。
- 2、"仅部分预览"的文档,不可在线预览部分如存在完整性等问题,可反馈申请退款(可完整预览的文档不适用该条件!)。
- 3、如文档侵犯您的权益,请联系客服反馈,我们会尽快为您处理(人工客服工作时间:9:00-18:30)。
一.数据源说到绘制图表,可能很多人的第一反应除了是图表呈现的方式外,更关心的便是数据如何添加,记得在很多年前,哪时要绘制一个数据曲线图,一直找不到好的呈现方式,后来使用了SVG的绘图模式,不过在添加数据的时候可谓吃尽了苦头,毕竟,SVG只是一种描述语言,要动态的实现一个图表的绘制,是非常困难的.对于微软的图表控件,数据添加是一件很简单的方式,它支持多种数据添加方式,如:·可以在图表的设计界面,在属性设置窗口中的Series属性下的Points中添加需要的数据.·可以在图表的设计界面中,在属性中绑定一个数据源.·可以在后台代码中,动态添加数据.·可以在后台代码中设置一个或多个数据源,直接绑定到图表中.在此处,我只着重讲解一下第3,4两点.对于第3点,相对来说比较简单,在后台代码中,找到要添加代码的Series,通过它下面Points的Add、AddXY、AddY等方法,即可以实现数据的添加.例如:1. double t;2. for(t = 0; t <= (2.5 * Math.PI); t += Math.PI/6)3. {4. double ch1 = Math.Sin(t);5. double ch2 = Math.Sin(t-Math.PI/2);6. Chart1.Series["Channel 1"].Points.AddXY(t, ch1);7. Chart1.Series["Channel 2"].Points.AddXY(t, ch2);8. }复制代码注:代码摘自微软的例子,上例中,Chart1为图表的名字,Channel 1、Channel 2分别表示两个Series数据序列)二.绑定数据先来看看图表控件都支持什么类型的数据绑定,根据官方文档的说法,只要是实现了IEnumerable接口的数据类型,都可以绑定到图表控件中,例如:DataView, DataReader, DataSet, DataRow, DataColumn, Array, List, SqlCommand, OleDbCommand, SqlDataAdapter, 及OleDbDataAdapter对象。
对于开发来说,最常用的还是DataView、DataReader、DataSet、DataRow、Array、List这几种类型了,有几点需要注意一下:·图表控件支持多数据源的绑定,例如:X轴绑定一个数据集ds1,Y轴可以绑定另一个数据集ds2,当然也可以是X轴绑定到一个List数据对象,Y轴绑定到一个DataView对象等等。
·图表控件的绑定方式一般有两种,常规绑定及交差表的绑定。
·图表控件的Y轴数据,支持一次绑定多个值,以绘制时间、区域、使用量等之类的图形。
绑定数据的流程如下:2008111015142478.png (44.03 K)2008-11-10 22:19:03大意是,绑定数据里面是否有分组数据需要绑定,如果有,则调用交叉表绑定的方法。
否则判断是否时绑定X轴和Y轴(包括标签、超链接、图例文字等自定义属性),如果是,则调用Points.DataBind方法进行绑定操作。
再判断是否有不同的X轴或Y轴数据,如果有,则分别调用X,Y轴的绑定方法Points.DataBindX,Points.DataBindY进行数据绑定。
最后,再判断是否需要进行多个Y轴值的绑定。
下面分别对几种数据绑定的方法进行一下说明:1.绑定一张数据表绑定一张数据表,例如绑定一张普通的数据表,表数据如下: 2008-11-10_214947.gif (3.24 K)2008-11-10 22:19:03绑定方法的代码:1. string mySelectQuery="SELECT Name, Sales FROM REPS;";2. OleDbConnection myConnection = newOleDbConnection(myConnectionString);3. OleDbCommand myCommand = new OleDbCommand(mySelectQuery, myConnection);4. myCommand.Connection.Open();5. OleDbDataReader myReader =myCommand.ExecuteReader(CommandBehavior.CloseConnection);6. Chart1.DataBindTable(myReader, "Name");7. myReader.Close();8. myConnection.Close();复制代码因为数据源中只有两列Name和Sales,因此在调用Chart1.DataBindTable方法的时候,告诉了图表X轴的名称为Name,因此自动将Sales设置为Y轴的数据了.生成的图形如下: 2008111015495258.png (17.71 K)2008-11-10 22:19:03如果修改一下Sql语句为:SELECT Name,ID,RegionID FROM REPS;其它都不变化,再看看图表是如何处理另外两个字段的,生成的图表如下: 2008111015513437.png (16.09 K) 2008-11-10 22:19:03此时,图表自动将ID,RegionID字段当成了Y值,生成了两个Series,因此每个用户都有两个值,生成的图形也有两个柱状图.上面是一种动态绑定的方式,有人可能会问了,如果我想确定我要绑定的列,比如:X轴绑定某个字段,Y轴绑定某个字段如何操作呢?对于这种绑定,有几种方法可以实现.第一种:这种方法可能是很常见的,在原来的.NET编程中出现的机率非常之高,方法如下:1. // 设置数据源,myDv是一个取出数据集的DataView2. chart1.DataSource = myDv;3.4. // 分别设置图表的X值和Y值5. chart1.Series["Series1"].XValueMember = "Name";6. chart1.Series["Series1"].YValueMembers = "Sales";7.8. // 绑定设置的数据9. chart1.DataBind();复制代码第二种:即直接调用点的绑定方法1. //myReader为取得的DataReader对象2. Chart1.Series["Series1"].Points.DataBindXY(myReader, "Name", myReader, "Sales");复制代码第三种:调用DataBind的方法实现1. Chart1.Series["Series1"].Points.DataBind(myReader, "Name", "Sales", "");上面几种方法得到的效果都是一样的.当然了,上面三种方法需要自己建立Series,要显示两个柱状图,像上面的例子中的图形,那么得手动建立两个Series,然后分别进行上面的绑定操作。
此处说一下Label和Tooltip的绑定方式,要在绑定的图表中显示标签(Label)及提示(Tooltip),可以在绑定的时候,设置绑定的属性. 对于上面的第一、二种方法,可以调用如下的方法来设置Label和Tooltip;例如,两个数据序列名称分别为Series1和Series2,设置代码如下:1. Chart1.Series["Series1"].Label = "#VAL";2. Chart1.Series["Series1"].Points.DataBind(myDs.Tables[0].DefaultView, "Name", "ID", "");3. Chart1.Series["Series2"].Label = "#VAL";4. Chart1.Series["Series2"].Points.DataBind(myDs.Tables[0].DefaultView, "Name", "RegionID", "");其中的#VAL是Label和Tooltip的通配符,表示取默认Y轴变量的意思。
具体的详细操作可以参考例程:Chart Features/Labels下面的内容。
以后有空我也写一篇Label的和其它变量的设置吧。
对于第三种调用的绑定则稍微不同,如下:1. Chart1.Series["Series1"].Points.DataBind(myDs.Tables[0].DefaultView, "Name", "ID", "Label=ID,ToolTip=RegionID");2. Chart1.Series["Series2"].Points.DataBind(myDs.Tables[0].DefaultView, "Name", "RegionID", "Label=RegionID,ToolTip=ID");其实就是利用第三个属性,通过格式化的字符串来设置绑定属性,Label表示标签,ToolTip 表示提示信息,Url表示超链接等等。
最后生成的图片如下:2.绑定一个交叉表微软的图表控件提供了一个交叉表数据的绑定方法DataBindCrossTable,它可以根据数据动态的生成数据序列(Series),借用官方的例子,数据库的表数据如下:我们先看看DataBindCrossTable的参数,它有两个重载方法,分别是:1. public void DataBindCrossTable (2. IEnumerable dataSource,3. string seriesGroupByField,4. string xField,5. string yFields,6. string otherFields,7. PointSortOrder sortingOrder8. )以及1. public void DataBindCrossTable (2. IEnumerable dataSource,3. string seriesGroupByField,4. string xField,5. string yFields,6. string otherFields7. )每个参数的含义如下:dataSource要绑定的数据源.seriesGroupByField要分组统计的数据字段名称,例如按姓名、日期等.xFieldX轴绑定的字段名称.yFieldsY轴绑定的字段名称,如果需要绑定多个字段,则用逗号将字段名分开. otherFields其它数据字段属性,就是上面刚讲的,标签、提示、Url等属性.sortingOrder设置数据是正确还是逆序排列.此时要以统计每个用户的年销售曲线,那么分组统计的字段名应该设置为Name,如下:1. Chart1.DataBindCrossTable(2. myReader,3. "Name",4. "Year" ,5. "Sales",6. "Label=Commissions{C}");用如上的方法绑定,生成的图形如下:相反,如果要统计用户每年的曲线,则将字段反转一下即可,如下:1. Chart1.DataBindCrossTable(2. myReader,3. "Year",4. "Name",5. "Sales",6. "Label=Commissions{C}");这次就先说到这里咯,说几个需要注意的地方:在进行Y轴数据绑定的时候,如果要绑定多个字段,默认情况会出错,那是因为需要设置Y 轴的可保存值数量,设置为你需要保存的数量即可,设置的地点在:Series-》YValuesPrePoint,设置为你需要显示的个数即可。