
cytoscape中文简单操作流程说明
Cytoscape简单操作步骤
1.构建网络
可以新建一个空白网络,也可以使用自己的数据导入构建网络,以下是导入数据构建网络:点击File—Import—network from table(text/ms excel)
Input file列选择自己要导入的文件
然后选择你要建立链接的两列,当前我是要聚簇图,所以我选的source列为自身的id, target列为当前id所在簇,其它列目前都是打的叉,这意味着画图时不考虑他们,如果你想把他们作为边的属性添加到画图中,只需要点一下该列,变成对勾即可
Interaction type一般默认就可以(这个选项不是很清楚,默认是pp类型)
设置好之后点击import
这样简单的网络已经建成
2.设置网络
默认的网络部署为grid layout,你可以自己选择自己需要的layout,点击工具栏中layout,选择其它布局,我们用的是force-direct layout
这样比grid layout好看多了,接下来我们对簇做一些设置
首先我们导入节点属性
File—import—attribute from table选择你要导入的属性文件,我们当前的属性文件即每个节点与它对应的簇
点击import
然后点击data panel下第一个按钮,你会发现节点多了两个属性,一个是column1,一个是column2,点击之后打上对勾,data panel下就会出现这两个属性列
节点自带的属性其实还有很多,如果还想填其它自带属性,在界面中随机选一个点右键,选择visual mapping bypass那里还有很多
接下来设置簇的颜色
点击vizMapper下面会有很多节点的属性,以及边的属性
找到node color双击
点击node color旁边的please select a v….,我们选择刚才导入的属性column2点击Mapping Type旁边的please select a m….选择continuous Mapping
然后双击Graphical view
我们需要简单设置一些参数,点击min/max
因为我们当前只有0-4簇,所以最小为0,最大为4,点击ok,然后可以点击add多加一些分割符(如图蓝色为add之后新加的)
默认颜色为黑和白,想要换别的颜色,双击两个分隔符之间的颜色去,选择自己想要的颜色
选好之后,界面中所有点颜色发生改变
这是对于整体颜色的设置,在图中,我们相对簇中心点设置另外的颜色以及形状,选择簇中心点右键visual mapping bypass选择node shape,我们选正方形,然后点击apply
点击visual mapping bypass选择node color,设置颜色,如下:
这时我们点击data panel中第一个按钮,发现多了两个属性,一个是node.fillcolor,一个是node.shape,这样我们设置别的点时就不需要刚才那么麻烦,换另外一个点,单击
Data panel中如下,我们只需要在这里添加就可以改变节点
我们可能想知道每个点的id是多少,在工具栏中选择view—show graphics details,如图
设置节点的id大小颜色都是右键……
接下来设置一下边(node属性也可以这么操作,只不过接下来的操作是对整个网络中所有的点或边来操作的):
双击defaults下的图片
最下方选择edge
我们可以设置一系列的操作
图中点太小,我们可能想放大看一些部分点,点击
放大缩小按钮,或者直接使用鼠标滑轮
但是我们发现放大后很多点都看不到了,也没法移动,这时候就需要另一个面板的操作了再次选择回Network界面
我们发现下面这个界面也显示着我们的图片,拖动一下它看看
拖动它我们可以选择我们想看的部分
此外,我们可能需要选择一些点,对这些点进行集体操作点击filters
在第二个下拉列表中选择属性,即你根据该属性来选择点,我们还是选择column2
然后点击add
双击颜色较深部分,会弹出窗口
我们在这里设置,比如说我们现在就想处理簇0的所有点,那么我们设计最高和最低都为0
点击ok
我们看data panel中已经帮我们选出了所有簇0的数据
这样我们设置簇0所有的点,比如我们设置所有点的颜色为(0,250,0)先手动设置一个,然后右键点击它有复制到整个属性列的选项
最后保存点击类似照相机的形状,有很多中格式,自己选择
这是在这次画图中学到的一些东西,cytoscape还是很强大的,我学的这些都是些皮毛,有机会继续深入研究一下.。
Cytoscape_manual
Cytoscape用户手册The Cytoscape Collaboration Translated by Gang ChenMarch2,2009Contents1Cytoscape2.6用户手册本文档遵守Creative Commons License,2006作者:The Cytoscape Collaboration中文翻译:Gang Chen¡chengang@¿Cytoscape项目由以下单位合作:•加州大学圣地亚哥分校•系统生物学研究中心•Memorial Sloan-Kettering癌症研究中心•Pasteur研究中心•安捷伦科技公司•加州大学旧金山分校Cytoscape的资金来自NIH的美国国家通用医学研究中心(NIGMS),资金编号为:GM070743-01。
整体资金通过来自Unilever PLC的合同提供。
2引言Cytoscape项目致力于为用户提供一个开源的网络显示和分析软件。
软件的核心部分提供了网络显示、布局、查询等方面的基本功能。
软件的核心可以通过插件架构进行扩展,这样就能快速地开发出新的功能。
Cytoscape源自系统生物学,用于将生物分子交互网络与高通量基因表达数据和其他的分子状态信息整合在一起。
虽然Cytoscape也能适用于其他分子构件和相互作用,但其最强大的功能还是用于大规模蛋白质-蛋白质相互作用、蛋白质-DNA和遗传交互作用的分析。
各种物种,包括人类,的这方面的实验数据都在迅速增加。
通过Cytoscape,用户可以在可视化的环境下将这些生物网络跟基因表达、基因型等各种分子状态信息整合在一起,还能将这些网络跟功能注释数据库链接在一起。
Cytoscape的核心是网络(图),其中的节点(node)是基因、蛋白质或分子,其中的连接则是这些生物结构之间的相互作用。
0.1开发Cytoscape是Institute for Systems Biology(Leroy Hood实验室)、加州大学圣地亚哥分校(Trey Ideker实验室)、Memorial Sloan-Kettering癌症研究中心(Chris Sander实验室)、Pasteur研究院(Benno Schwikowski实验室)、安捷伦科技(Annette Adler实验室)和加州大学旧金山分校(BruceConklin实验室)的合作项目。
[重磅]手把手教你玩Cytoscape
![[重磅]手把手教你玩Cytoscape](https://360docs-1393072327.cos.ap-beijing.myqcloud.com/5fc38b8b70fe910ef12d2af90242a8956becaae4.webp)
[重磅]⼿把⼿教你玩Cytoscape⾮常感谢北京协和医学院药⽤植物研究所于猛⽼师的分享。
在这个看颜值的世界,⼀张狂拽酷炫的图不仅有助于解释⽂章的精髓,更能吸引审稿⼈和读者的眼球。
随着⾼通量多组学的兴起,数据分析与整合、以及可视化变得越来越重要。
今天omicsPie将⼿把⼿教你玩Cytoscape!当然,Cytoscape软件的功能⾮常强⼤,本次只针对我们常⽤的关联分析可视化进⾏了整编。
⼀⼝吃不成⼤胖⼦,那都得天天吃。
Learning by doing,且⾏且珍惜!别忘了转发评论点赞打赏,这才对得起于⽼师和⼩编的⾟苦啊!(结尾有彩蛋,⾃⼰慢慢体会)Ready, Go!C. Zhang et al. / EBioMedicine 2 (2015) 968–984⼩伙伴们阅读⽂献看到这样炫酷的关联图时,您是否眼前⼀亮?其实这样的图可以通过很多软件来实现,⽐如Gephi, R, Cytoscape……下⾯我们⼀起⽤最短的时间学习⼀下怎样⽤Cytoscape软件做关联图吧!Cytoscape简介Cytoscape是⼀款图形化显⽰⽹络并进⾏分析和编辑的软件,它⽀持多种⽹络描述格式,也可以⽤以Tab制表符分隔的⽂本⽂档或Microsoft Excel⽂件作为输⼊,或者利⽤软件本⾝的编辑器模块直接构建⽹络。
软件官⽹:/各版本下载地址:/download_old_versions.htmlCytoscape的核⼼是⽹络,最简单的⽹络图包括节点(node)和边(edge)。
节点是你的关联变量,可以是基因、蛋⽩,代谢物质或者miNRA等等;节点与节点之间的连接 (edge) 代表着这些变量之间的相互作⽤。
⼀张简单的⽹络结构,⽐如下图。
但是想要拥有CNS级别的⾼⼤上,就需要下功夫了!格式(⾮常重要)关联数据格式(⾮常重要)Cytoscape关联数据正所谓条条⼤路通罗马,有很多种⽅法可以编辑数据集,数据关联格式也并⾮唯⼀,现在介绍给⼤家的是⾃认为⽐较⽅便的⼀种格式。
Cytoscape软件画图说明
C y t o s c a p e软件画图说明Company Document number:WTUT-WT88Y-W8BBGB-BWYTT-19998Cytoscape 软件画图说明1、画图前,先准备两个输入文件。
2、打开cytoscape 软件,导入数据。
导入文件点击File ----Import ----Network点击ok 得到原始图形点击layout ----Apply Preferred Out 改变图形排列方式此处可以用鼠标在画布中拖动图形到合适的位置。
改变画布背景。
点击左侧Contro Panel ----Style---network ---Backgroud paint设置节点之间连线的宽度和颜色 Contro Panel ----Style---Edge节点1,文件中第一列 节点2,文件中第2列连接类型,文件中第3列导入个文件点击File ----Import ----Table设置节点图形属性Contro Panel ----Style---Node1、node大小通过设置Height和Width来控制大小2、Node性状通过设置Shape来控制3、Node填充色通过设置Fill Color来控制4、Node标签的设置点击Properties -- Label Position 宽度颜色点击Label Position来设置标签位置。
这里是一个示范操作,要细致调整标签位置还是要设置Column和Mapping Type两个参数。
设置完成之后图形调节节点之间的距离点击layout ----Scale点击File ----Export----Network View as Graphics。
cytoscape使用说明

在数据面板(Data panel) 中选择要显示的节点属性
查看节点属性
选择边属性浏览
选中要显示的边属性
查看边的属性
Agilent Literature Search文献检索插件 /cyto_web/plugins/index.php
检索关键词 是否同时检 索别名 生物种属
从插件菜单(Plugins)中打开cytoprophet插件
首先导入cytoprophet.sif文件
1. 选择整个网络作 为预测对象; 2. 选择MSSC算法; 3. 选择同时预测 DDI Network和G结构域相互作用关系的窗口
Gene Ontology在“功能类”的层面上概括了基因 参与的生命过程。在基因表达谱分析中,GO常用于 提供基因功能分类标签和基因功能研究的背景知识。 Gene Ontology可以用来发掘与基因差异表达现象 关联的“单个特征基因功能类”或“多个特征功能 类”的组合。
/
Cytoscape目前最新版本: 2.7.0
Cytoscape
Cytoscape 2.6.3可由
/download.php?file=cyto2_6_3
下载得到,下载前需要进行简单的注册,输入姓名、 单位、email信息即可。 Cytoscape同时支持Windows、Mac和Linux/Unix。 Cytoscape基于java平台,需首先安装java运行环 境,该软件可由
Cytoscape插件下载
/plugins.php
http://www.psb.ugent.be/cbd/papers/BiNGO/
下载得到的BiNGO.jar存放到 程序安装目录下的plugins
插件安装前:
Cytoscape使用方法

Cytoscape Quick Start1.安装JDK1.632位下载地址:/webapps/download/AutoDL?BundleId=8338364位下载地址:/webapps/download/AutoDL?BundleId=833852.安装Cytoscape2.8.3下载下址:/download.html3.打开Cytoscape 软件,根据菜单导入*.ppi.txt 文件数据:File —> Import —> import network from table(Text/MS Excel)会弹出导入文件的对话框,在对话框中做设置如下:(1)Input file: 选择文件路径(2)Source interaction: column 1(3)Target interaction: column 2(4)Preview: 单击 column 3,此列会变绿,说明此列已可用(5)单击 Import4. 根据菜单调整网络打开互作数据后,点击如下菜单,调整过程如下(可根据自己的爱好或要表达的信息来调整网络):1)view ——> Show Graphics Details ####将基因的名字显示在节点上2)Layout ——> Cytoscape Layouts —> Force-Directed Layout —> unweighted3)Plugins ——> Network Analysis —> Analyze Network,弹出如下窗口:4)如图所选,Treat the network as undirected —> OK ,会弹出如下窗口:5)如上图,点击 Visualize Parameters(用户也可了解网络的其他属性,如Node Degree Distribution 等,具体信息和意义可以参考cytoscape 的在线帮助或联机帮助),弹出如下图:(1)Map node size to: degree(2)Map node color to: Clustering Coefficient(3)Map edge size to: column 35. 结果说明互作网络中节点(node)的大小与此节点的度(degree)成正比,即与此节点相连的边越多,它的度越大,节点也就越大。
Cytoscape史上最全攻略
Cytoscape史上最全攻略今天还是讲Cytoscape,虽然已经写了很多相关的⽂章,但是依然有童鞋在问哪⾥可以下载Cytoscape这样没有营养的问题,这让本宫⽆⽐⽆⽐的痛⼼!!!所以今天本宫会很详细、⾮常详细、巨详细、史⽆前例地详细、前⽆古⼈,后⽆来者地详细讲解如何使⽤Cytoscape。
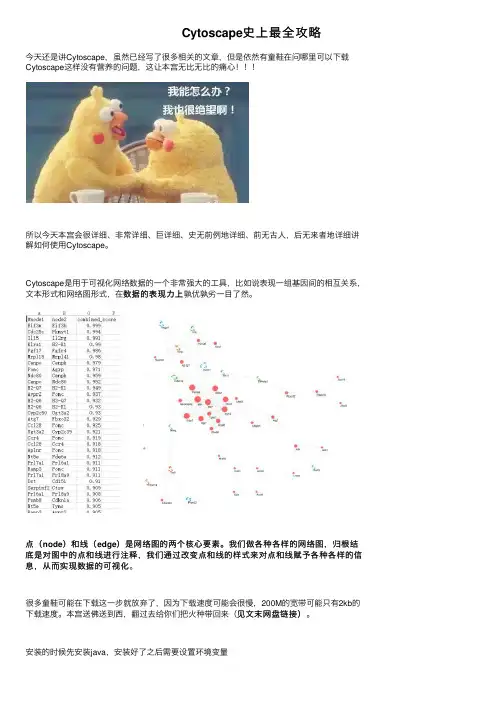
Cytoscape是⽤于可视化⽹络数据的⼀个⾮常强⼤的⼯具,⽐如说表现⼀组基因间的相互关系,数据的表现⼒上孰优孰劣⼀⽬了然。
⽂本形式和⽹络图形式,在数据的表现⼒上点(node)和线(edge)是⽹络图的两个核⼼要素。
我们做各种各样的⽹络图,归根结是⽹络图的两个核⼼要素。
我们做各种各样的⽹络图,归根结底是对图中的点和线进⾏注释,我们通过改变点和线的样式来对点和线赋予各种各样的信息,从⽽实现数据的可视化。
息,从⽽实现数据的可视化很多童鞋可能在下载这⼀步就放弃了,因为下载速度可能会很慢,200M的宽带可能只有2kb的见⽂末⽹盘链接)。
下载速度。
本宫送佛送到西,翻过去给你们把⽕种带回来(见⽂末⽹盘链接)安装的时候先安装java,安装好了之后需要设置环境变量在环境变量中,要修改两个地⽅,⼀个是添加JAVA_HOME。
选择“新建”,变量名填上JAVA_HOME,变量值填上C:\Program Files\Java\jdk1.8.0_151,在java的安装过程中,默认⼀直下⼀步安装,所以装在C盘,如果你在安装过程中改了,那可能是D盘或者E盘,那么变量值要做相应的更改。
还要修改⼀个地⽅,就是Path,添加JAVA的变量值到Path中,选择Path,然后点“编辑”,在最后⾯添加如下语句;%JAVA_HOME%\bin;打开命令提⽰符cmd,输⼊java -version,如果能正常显⽰,那表明装好了,你就可以装Cytoscape了虽然⽹盘⾥的是最新版本3.60,但是不知道重新安装需不需要重新下载插件什么的,时间所如果⼤家在使⽤过程中发现什么差别,请在迫,今天给⼤家所做的演⽰都是基于3.42版本,如果⼤家在使⽤过程中发现什么差别,请在⽂末留⾔。
Cytoscape软件画图说明
C y t o s c a p e软件画图说明-CAL-FENGHAI.-(YICAI)-Company One1Cytoscape软件画图说明1、画图前,先准备两个输入文件。
2、打开cytoscape软件,导入数据。
导入文件点击File ----Import ----Network点击ok得到原始图形节点1,文件中第一列节点2,文件中第2列连接类型,文件中第3列点击layout ----Apply Preferred Out 改变图形排列方式此处可以用鼠标在画布中拖动图形到合适的位置。
改变画布背景。
点击左侧Contro Panel ----Style---network ---Backgroud paint设置节点之间连线的宽度和颜色Contro Panel ----Style---Edge颜色宽度导入个文件点击File ----Import ----Table设置节点图形属性Contro Panel ----Style---Node1、node大小通过设置Height和Width来控制大小2、Node性状通过设置Shape来控制3、Node填充色通过设置Fill Color来控制4、Node标签的设置点击Properties -- Label Position点击Label Position来设置标签位置。
这里是一个示范操作,要细致调整标签位置还是要设置Column和Mapping Type两个参数。
设置完成之后图形调节节点之间的距离点击layout ----Scale鼠标拖动最后,画图导出成pdf文件点击File ----Export----Network View as Graphics11。
专题Cytoscape教学
06
Cytoscape常见问题及解决方 案
定义:Cytoscape是一个开源的、免费的网络可视化工具,用于分析和理解复杂的网络结构 特点:支持多种网络格式,包括蛋白质相互作用、基因调控网络等 功能:提供丰富的可视化效果和交互功能,帮助用户更好地理解网络结构和关系 应用领域:生物信息学、系统生物学、网络科学等
节点选项卡:用于 管理节点属性
添加标题
边选项卡:用于管 理边属性
添加标题
布局选项卡:用于 管理布局属性
添加标题
插件选项卡:用于 管理插件属性
添加标题
帮助选项卡:提供 帮助文档和教程
从文件导入
从数据库导入
从文本文件导入
从其他软件导入
节点添加、删除与编 辑
边添加、删除与编辑
节点与边的属性设置
节点与边的布局调整
,a click to unlimited possibilities
01 单 击 添 加 目 录 项 标 题
02 C y t o s c a p e 概 述
03 C y t o s c a p e 安 装 与 配 置
04 C y t o s c a p e 基 本 操 作
05 C y t o s c a p e 进 阶 操 作
交互式图形界面
支持多种数据格式
丰富的网络分析算法
可视化网络结构和节点关 系
生物信息学 化学信息学 系统生物学 药物发现
下载Cytoscape软件安装包 解压安装包,找到“Cytoscape”文件夹 打开“Cytoscape”文件夹,找到“CytoscapeInstaller”应用程序 双击“CytoscapeInstaller”应用程序,按照提示进行安装 安装完成后,在桌面或开始菜单中找到Cytoscapytoscape插件
Cytoscape的使用方法(带图片解析)
、KEGGscape等
模块与复合物分析:jActiveModules+BiNGO
最近在做网络构建的课题,用到了cytoscape软件,所以把软件的用法总结了一下。
cytoscape是由许多研究单位共同合作开发的一个开放源码的生物信息分析软件。研究单位包括加州大学圣地亚哥分校的TreyIdeker实验室,加州大学旧金山分校的BruceConklin实验室,Pasteur研究院的Benno Schwikowski实验室,Memorial_Sloan-Kettering癌症研究中心的Chris Sander实验室,Institute forSystems Biology的Leroy Hood实验室。
首先这个软件是基于JAVA的一款多功能软件,在安装好相应版本的JAVA之后,安装的cytoscape才可以正常运行。
一、输入文件
支持多种输入格式,可以保存工程文件,支持多种布局的方式,支持导出图像,样式可以做丰富的调整,智能的选择过滤。
1、 edge文件格式:
tsv(制表符分隔的txt是一样的),csv(逗号分隔的),xls,xlsx文件等,一般两种tsv文件就足够我们使用了。下面就是一个典型的三列tsv格式的文件示例,第一列是原节点,第三列是目标节点,第二列是两者的相互作用关系,这里的作用关系标示了不同类型,在后面的网络设置中大家可以看到它的妙处,而这里的source与target都是数字,怎样转换为我们想看到的基因名字呢,这里也是先留一个问题,后面解释。
figure 28
七、表达分析
Cytoscape还可以导入基因的表达值,将不同的表达值进行颜色的梯度展示,由于我的分析没有这部分数据所以将网络上学到的图片做了几个截图:
figure 29
CYTOSCAPE 使用说明
Tutorial:Basic Expression Analysis in Cytoscape-HumanSlideshow Basic Expression Analysis in Cytoscape (30 min)Handout Basic_Expression_Analysis_in_Cytoscape-Human.pdf (11 pages)Tutorial Curators Kristina Hanspers, Alex Pico, Mike SmootContents[hide]∙ 1 Loading Network∙ 2 Loading expression data∙ 3 Visualizing Expression Datao 3.1 Set the node coloro 3.2 Set the default node coloro 3.3 Set the node shapeo 3.4 Set the node border∙ 4 Data analysis featureso 4.1 Filter Nodeso 4.2 Search for a nodeo 4.3 Exploring NodesCytoscape is an open source software platform for integrating, visualizing,and analyzing measurement data in the context of networks. This tutorial will introduce you to:▪Combining data from two different sources: experimental data in the form of microarrray expression data and network data in the form of interaction data.▪Visualizing networks using expression data.▪Filtering networks based on expression data.Loading Network▪Start Cytoscape and load the network File:HumanInteractome subset.sif.▪Apply the force-directed layout to organize the layout of the nodes. Select the "Layout->Cytoscape Layouts->Force-Directed Layout" menu.▪The network should now look similar to this:Loading expression data▪Download File:Pellegrini et al Data.txt.zip expression data and unzip it.▪Using your favorite text editor, open the file Pellegrini_et_al_Data.txt. The first few lines of the file are as follows:Gene Symbol Entrez id Probeset CREB kd control p value fold change Sign CREB bindingA2M 2 217757_at 42.24 57.450.4 1.5 yesA2ML1 144568 1553505_at 67.95 206.470.11 0.58A2ML1 144568 1564307_a_at 160.05 183.440.81 0.95You should note the following information about the file:1. The first line consists of labels.2. All columns are separated by a single tab character.3. The first column contains node names, and must match the names of the nodes in yournetwork exactly!4. The second column contains Entrez Gene IDs.5. The third column contains Affymetrix probe set IDs. This column is optional, and the data isnot currently used by Cytoscape, but this column may be useful for analysis in othermicroarray analysis tools.6. The remaining columns contain experimental data; average expression for experimentaland control groups, p value and fold change for the comparison, and data on whether ornot the gene binds CREB. See the manuscript for details on the data generation. NOTE: The expression data used in this example has been pre-processed to work with the interaction network used. The data is a composite of data files from Pellegrini et al, BMC Cancer, 2008.▪Under the File menu, select Import → Attribute from Table (Text/MS Excel).▪Click "Node" for the type of attribute to import.▪Select the file Pellegrini_et_al_Data.txt.▪Click the "Text File Import Options" check box.▪Make sure the "Tab" check box in the "Delimiter" section is selected and that no other check box under "Delimiter" is selected. The preview should indicate that it is importing multiplecolumns of data.▪Click the "Transfer first line as attribute names" check box in the "Attribute Names" section. The preview should now show be using the first row of the input file as column names and the import window should look like the image below.▪Click the "Import" button to import the attribute data.Now we will use the Node Attribute Browser to browse through the expression data, as follows. ▪Select a node on the Cytoscape canvas by clicking on it.▪In the Node Attribute Browser, click the Select Attributes button , and select the attributes "fold change" and "p value" by left-clicking on them. Right-click to close the menu. ▪Under the Node Attribute Browser, you should see your node listed with their expression values, as shown.Visualizing Expression DataProbably the most common use of expression data in Cytoscape is to set the visual attributes of the nodes in a network according to expression data. This creates a powerful visualization, portraying functional relation and experimental response at the same time. Here, we will walk through the steps for doing this.Set the node color▪Double-Click the Node Color row in the Visual Mapping Browser in the Unused Visual Properties Section.▪This action will move Node Color to the top of the Visual Mapping Browser.▪Click the "Please select a value!" cell in the Node Color section.▪This will produce a drop-down menu of available attribute names. Select "fold change".▪Click the "Please select a mapping" cell in the Node Color section.▪This will produce a drop-down menu of available mapping types. Select "Continuous Mapping". ▪This action will produce a basic black to white color gradient.▪Click on the color gradient to change the colors. This will pop-up a gradient editing dialog.▪Drag the left-most, red handle along the top of the gradient. Drag it to an Attribute Value of approx. -1.2▪Drag the white handle to approx 0.5. You can type the Attribute Value in the Handle Settings section to be more precise.▪You can also change the color of each handle by double-clicking or using the Node Color selector button in the Handle Settings section.▪This should produce a Red-White-Green Color gradient like the image below, with min and max extremes colored black and blue, respectively.▪Click 'OK' to save the gradient adjustment dialog and verify that the nodes in the network reflect the new coloring scheme.Set the default node colorNote that the default node color of pink falls within this spectrum. A useful trick is to choose a color outside this spectrum to distinguish nodes with no defined expression value and those with slight repression.▪Click the Defaults network icon in the VizMapper panel.▪Click the Node Color entry and choose a dark gray color.▪Zoom out on the network view to verify that a few nodes have been colored gray.Set the node shapeWe imported both a fold change value and a p value for the comparison between CREB kd and control cells. We can use the p values to change the shape of the nodes so that measurements we have confidence in appear as squares while potentially bad measurements appear as circles.▪Double-Click the Node Shape row in the Visual Mapping Browser in the Unused Visual Properties Section.▪This action will move Node Shape to the top of the Visual Mapping Browser.▪Click the "Please select a value!" cell in the Node Shape section.▪This will produce a drop-down menu of available attribute names. Select "p value".▪Click the "Please select a mapping" cell in the Node Shape section.▪This will produce a drop-down menu of available mapping types. Select "Continuous Mapping". ▪This will create an empty icon in the "Graphical View" row of the Node Shape section. Click on this icon.▪This action will pop-up a continuous shape selection dialog.▪Click the Add button.▪This action will split the range of values with a slider down the middle with a node shape icon to either side of the slider.▪Double-Click on the left node icon (a circle).▪This will pop-up a node shape selection dialog.▪Choose the Rectangle shape and click the Apply button.▪The continuous shape selection dialog should now show both a square and a circle node shape icon.▪Click on the black triangle and move the slider to the left, to slightly lower that 0.05, our threshold for significance.▪Close the continuous shape selection dialog and verify that some nodes have a square shape and some nodes have a circular shape.Set the node borderWe can use the node border color and style to reflect whether a node has been found to be significantly bound by CREB (ref). This data is already available in the dataset as an attribute.▪Double-Click the Node Border Color row in the Visual Mapping Browser in the Unused Visual Properties Section.▪This action will move Node Border Color to the top of the Visual Mapping Browser.▪Click the "Please select a value!" cell in the Node Border Color section.▪This will produce a drop-down menu of available attribute names. Select "Sign CREB binding". ▪This will produce a drop-down menu of available mapping types. Select "Discrete Mapping". ▪This will create a new row for the value "yes", which is the only value available for this attribute.Click on the empty cell to the right of "yes", and then click on the square icon that appears.▪ A color chooser will appear. Pick a color that will stand out against the color scheme, for example a bright yellow. The relevant nodes in the network will be outlined in yellow.Next, we want to also change the border thickness, since the thin yellow border can be hard to see.▪Double-Click the Node Line Width row in the Visual Mapping Browser in the Unused Visual Properties Section.▪This action will move Node Line Width to the top of the Visual Mapping Browser.▪Click the "Please select a value!" cell in the Node Line Width section.▪This will produce a drop-down menu of available attribute names. Select "Sign CREB binding". ▪This will produce a drop-down menu of available mapping types. Select "Discrete Mapping". ▪This will create a new row for the value "yes", which is the only value available for this attribute.The default node border width of 1.5 will be selected to the right of "yes".▪Click in the box specifying the width and type 5.▪Zooming in to part of the network, it now looks like this:Data analysis featuresThis section presents a few examples of features in Cytoscape that can be used to further analyze the network and associated data.First, here is some background on your data. The data is from an experiment in a human myeloid leukemia cell line. The cAMP Response Element Binding Protein, CREB, was knocked down by shRNA and the expression profile of knockdown cells was compared to that of control cells from the same cell line. See Pellegrini et al.Filter NodesIt is possible to filter any network in Cytoscape based on either node or edge attributes. Here, we filter the network based on high and low fold change between the two groups.▪Click the Filters tab in the Control Panel.▪Click the Attribute/Filter chooser in the Filter Definition and choose "node.fold change".▪Click the Add button in the Filter Definition section to add the selected attribute to the filter. ▪This action will create a slider for the fold change in the filter.▪Double-click on the slider to select cutoffs. Set the low bound to 2 and click OK.▪Now, expand the selection to first neighbors of selected nodes byclicking Select→Nodes→First Neighbors of Selected Nodes.▪Create a new network by clicking New→Network→From Selected Nodes, All Edges.▪Apply a force-directed layout to the new network by selecting Layout → Cytoscape Layouts → Force-Directed Layout.▪Navigate to the Network tab in the Control Panel. Rename the new network by right-clicking on it and selecting Edit Network Title. Type in "upregulated".▪The new network should now look like this:▪Repeat the Filter for down-regulated genes with fold change under 0.5. Name the second subnetwork "downregulated".▪The "downregulated" network should look like this:Search for a nodeWe will now search for the CREB1 (CREB) node in the network.▪In the toolbar, to the right of the Search box, click the icon for Configure search options'.▪In the dialog that opens, select the radio button for Nodes and make sure Unique Identifier is selected in the drop-down. Click Apply.▪In the search field, type in "CREB". In the list of hits that is generated, you will see that there is one node named CREB1, which is an alias name for the CREB transcription factor. Select this node from the list and click Enter.▪The CREB node will be highlighted in the network.▪To make it easier to explore the interactions immediately surrounding CREB, we can create a network based on the first degree neighbors of CREB by clicking Select → Nodes → First Neighbors of Selected Nodes.▪ A set of nodes should now be highlighted. Click File → New → Network → From Selected Nodes, All Edges. A new network will be produced.▪Clean up the network by applying a force-directed layout.▪The network should now look like this:▪By examining the network, we can see that CREB interacts with both up- and down-regulated nodes. CREB is known to act both as a transcriptional repressor and transcriptional activator. If you search for CREB in the two subnetworks representing all up- and down-regulated nodes respectively, you will see that CREB is present in both networks.Exploring Nodes▪In the "HumanInteractome_subset" network, right click on the node CREB1.▪Select the menu LinkOut → Entrez → Gene.▪This action will pop-up a browser window and search the Entrez Gene database for CREB.。