Global temperature change
全球变暖英语演讲稿(精选多篇)

全球变暖英语演讲稿(精选多篇)第一篇:全球变暖英语演讲稿è??ò±??ˉó¢ó??y?2??.txt10óeá??′??£?éú?üa?3ìé?μ????ˉ?éò??ì3éò???à?ìì£?óeá??′??£?1aμ¥?éò??yò?3éò???oè??£?óeá??′??£???à??éò??à·?3éaú?2μ??ê?¨?£global warmingthere is little doubt that the planet is warming. over the last century, the planets temperature has risen by around 1 degree fahrenheit (0.6 of a degree celsius). the warmest since the mid 1800?ˉs was the 1990s. the hottest years recorded were 1997, 1998, 2014, 2014, 2014.the united nations panel on climate change projects that the global temperatures will rise 3-10 degrees fahrenheit by the century?ˉs end - enough to have the polar caps all but melted.if the ice caps melt, a vast majority of our countries borders will be under water. monuments and great buildings, as well as homes and lives will be under water, including new york city.so now we know what some of the causes are for global warming, how can we as individuals do our part to help save the planet?the answer is simpler than you may think. you don?ˉt have to go miles away from home to protest, or spend masses of money. if you try to follow the few simple steps that i shall now give you, you will have started to help us all.firstly, plant a tree. this could be easier than it sounds. join or help out a local wildlife group and ask to plant a tree. trees, when fully grown, will help keep the planet cooler. on the same point, you could protest against the demolition of the rainforests. this is the same principle, we need the trees to cool our planet and yet they are chopping them down to create roads or homes.something as simple as walking instead of taking the car will help reduce pollution. as well as stopping pollution, you are giving yourself exercise, something important for our bodies. so the next time you get into your car, or your motorbike, think - do i have to make this journey by vehicle or can i walk?when you are at home, and your getting a little cold. put a jumper on and do not adjust the heating.the extra heat produced by our homes also affects the planet. so try wearing an extra layer in winter.if possible, buy your fruit and vegetables from local suppliers. and try to avoid imported goods. the more foreign food that we import the more pollution from aeroplanes and boats it will create.keeping to the speed limit can also help the environment. the more you speed the more petrol you are going to use, making the pollution higher. also, suv?ˉs make about six times their own weight in co2 each year. a small efficient diesel car covering the same distance not only uses much less fuel; it makes two thirds less.if possible use solar energy, after all it is free; all you need to buy is the equipment. you can get much of your hot water and heating from the sun and even generate electricity.reduce, reuse and recycle. only buy what you need; don?ˉt stock the cupboards with things(推荐打开) you may or may not use. reuse whatever you can, like containers and paper, and recycle what you cannot reuse. it really is as simple as that.finally turning off unused sources of power such as televisions and heaters will help the environment, as well as save you money.if everybody stuck to these rules, we would be doing a great thing by protecting the earth. so please take into consideration what i have said, and try to do your part. after all, it will be our next generation that will feel the effects.第二篇:英语作文全球变暖全球变暖environmental protectionno one,regardless of race, religion or nationality, can deny that the world we live in is becoming increasingly intolerable because of the effects of global warming. according to many experts, even greater impacts are still on the way.there are numerous causes for this problem. on one hand, human-related emissions of carbon into the atmosphere is causing, and will in the future cause, significant global warming according to the theory. on the otherhand, the lack of knowledge about the importance of protecting environment hinders the solving of the it is urgent that immediate and effective actions should be taken right away. first, more trees need to be planted to help improve and beautify the environment. besides, stricter laws concerning global warming and irresponsible use of fuel resources have to be put into effect and achieved good results. in a word, there is a long way to go before we can take a comfortable world for granted again .many people believe that human activity is causing the earth’s temperature to rise. they say that this global warming will have dreadful consequences for our environment, such as drought and flooding. m what should governments do to help prevent global warming? give reasons for your suggestions.the earth’s temperature is rapidly changing. as a result there has been a lot of climate change such as heat waves, droughts and floods. scientists believe that this is the result of human activity, which is polluting the earth’s atmosphere. this could become a disaster if governments do not act to help prevent global warming. they can act in three ways; by supporting research, by making laws and by keeping the general public informed.firstly, governments can support research. for example, they should encourage companies to develop vehicles that cause less pollution. they should also supportalternative sources of electricity from wind and water rather than from oil and coal. as well, they should sponsor conferences to discuss the effects of greenhouse gas emissions and possible solutions to the problem. secondly, they should make laws that limit the amount of greenhouse gases that companies can emit. private companies should be rewarded for following these laws. they should also be punished for creating pollution. finally, everybody is affected by global warming. therefore, it is important thatgovernments involve individuals in the problem solving process. for example they should encourage households to save as much energy as possible by using more efficient light bulbs or less hot water. they should also encourage the public to recycle, and this should be compulsory for everyone. another way of saving energy is by public transport systems. governments should spend money on public transport to make it as easy as possible for the public to save energy.in summary, it is clear that there are a lot of things that governments can do to prevent global warming. they should involve companies, support scientists and encourage individuals to protect the planet.第三篇:全球变暖英语作文全球变暖英语作文作文一people around the world may feel that the climate has been getting steadily warmer and warmer in recent years. places which used to beabundant in snowfall have frequently experienced snowfree winters. drought lasts longer in some dry areas. people find that without air conditioners they could hardly work or fall asleep on hotter summer days. the side effects of global warming are alarmins. a warmer global climate melts the ice caps, raising sea levels. what is more, it disturbs weather patterns, causing droughts, severe storms, hurricanes. people suffer a lot from disasters relevant to global warming.to stop global warming we should make immediate and continual efforts. we hope the situation will soon change. global warming catches and holds our concern, for it affects us and will affect our later generations. we cannot wait any longer. do it. do it right. do it right now.作文二全球变暖directions: for this part, you are allowed 30 minutes to write a short essay on the topic environmental protection. you should write at least 120 words following the outline given below.1. 全球变暖对地球环境造成了很大影响2. 引起全球变暖的原因3. 我们需要采取的措施environmental protectionno one,regardless of race, religion or nationality, can deny that the world we live in is becoming increasingly intolerable because of the effects ofglobal warming. according to many experts, even greater impacts are still on the way.there are numerous causes for this problem. on one hand, human-related emissions of carbon into the atmosphere is causing, and will in the future cause, significant global warming according to the theory. on the other hand, the lack of knowledge about the importance of protecting environment hinders the solving of the problem.it is urgent that immediate and effective actions should be taken right away. first, more trees need to be planted to help improve and beautify the environment. besides, stricter laws concerning global warming and irresponsible use of fuel resources have to be put into effect and achieved good results. in a word, there is a long way to go before we can take a comfortable world for granted again .作文三全球气候变暖是目前人类面临的最大环境问题。
全球气候变化Global temperature change
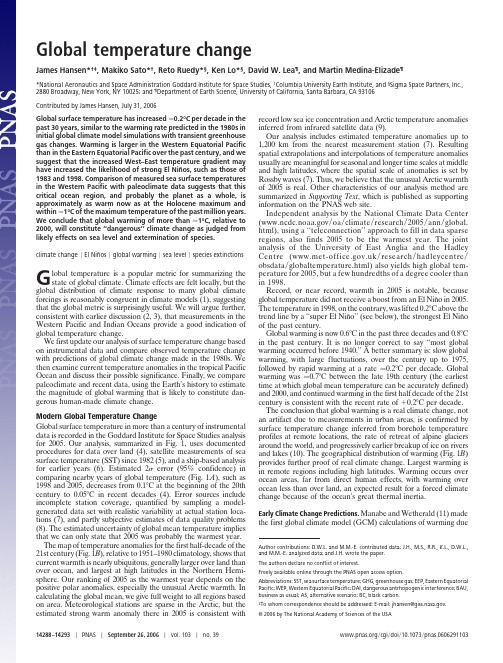
Global temperature changeJames Hansen*†‡,Makiko Sato*†,Reto Ruedy*§,Ken Lo*§,David W.Lea ¶,and Martin Medina-Elizade ¶*National Aeronautics and Space Administration Goddard Institute for Space Studies,†Columbia University Earth Institute,and §Sigma Space Partners,Inc.,2880Broadway,New York,NY 10025;and ¶Department of Earth Science,University of California,Santa Barbara,CA 93106Contributed by James Hansen,July 31,2006Global surface temperature has increased Ϸ0.2°C per decade in the past 30years,similar to the warming rate predicted in the 1980s in initial global climate model simulations with transient greenhouse gas changes.Warming is larger in the Western Equatorial Pacific than in the Eastern Equatorial Pacific over the past century,and we suggest that the increased West–East temperature gradient may have increased the likelihood of strong El Niños,such as those of 1983and parison of measured sea surface temperatures in the Western Pacific with paleoclimate data suggests that this critical ocean region,and probably the planet as a whole,is approximately as warm now as at the Holocene maximum and within Ϸ1°C of the maximum temperature of the past million years.We conclude that global warming of more than Ϸ1°C,relative to 2000,will constitute ‘‘dangerous’’climate change as judged from likely effects on sea level and extermination of species.climate change ͉El Niños ͉global warming ͉sea level ͉species extinctionsGlobal temperature is a popular metric for summarizing the state of global climate.Climate effects are felt locally,but the global distribution of climate response to many global climate forcings is reasonably congruent in climate models (1),suggesting that the global metric is surprisingly useful.We will argue further,consistent with earlier discussion (2,3),that measurements in the Western Pacific and Indian Oceans provide a good indication of global temperature change.We first update our analysis of surface temperature change based on instrumental data and compare observed temperature change with predictions of global climate change made in the 1980s.We then examine current temperature anomalies in the tropical Pacific Ocean and discuss their possible significance.Finally,we compare paleoclimate and recent data,using the Earth’s history to estimate the magnitude of global warming that is likely to constitute dan-gerous human-made climate change.Modern Global Temperature ChangeGlobal surface temperature in more than a century of instrumental data is recorded in the Goddard Institute for Space Studies analysis for 2005.Our analysis,summarized in Fig.1,uses documented procedures for data over land (4),satellite measurements of sea surface temperature (SST)since 1982(5),and a ship-based analysis for earlier years (6).Estimated 2error (95%confidence)in comparing nearby years of global temperature (Fig.1A ),such as 1998and 2005,decreases from 0.1°C at the beginning of the 20th century to 0.05°C in recent decades (4).Error sources include incomplete station coverage,quantified by sampling a model-generated data set with realistic variability at actual station loca-tions (7),and partly subjective estimates of data quality problems (8).The estimated uncertainty of global mean temperature implies that we can only state that 2005was probably the warmest year.The map of temperature anomalies for the first half-decade of the 21st century (Fig.1B ),relative to 1951–1980climatology,shows that current warmth is nearly ubiquitous,generally larger over land than over ocean,and largest at high latitudes in the Northern Hemi-sphere.Our ranking of 2005as the warmest year depends on the positive polar anomalies,especially the unusual Arctic warmth.In calculating the global mean,we give full weight to all regions based on area.Meteorological stations are sparse in the Arctic,but the estimated strong warm anomaly there in 2005is consistent withrecord low sea ice concentration and Arctic temperature anomalies inferred from infrared satellite data (9).Our analysis includes estimated temperature anomalies up to 1,200km from the nearest measurement station (7).Resulting spatial extrapolations and interpolations of temperature anomalies usually are meaningful for seasonal and longer time scales at middle and high latitudes,where the spatial scale of anomalies is set by Rossby waves (7).Thus,we believe that the unusual Arctic warmth of 2005is real.Other characteristics of our analysis method are summarized in Supporting Text ,which is published as supporting information on the PNAS web site.Independent analysis by the National Climate Data Center ( ͞oa ͞climate ͞research ͞2005͞ann ͞global.html),using a ‘‘teleconnection’’approach to fill in data sparse regions,also finds 2005to be the warmest year.The joint analysis of the University of East Anglia and the Hadley Centre ( ͞research ͞hadleycentre ͞obsdata ͞globaltemperature.html)also yields high global tem-perature for 2005,but a few hundredths of a degree cooler than in 1998.Record,or near record,warmth in 2005is notable,because global temperature did not receive a boost from an El Niño in 2005.The temperature in 1998,on the contrary,was lifted 0.2°C above the trend line by a ‘‘super El Niño’’(see below),the strongest El Niño of the past century.Global warming is now 0.6°C in the past three decades and 0.8°C in the past century.It is no longer correct to say ‘‘most global warming occurred before 1940.’’A better summary is:slow global warming,with large fluctuations,over the century up to 1975,followed by rapid warming at a rate Ϸ0.2°C per decade.Global warming was Ϸ0.7°C between the late 19th century (the earliest time at which global mean temperature can be accurately defined)and 2000,and continued warming in the first half decade of the 21st century is consistent with the recent rate of ϩ0.2°C per decade.The conclusion that global warming is a real climate change,not an artifact due to measurements in urban areas,is confirmed by surface temperature change inferred from borehole temperature profiles at remote locations,the rate of retreat of alpine glaciers around the world,and progressively earlier breakup of ice on rivers and lakes (10).The geographical distribution of warming (Fig.1B )provides further proof of real climate rgest warming is in remote regions including high latitudes.Warming occurs over ocean areas,far from direct human effects,with warming over ocean less than over land,an expected result for a forced climate change because of the ocean’s great thermal inertia.Early Climate Change Predictions.Manabe and Wetherald (11)madethe first global climate model (GCM)calculations of warming dueAuthor contributions:D.W.L.and M.M.-E.contributed data;J.H.,M.S.,R.R.,K.L.,D.W.L.,and M.M.-E.analyzed data;and J.H.wrote the paper.The authors declare no conflict of interest.Freely available online through the PNAS open access option.Abbreviations:SST,sea surface temperature;GHG,greenhouse gas;EEP,Eastern Equatorial Pacific;WEP,Western Equatorial Pacific;DAI,dangerous antrhopogenic interference;BAU,business as usual;AS,alternative scenario;BC,black carbon.‡Towhom correspondence should be addressed:E-mail:jhansen@.©2006by The National Academy of Sciences of the USA14288–14293͉PNAS ͉September 26,2006͉vol.103͉no.39 ͞cgi ͞doi ͞10.1073͞pnas.0606291103to instant doubling of atmospheric CO 2.The first GCM calculations with transient greenhouse gas (GHG)amounts,allowing compar-ison with observations,were those of Hansen et al.(12).It has been asserted that these calculations,presented in congressional testi-mony in 1988(13),turned out to be ‘‘wrong by 300%’’(14).That assertion,posited in a popular novel,warrants assessment because the author’s views on global warming have been welcomed in testimony to the United States Senate (15)and in a meeting with the President of the United States (16),at a time when the Earth may be nearing a point of dangerous human-made interference with climate (17).The congressional testimony in 1988(13)included a graph (Fig.2)of simulated global temperature for three scenarios (A,B,and C)and maps of simulated temperature change for scenario B.The three scenarios were used to bracket likely possibilities.Scenario A was described as ‘‘on the high side of reality,’’because it assumed rapid exponential growth of GHGs and it included no large volcanic eruptions during the next half century.Scenario C was described as ‘‘a more drastic curtailment of emissions than has generally been imagined,’’specifically GHGs were assumed to stop increasing after 2000.Intermediate scenario B was described as ‘‘the most plausi-ble.’’Scenario B has continued moderate increase in the rate of GHG emissions and includes three large volcanic eruptions sprin-kled through the 50-year period after 1988,one of them in the 1990s.Real-world GHG climate forcing (17)so far has followed a course closest to scenario B.The real world even had one large volcanic eruption in the 1990s,Mount Pinatubo in 1991,whereas scenario B placed a volcano in 1995.Fig.2compares simulations and observations.The red curve,as in ref.12,is the updated Goddard Institute for Space Studies observational analysis based on meteorological stations.The black curve is the land–ocean global temperature index from Fig.1,which uses SST changes for ocean areas (5,6).The land–ocean temper-ature has more complete coverage of ocean areas and yields slightly smaller long-term temperature change,because warming on aver-age is less over ocean than over land (Fig.1B ).Temperature change from climate models,including that re-ported in 1988(12),usually refers to temperature of surface air over both land and ocean.Surface air temperature change in a warming climate is slightly larger than the SST change (4),especially in regions of sea ice.Therefore,the best temperature observation for comparison with climate models probably falls between the mete-orological station surface air analysis and the land–ocean temper-ature index.Observed warming (Fig.2)is comparable to that simulated for scenarios B and C,and smaller than that for scenario A.Following refs.18and 14,let us assess ‘‘predictions’’by comparing simulated and observed temperature change from 1988to the most recent year.Modeled 1988–2005temperature changes are 0.59,0.33,and 0.40°C,respectively,for scenarios A,B,and C.Observed temper-ature change is 0.32°C and 0.36°C for the land–ocean index and meteorological station analyses,respectively.Warming rates in the model are 0.35,0.19,and 0.24°C per decade for scenarios A,B.and C,and 0.19and 0.21°C per decade for the observational analyses.Forcings in scenarios B and C are nearly the same up to 2000,so the different responses provide one measure of unforced variability in the model.Because of this chaotic variability,a 17-year period is too brief for precise assessment of model predictions,but distinction among scenarios and comparison with the real world will become clearer within a decade.Close agreement of observed temperature change with simula-tions for the most realistic climate forcing (scenario B)is accidental,given the large unforced variability in both model and real world.Indeed,moderate overestimate of global warming is likely because the sensitivity of the model used (12),4.2°C for doubled CO 2,is larger than our current estimate for actual climate sensitivity,which is 3Ϯ1°C for doubled CO 2,based mainly on paleoclimate data (17).More complete analyses should include other climate forcingsandFig.1.Surface temperature anomalies relative to 1951–1980from surface air measurements at meteorological stations and ship and satellite SST measurements.(A )Global annual mean anomalies.(B )Temperature anomaly for the first half decade of the 21stcentury.Annual Mean Global Temperature Change: ΔT s (°C)Fig.2.Global surface temperature computed for scenarios A,B,and C (12),compared with two analyses of observational data.The 0.5°C and 1°C tempera-ture levels,relative to 1951–1980,were estimated (12)to be maximum global temperatures in the Holocene and the prior interglacial period,respectively.Hansen et al.PNAS ͉September 26,2006͉vol.103͉no.39͉14289E N V I R O N M E N T A L S C I E N C EScover longer periods.Nevertheless,it is apparent that the first transient climate simulations (12)proved to be quite accurate,certainly not ‘‘wrong by 300%’’(14).The assertion of 300%error may have been based on an earlier arbitrary comparison of 1988–1997observed temperature change with only scenario A (18).Observed warming was slight in that 9-year period,which is too brief for meaningful comparison.Super El Niños.The 1983and 1998El Niños were successivelylabeled ‘‘El Niño of the century,’’because the warming in the Eastern Equatorial Pacific (EEP)was unprecedented in 100years (Fig.3).We suggest that warming of the Western Equatorial Pacific (WEP),and the absence of comparable warming in the EEP,has increased the likelihood of such ‘‘super El Niños.’’In the ‘‘normal’’(La Niña)phase of El Niño Southern Oscillation the east-to-west trade winds push warm equatorial surface water to the west such that the warmest SSTs are located in the WEP near Indonesia.In this normal state,the thermocline is shallow in the EEP,where upwelling of cold deep water occurs,and deep in the WEP (figure 2of ref.20).Associated with this tropical SST gradient is a longitudinal circulation pattern in the atmosphere,the Walker cell,with rising air and heavy rainfall in the WEP and sinking air and drier conditions in the EEP.The Walker circulation enhances upwelling of cold water in the East Pacific,causing a powerful positive feedback,the Bjerknes (21)feedback,which tends to maintain the La Niña phase,as the SST gradient and resulting higher pressure in the EEP support east-to-west trade winds.This normal state is occasionally upset when,by chance,the east-to-west trade winds slacken,allowing warm water piled up in the west to slosh back toward South America.If the fluctuation is large enough,the Walker circulation breaks down and the Bjerknes feedback loses power.As the east-to-west winds weaken,the Bjerknes feedback works in reverse,and warm waters move more strongly toward South America,reducing the thermocline tilt and cutting off upwelling of cold water along the South American coast.In this way,a classical El Niño is born.Theory does not provide a clear answer about the effect of global warming on El Niños (19,20).Most climate models yield either a tendency toward a more El Niño-like state or no clear change (22).It has been hypothesized that,during the early Pliocene,when the Earth was 3°C warmer than today,a permanent El Niño condition existed (23).We suggest,on empirical grounds,that a near-term global warming effect is an increased likelihood of strong El Niños.Fig.1B shows an absence of warming in recent years relative to 1951–1980in the equatorial upwelling region off the coast of South America.This is also true relative to the earliest period of SST data,1870–1900(Fig.3A ).Fig.7,which is published as supporting information on the PNAS web site,finds a similar result for lineartrends of SSTs.The trend of temperature minima in the East Pacific,more relevant for our purpose,also shows no equatorial warming in the East Pacific.The absence of warming in the EEP suggests that upwelling water there is not yet affected much by global warming.Warming in the WEP,on the other hand,is 0.5–1°C (Fig.3).We suggest that increased temperature difference between the near-equatorial WEP and EEP allows the possibility of increased temperature swing from a La Niña phase to El Niño,and that this is a consequence of global warming affecting the WEP surface sooner than it affects the deeper ocean.Fig.3B compares SST anomalies (12-month running means)in the WEP and EEP at sites (marked by circles in Fig.3A )of paleoclimate data discussed below.Absolute temperatures at these sites are provided in Fig.8,which is published as supporting information on the PNAS web site.Even though these sites do not have the largest warming in the WEP or largest cooling in the EEP,Fig.3B reveals warming of the WEP relative to the EEP [135-year changes,based on linear trends,are ϩ0.27°C (WEP)and Ϫ0.01°C (EEP)].The 1983and 1998El Niños in Fig.3B are notably stronger than earlier El Niños.This may be partly an artifact of sparse early data or the location of data sites,e.g.,the late 1870s El Niño is relatively stronger if averages are taken over Niño 3or a 5°ϫ10°box.Nevertheless,‘‘super El Niños’’clearly were more abundant in the last quarter of the 20th century than earlier in the century.Global warming is expected to slow the mean tropical circulation (24–26),including the Walker cell.Sea level pressure data suggest a slowdown of the longitudinal wind by Ϸ3.5%in the past century (26).A relaxed longitudinal wind should reduce the WEP–EEP temperature difference on the broad latitudinal scale (Ϸ10°N to 15°S)of the atmospheric Walker cell.Observed SST anomalies are consistent with this expectation,because the cooling in the EEP relative to WEP decreases at latitudes away from the narrower region strongly affected by upwelling off the coast of Peru (Fig.3A ).Averaged over 10°N to 15°S,observed warming is as great in the EEP as in the WEP (see also Fig.7).We make no suggestion about changes of El Niño frequency,and we note that an abnormally warm WEP does not assure a strong El Niño.The origin and nature of El Niños is affected by chaotic ocean and atmosphere variations,the season of the driving anomaly,the state of the thermocline,and other factors,assuring that there will always be great variability of strength among El Niños.Will increased contrast between near-equatorial WEP and EEP SSTs be maintained or even increase with more global warming?The WEP should respond relatively rapidly to increasing GHGs.In the EEP,to the extent that upwelling water has not been exposed to the surface in recent decades,little warming is expected,andtheBSST Change (°C) from 1870-1900 to 2001-2005Western and Eastern Pacific Temperature Anomalies (°C)parison of SST in West and East Equatorial Pacific Ocean.(A )SST in 2001–2005relative to 1870–1900,from concatenation of two data sets (5,6),as described in the text.(B )SSTs (12-month running means)in WEP and EEP relative to 1870–1900means.14290͉ ͞cgi ͞doi ͞10.1073͞pnas.0606291103Hansen etal.contrast between WEP and EEP may remain large or increase in coming decades.Thus,we suggest that the global warming effect on El Niños is analogous to an inferred global warming effect on tropical storms (27).The effect on frequency of either phenomenon is unclear,depending on many factors,but the intensity of the most powerful events is likely to increase as GHGs increase.In this case,slowing the growth rate of GHGs should diminish the probability of both super El Niños and the most intense tropical storms.Estimating Dangerous Climate ChangeModern vs.Paleo Temperatures.Modern SST measurements (5,6)are compared with proxy paleoclimate temperature (28)in the WEP (Ocean Drilling Program Hole 806B,0°19ЈN,159°22ЈE;site circled in Fig.3A )in Fig.4A .Modern data are from ships and buoys for 1870–1981(6)and later from satellites (5).In concatenation of satellite and ship data,as shown in Fig.8A ,the satellite data are adjusted down slightly so that the 1982–1992mean matches the mean ship data for that period.The paleoclimate SST,based on Mg content of foraminifera shells,provides accuracy to Ϸ1°C (29).Thus we cannot be sure that we have precisely aligned the paleo and modern temperature scales.Accepting paleo and modern temperatures at face value implies a WEP 1870SST in the middle of its Holocene range.Shifting the scale to align the 1870SST with the lowest Holocene value raises the paleo curve by Ϸ0.5°C.Even in that case,the 2001–2005WEPSST is at least as great as any Holocene proxy temperature at that location.Coarse temporal resolution of the Holocene data,Ϸ1,000years,may mask brief warmer excursions,but cores with higher resolution (29)suggest that peak Holocene WEP SSTs were not more than Ϸ1°C warmer than in the late Holocene,before modern warming.It seems safe to assume that the SST will not decline this century,given continued increases of GHGs,so in a practical sense the WEP temperature is at or near its highest level in the Holocene.Fig.5,including WEP data for the past 1.35million years,shows that the current WEP SST is within Ϸ1°C of the warmest intergla-cials in that period.The Tropical Pacific is a primary driver of the global atmosphere and ocean.The tropical Pacific atmosphere–ocean system is the main source of heat transported by both the Pacific and Atlantic Oceans (2).Heat and water vapor fluxes to the atmosphere in the Pacific also have a profound effect on the global atmosphere,as demonstrated by El Niño Southern Oscillation climate variations.As a result,warming of the Pacific has worldwide repercussions.Even distant local effects,such as thinning of ice shelves,are affected on decade-to-century time scales by subtropical Pacific waters that are subducted and mixed with Antarctic Intermediate Water and thus with the Antarctic Circumpolar Current.The WEP exhibits little seasonal or interannual variability of SST,typically Ͻ1°C,so its temperature changes are likely to reflect large scale processes,such as GHG warming,as opposed to small scale processes,such as local upwelling.Thus,record Holocene WEP temperature suggests that global temperature may also be at its highest level.Correlation of local and global temperature change for 1880–2005(Fig.9,which is published as supporting information on the PNAS web site)confirms strong positive correlation of global and WEP temperatures,and an even stronger correlation of global and Indian Ocean temperatures.The Indian Ocean,due to rapid warming in the past 3–4decades,is now warmer than at any time in the Holocene,independent of any plausible shift of the modern temperature scale relative to the paleoclimate data (Fig.4C ).In contrast,the EEP (Fig.4B )and perhaps Central Antarctica (Vostok,Fig.4D )warmed less in the past century and are probably cooler than their Holocene peak values.However,as shown in Figs.1B and 3A ,those are exceptional regions.Most of the world and the global mean have warmed as much as the WEP and Indian Oceans.We infer that global temperature today is probably at or near its highest level in the Holocene.Fig.5shows that recent warming of the WEP has brought its temperature within Ͻ1°C of its maximum in the past million years.There is strong evidence that the WEP SST during the penultimate interglacial period,marine isotope stage (MIS)5e,exceeded the WEP SST in the Holocene by 1–2°C (30,31).This evidence is consistent with data in Figs.4and 5and with our conclusion that the Earth is now within Ϸ1°C of its maximum temperature in the past million years,because recent warming has lifted the current temperature out of the prior Holocenerange.parison of modern surface temperature measurements with paleoclimate proxy data in the WEP (28)(A ),EEP (3,30,31)(B ),Indian Ocean (40)(C ),and Vostok Antarctica (41)(D).Fig.5.Modern sea surface temperatures (5,6)in the WEP compared with paleoclimate proxy data (28).Modern data are the 5-year running mean,while the paleoclimate data has a resolution of the order of 1,000years.Hansen et al.PNAS ͉September 26,2006͉vol.103͉no.39͉14291E N V I R O N M E N T A L S C I E N C ESCriteria for Dangerous Warming.The United Nations FrameworkConvention on Climate Change (www.unfccc.int)has the objective ‘‘to achieve stabilization of GHG concentrations’’at a level pre-venting ‘‘dangerous anthropogenic interference’’(DAI)with cli-mate,but climate change constituting DAI is undefined.We suggest that global temperature is a useful metric to assess proximity to DAI,because,with knowledge of the Earth’s history,global tem-perature can be related to principal dangers that the Earth faces.We propose that two foci in defining DAI should be sea level and extinction of species,because of their potential tragic consequences and practical irreversibility on human time scales.In considering these topics,we find it useful to contrast two distinct scenarios abbreviated as ‘‘business-as-usual’’(BAU)and the ‘‘alternative scenario’’(AS).BAU has growth of climate forcings as in intermediate or strong Intergovernmental Panel on Climate Change scenarios,such as A1B or A2(10).CO 2emissions in BAU scenarios continue to grow at Ϸ2%per year in the first half of this century,and non-CO 2positive forcings such as CH 4,N 2O,O 3,and black carbon (BC)aerosols also continue to grow (10).BAU,with nominal climate sensitivity (3Ϯ1°C for doubled CO 2),yields global warming (above year 2000level)of at least 2–3°C by 2100(10,17).AS has declining CO 2emissions and an absolute decrease of non-CO 2climate forcings,chosen such that,with nominal climate sensitivity,global warming (above year 2000)remains Ͻ1°C.For example,one specific combination of forcings has CO 2peaking at 475ppm in 2100and a decrease of CH 4,O 3,and BC sufficient to balance positive forcing from increase of N 2O and decrease of sulfate aerosols.If CH 4,O 3,and BC do not decrease,the CO 2cap in AS must be lower.Sea level implications of BAU and AS scenarios can be consid-ered in two parts:equilibrium (long-term)sea level change and ice sheet response time.Global warming Ͻ1°C in AS keeps tempera-tures near the peak of the warmest interglacial periods of the past million years.Sea level may have been a few meters higher than today in some of those periods (10).In contrast,sea level was 25–35m higher the last time that the Earth was 2–3°C warmer than today,i.e.,during the Middle Pliocene about three million years ago (32).Ice sheet response time can be investigated from paleoclimate evidence,but inferences are limited by imprecise dating of climate and sea level changes and by the slow pace of weak paleoclimate forcings compared with stronger rapidly increasing human-made forcings.Sea level rise lagged tropical temperature by a few thousand years in some cases (28),but in others,such as Meltwater Pulse 1A Ϸ14,000years ago (33),sea level rise and tropical temperature increase were nearly synchronous.Intergovernmental Panel on Climate Change (10)assumes negligible contribution to 2100sea level change from loss of Greenland and Antarctic ice,but that conclusion is implausible (17,34).BAU warming of 2–3°C would bathe most of Greenland and West Antarctic in melt-water during lengthened melt seasons.Multiple positive feedbacks,in-cluding reduced surface albedo,loss of buttressing ice shelves,dynamical response of ice streams to increased melt-water,and lowered ice surface altitude would assure a large fraction of the equilibrium ice sheet response within a few centuries,at most (34).Sea level rise could be substantial even in the AS,Ϸ1m per century,and cause problems for humanity due to high population in coastal areas (10).However,AS problems would be dwarfed by the disastrous BAU,which could yield sea level rise of several meters per century with eventual rise of tens of meters,enough to transform global coastlines.Extinction of animal and plant species presents a picture anal-ogous to that for sea level.Extinctions are already occurring as a result of various stresses,mostly human-made,including climate change (35).Plant and animal distributions are a reflection of the regional climates to which they are adapted.Thus,plants and animals attempt to migrate in response to climate change,but theirpaths may be blocked by human-constructed obstacles or natural barriers such as coastlines.A study of 1,700biological species (36)found poleward migration of 6km per decade and vertical migration in alpine regions of 6m per decade in the second half of the 20th century,within a factor of two of the average poleward migration rate of surface isotherms (Fig.6A )during 1950–1995.More rapid warming in 1975–2005yields an average isotherm migration rate of 40km per decade in the Northern Hemisphere (Fig.6B ),exceeding known paleoclimate rates of change.Some species are less mobile than others,and ecosystems involve interactions among species,so such rates of climate change,along with habitat loss and fragmentation,new invasive species,and other stresses are expected to have severe impact on species survival (37).The total distance of isotherm migration,as well as migration rate,affects species survival.Extinction is likely if the migration distance exceeds the size of the natural habitat or remaining habitat fragment.Fig.6shows that the 21st century migration distance for a BAU scenario (Ϸ600km)greatly exceeds the average migration distance for the AS (Ϸ100km).It has been estimated (38)that a BAU global warming of 3°C over the 21st century could eliminate a majority (Ϸ60%)of species on the planet.That projection is not inconsistent with mid-century BAU effects in another study (37)or scenario sensitivity of stress effects (35).Moreover,in the Earth’s history several mass extinc-tions of 50–90%of species have accompanied global temperature changes of Ϸ5°C (39).We infer that even AS climate change,which would slow warming to Ͻ0.1°C per decade over the century,would contribute to species loss that is already occurring due to a variety of stresses.However,species loss under BAU has the potential to be truly disastrous,conceivably with a majority of today’s plants and animals headed toward extermination.DiscussionThe pattern of global warming (Fig.1B )has assumed expected characteristics,with high latitude amplification and larger warming over land than over ocean,as GHGs have become the dominant climate forcing in recent decades.This pattern results mainly from the ice–snow albedo feedback and the response times of ocean andland.Fig.6.Poleward migration rate of isotherms in surface observations (A and B )and in climate model simulations (17)for 2000–2100for Intergovernmental Panel on Climate Change scenario A2(10)and an alternative scenario of forcings that keeps global warming after 2000less than 1°C (17)(C and D ).Numbers in upper right are global means excluding the tropical band.14292͉ ͞cgi ͞doi ͞10.1073͞pnas.0606291103Hansen etal.。
全球变暖英文THEGLOBALWARMING

So, how to save our home, how to protect us from the bad disaster?
China had promised at Copenhagen that would cut down greenhouse gas emissions ,as Chinese, we do have so much could do. let alone as a human.
First as well as the most important is plant trees as much as we can. Trees can hold water build topsoil. especial mangrove forests, as one kind of swamp trees, it can be called miracle whereon prevent and control flood, on the other hand, protecting extant plants is also important, such as Amazon Rainforest, as the lung of earth, it’s too important too cherish.
Unit+3+Environmental+Protection+R人教版(2019)选择性必修第三册

Lucid waters and lush mountains are valuable as "mountains of gold and silver".
little doubt that Earth is getting warmer and warmer (see the
graph). A warming ocean and atmosphere along with melting
ice and rising sea levels provide evidence of a dramatic change
本句是复合句。There is little/no doubt that... “毫 无疑问...”,that引导同位语从句,解释说明doubt的 具体内容。
There is little doubt about/whether... 对/对是否...有 些疑问。
I doubt whether/if... 我怀疑是否... I don’t doubt that... 我确信...
Find out the topic sentence of each paragraph.
Part 1 problem
Q. What evidence of climate change can you find in the first paragraph?
Evidence: ①_a_w__a_r_m_i_n_g__o_ce_a_n_ ___a_n_d__a_tm__o_s_p_h_e_r_e_ ②_m__e_l_ti_n_g_i_c_e__ ③__r_is_i_n_g_s_e_a_l_e_v_e_l _
全球变化(Globalchange)及其对策—全球温暖化及对策

温室气体Greenhouse Gases
▪ 问题:温室气体有哪些? ▪ 在剩下的1%左右的大气中有小局部: ▪ 二氧化碳Carbon dioxide ▪ 甲烷Methane ▪ 一氧化二氮Nitrous oxide ▪ 臭氧Ozone ▪ 水蒸汽Water vapour ▪ 卤烃Halocarbons
▪ 1996,可区分的人类对气候的影响 "discernible human influence on the climate"
关于全球气候变化的关键点:
▪ 全球温度在过去300年上升超过了0.7℃,因此 气候变化已经发生。20世纪温度增加了 0.5℃。 最严重的变暖发生在 1910—1940年间和1976年 至今。
主要内容
1. 全球变化的起因与内容 2. 大气成分的变化 3. 温室效应及生态影响、 4. 全球温暖化的对策 5. 行动起来
全球变化〔Global Change〕的定义
▪ 全球变化是指改变我们的生物、社会和体制 等环境的各种因素,主要是人为因素。这些 因素正在导致物理性或者生物性的改变,例 如气候变化或海平面上升
2 大气成分的变化
▪ 温室气体的种类与特点 ▪ CO2浓度的变化 ▪ CH4浓度的变化 ▪ N2O浓度的变化 ▪ HFCS浓度的变化 ▪ PFCS类浓度的变化 ▪ SF6
温室气体Greenhouse Gases
▪ 温室气体使地球保持温暖 ▪ 如果没有温室气体,地球会比现在低30度 ▪ 大气的 99%由 78%氮气nitrogen和21%氧气
Emissions 8 Total 7 Liquid fuel
6 Solid fuel Gas fuel
各个国家的四季和全球气温变化 英语作文

Seasons Across the Globe and GlobalTemperature ChangesThe Earth,our shared home,experiences diverse climates and seasonal variations across different regions,each with its own unique characteristics and impacts on global temperature trends.Let us embark on a journey to explore the four seasons in various countries and the evolving patterns of global temperature change.Spring heralds the awakening of life in many parts of the world.In countries like Japan, cherry blossoms adorn the landscape,painting a breathtaking tableau of delicate pink hues.In contrast,Australia welcomes autumn during this time,with golden leaves adorning its forests and cool breezes tempering the summer heat.Summer arrives with its warmth and abundance,bringing long days and balmy nights to regions such as Italy,where sun-drenched beaches and bustling piazzas beckon visitors from far and wide.Meanwhile,countries like Argentina experience the chill of winter,with snow-capped mountains offering a playground for skiing enthusiasts.Autumn,a season of transition and transformation,paints the landscapes of countries like Canada with a riot of fiery colors as leaves change hues before gracefully drifting to the ground. In contrast,countries near the equator,such as Indonesia,experience relatively stable temperatures year-round,with little variation between seasons.Winter blankets parts of the Northern Hemisphere in snow and ice,creating a winter wonderland in countries like Norway,where the dazzling Northern Lights dance across the night sky.Meanwhile,countries in the Southern Hemisphere,like South Africa,enjoy the warmth of summer,with clear skies and balmy temperatures inviting outdoor adventures.Despite the beauty and diversity of the Earth's seasons,the planet is facing unprecedented challenges due to climate change.Rising global temperatures,attributed largely to human activities,are causing shifts in weather patterns,more frequent extreme weather events,and disruptions to ecosystems worldwide.To combat climate change and protect our planet for future generations,concerted efforts are needed at local,national,and international levels.Through sustainable practices,renewable energy solutions,and collective action,we can work together to mitigate the impacts of climate change and create a more resilient and sustainable world for all.In conclusion,while each country experiences the four seasons in its own unique way,the global climate is undergoing significant changes due to human-induced climate change.By understanding and addressing these challenges,we can strive to safeguard the Earth's natural beauty and ensure a sustainable future for generations to come.。
托福阅读完全没必要逐字分析
托福阅读完全没必要逐字分析托福阅读完全没必要逐字分析。
时间很重要,在托福阅读中就更加重要。
所以不需要逐字逐句的将托福阅读弄懂,很多时候,即使遇到陌生的词,根据上下文甚至自己的一些常识,也不会影响对文章的理解。
一起来看看下文吧!托福阅读完全没必要逐字分析科学的托福考试方法关于阅读方法本文只是对在有限时间内有效阅读托福文章的方法进行一个简单的介绍。
阅读技巧,特别是速度技巧中,有两个重要的方法:Skimming&Scanning.Skimming是只看主要大意的速读。
一篇文章的大意是有重点的。
比如,当出现first second的这种归类总结的地方,或because,as a result这样的因果关系,或是 but,however的语意转折处,都需要格外留心。
托福文章讲述主要观点之后通常会有for example来佐证,如果看懂了主要观点,那么对示例所用的时间和精力就不需要太多了。
Skimming的技巧在第一遍阅读文章意图抓住文章大意时是非常重要的。
Scanning是“扫描”,但具体到阅读中,大家最熟悉的莫过于查词典时。
在有意识地去查某个生词的时候,我们不会去把它所在的页上每一个字都看一遍才找到想要的。
几乎眼睛对词典中的一页扫一下,脑中只有要找的字,看到它,其他的地方都像没有看到一样。
在托福的阅读中,scanning的技巧在回答问题时,根据题干中问到的内容,在文章中scan,可以帮助考生准确地定位,找到答案。
以上两种是在托福阅读中最常用也是最有效的技巧。
托福的文章长度大多在300-400字之间。
以平均每篇读10分钟计算,按照每分钟阅读150字的速度,一篇文章从头到尾通读,至少需2-3分钟。
这可了解文章的大意,但不一定保证读得透彻。
在第一遍通读的过程中,考生不要期望每个字都一定要理解,遇到不懂的字不必多逗留或苦思冥想可能的意思,这样会浪费时间的。
只需一直往下看,用前面介绍到的skimming原则,掌握文章的主旨即可。
TOEFL托福阅读理解真题篇
TOEFL托福阅读理解真题篇托福阅读真题1Naturalists and casual observers alike have been struck by the specialrelationship between squirrels and acorns (the seeds of oak trees). Ecologists,though, cannot observe these energetic mammals scurrying up and down oak treesand eating and burying acorns without wondering about their comple_ relationshipwith trees. Are squirrels dispersers and planters of oak forests or pesky seedpredators? The answer is not simple. Squirrels may devour many acorns, but bystoring and failing to recover up to 74 percent of them as they do when seedsare abundant, these arboreal rodents can also aid regeneration and dispersal ofthe oaks.Their destructive powers are well umented. According to one report,squirrels destroyed tens of thousands of fallen acorns from an oak stand on theUniversity of Indiana campus. A professor there estimated that each of the largewhite oaks had produced between two and eight thousand acorns, but within weeksof seed maturity, hardly an intact acorn could be found among the fallen leaves.Deer, turkey, wild pigs, and bears also feed heavily on acorns, but do not storethem, and are therefore of no benefit to the trees. Flying squirrels, chipmunks,and mice are also unlikely to promote tree dispersal, as they often store seedsin tree cavities and underground burrows. Only squirrels —whose behavior ofcaching (hiding) acorns below the leaf litter — often promote successfulgermination of acorns, and perhaps blue jays, important long-distancedispersers, seem to help oaks spread and reproduce.Among squirrels, though, there is a particularly puzzling behavior pattern.Squirrels pry off the caps of acorns, bite through the shells to get at thenutritious inner kernels, and then discard them half-eaten. The ground undertowering oaks is often littered with thousands of half-eaten acorns, each oneonly bitten from the top. Why would any animal waste so much time and energy andrisk e_posure to such predators as red-tail hawks only to leave a large part ofeach acorn uneaten? While research is not conclusive at this point, one thingthat is certain is that squirrels do hide some of the uneaten portions, andthese acorn halves, many of which contain the seeds, may later germinate.1. What does the passage mainly discuss?(A) The ecology of oak trees(B) Factors that determine the feeding habits of Squirrels(C) Various species of animals that promote the dispersal of tree seeds(D) The relationship between squirrels and oak trees2. The word they in line 7 refers to(A) oak forests(B) acorns(C) squirrels(D) predators3. According to the passage , what do squirrels do when large quantities ofacorns are available?(A) They do not store acorns.(B) They eat more than 74 percent of available acorns.(C) They do not retrieve all the acorns that they have stored.(D) They hide acorns in tree cavities.4. The word estimated in line _ is closest in meaning to(A) commented(B) judged(C) observed(D) discovered5. Why does the author mention the University of Indiana campus in line 10-_?(A) to provide evidence that intact acorns are hard to find under oaktrees(B) to indicate a place where squirrels can aid seed dispersal of oaks(C) to argue in favor of additional studies concerning the destructiveforce of squirrels(D) to support the claim that squirrels can do great damage to oakstands6. It can be inferred from paragraph 3 that chipmunks do not aid in thedispersal of oak treesbecause(A) they store their acorns where they cannot germinate(B) they consume most of their stored acorns(C) their stored acorns are located and consumed by other species(D) they cannot travel the long distance required for dispersal7. According to the passage , which of the following do squirrels and bluejays have in common?(A) They travel long distances to obtain acorns.(B) They promote the reproduction of oak trees.(C) They bury acorns under fallen leaves.(D) They store large quantities of acorns.8. The phrase pry off in line _ is closest in meaning to(A) swallow(B) remove(C) squeeze(D) locate9. The word littered in line _ is closest in meaning to(A) covered(B) displayed(C) fertilized(D) planted10. According to the passage , scientists cannot e_plain which of thefollowing aspects of squirrelbehavior?(A) Where squirrels store their acorn caches(B) Why squirrels prefer acorns over other seeds(C) Why squirrels eat only a portion of each acorn they retrieve(D) Why squirrels prefer acorns from a particular species of oak trees PASSAGE 98 DCCBD DBBAC托福阅读真题2Scientists have discovered that for the last _0,000 years, at least, therehas been a consistent relationship between the amount of carbon dio_ide in theair and the average temperature of the planet. The importance of carbon dio_idein regulating the Earth s temperature was confirmed by scientists working ineastern Antarctica. Drilling down into a glacier, they e_tracted amile-longcylinder of ice from the hole. The glacier had formed as layer upon layer ofsnow accumulated year after year. Thus drilling into the ice was tantamount todrilling back through time.The deepest sections of the core are composed of water that fell as snow_0,000 years ago. Scientists in Grenoble, France, fractured portions of thecore and measured the composition of ancient air released from bubbles in theice. Instruments were used to measure the ratio of certain isotopes in thefrozen water to get an idea of the prevailing atmospheric temperature at thetime when that particular bit of water became locked in the glacier.The result is a remarkable unbroken record of temperature and ofatmospheric levels of carbon dio_ide. Almost every time the chill of an ice agedescended on the planet, carbon dio_ide levels dropped. When the globaltemperature dropped 9 F (5 C°), carb°on dio_ide levels dropped to _0 parts permillion or so. Generally, as each ice age ended and the Earth basked in a warminterglacial period, carbon dio_ide levels were around 280 parts per million.Through the _0,000 years of that ice record, the level of carbon dio_ide in theatmosphere fluctuated between _0 and 280 parts per million, but never rose muchhigher-until the Industrial Revolution beginning in the eighteenth century andcontinuing today.There is indirect evidence that the link between carbon dio_ide levels andglobal temperature change goes back much further than the glacial record. Carbondio_ide levels may have been much greater than the current concentration duringthe Carboniferous period, 360 to 285 million years ago. The period was named fora profusion of plant life whose buried remains produced a large fraction of thecoal deposits that are being brought to the surface and burned today.1. Which of the following does the passage mainly discuss?(A) Chemical causes of ice ages(B) Techniques for studying ancient layers of ice in glaciers(C) Evidence of a relationship between levels of carbon dio_ide and globaltemperature(D) Effects of plant life on carbon dio_ide levels in the atmosphere2. The word accumulated in line 6 is closest in meaning to.(A) spread out(B) changed(C) became denser(D) built up3. According to the passage , the drilling of the glacier in easternAntarctica was importantbecause it(A) allowed scientists to e_periment with new drilling techniques(B) permitted the study of surface temperatures in an ice-covered region ofEarth(C) provided insight about climate conditions in earlier periods(D) confirmed earlier findings about how glaciers are formed4. The phrase tantamount to in line 7 is closest in meaning toA) complementary to(B) practically the same as(C) especially well suited to(D) unlikely to be confused with5. According to the passage , Grenoble, France, is the place where(A) instruments were developed for measuring certain chemical elements(B) scientists first recorded atmospheric levels of carbon dio_ide(C) scientists studied the contents of an ice core from Antarctica(D) the relationship between carbon dio_ide and temperature wasdiscovered6. According to the passage , scientists used isotopes from the water ofthe ice core to determinewhich of following?(A) The amount of air that had bubbled to the surface since the ice hadformed(B) The temperature of the atmosphere when the ice was formed(C) The date at which water had become locked in the glacier(D) The rate at which water had been frozen in the glacier7. The word remarkable in line _ is closest in meaning to(A) genuine(B) permanent(C) e_traordinary(D) continuous8. The word link in line 23 is closest in meaning to(A) tension(B) connection(C) attraction(D) distance9. The passage implies that the warmest temperatures among the periodsmentioned occurred(A) in the early eighteenth century(B) _0,000 years ago(C) at the end of each ice age(D) between 360 and 285 million years ago10. According to the passage , the Carboniferous period was characterizedby(A) a reduction in the number of coal deposits(B) the burning of a large amount of coal(C) an abundance of plants(D) an accelerated rate of glacier formation_. The passage e_plains the origin of which of the following terms?(A) glacier (line 5)(B) isotopes (line _)(C) Industrial Revolution (line _)(D) Carboniferous period (lines 26)PASSAGE 99 CDCBC BCBAC D托福阅读真题3Of all modern instruments, the violin is apparently one of the simplest. Itconsists in essence of a hollow, varnished wooden sound bo_, or resonator, and along neck, covered with a fingerboard, along which four strings are stretched athigh tension. The beauty of design, shape, and decoration is no accident: theproportions of the instrument are determined almost entirely by acousticalconsiderations. Its simplicity of appearance is deceptive. About 70 parts areinvolved in the construction of a violin. Its tone and its outstanding range ofe_pressiveness make it an ideal solo instrument. No less important, however, isits role as an orchestral and chamber instrument. In combination with the largerand deeper-sounding members of the same family, the violins form the nucleus ofthe modern symphony orchestra.The violin has been in e_istence since about _50. Its importance as aninstrument in its own right dates from the early _00 s, when it first becamestandard in Italian opera orchestras. Its stature as an orchestral instrumentwas raised further when in _26 Louis _III of France established at his courtthe orchestra known as Les vingt-quatre violins du Roy (The King s 24 Violins),which was to become widely famous later in the century.In its early history, the violin had a dull and rather quiet tone resultingfrom the fact that the strings were thick and were attached to the body of theinstrument very loosely. During the eighteenth and nineteenth century, e_citingtechnical changes were inspired by such composer-violinists as Vivaldi andTartini. Their instrumental compositions demanded a fuller, clearer, and morebrilliant tone that was produced by using thinner strings and a far higherstring tension. Small changes had to be made to the violin s internal structureand to the fingerboard so that they could withstand the e_tra strain.Accordingly, a higher standard of performance was achieved, in terms of bothfacility and interpretation. Left-hand technique was considerably elaborated,and new fingering patterns on the fingerboard were developed for very highnotes.1. The word standard in line _ is closest in meaning to(A) practical(B) customary(C) possible(D) unusual2. The King s 24 Violins is mentioned in line _ to illustrate(A) how the violin became a renowned instrument(B) the competition in the _00 s between French and Italian orchestras(C) the superiority of French violins(D) why the violin was considered the only instrument suitable to be playedby royalty3. What is the main idea presented in paragraph 3?(A) The violin has been modified to fit its evolving musical functions.(B) The violin is probably the best known and most widely distributedmusical instrument in theworld.(C) The violin had reached the height of its popularity by the middle ofthe eighteenth century.(D) The technique of playing the violin has remained essentially the samesince the _00 s.4. The author mentions Vivaldi and Tartini in line _ as e_amples ofcomposers whose music(A) inspired more people to play the violin(B) had to be adapted to the violin(C) demanded more sophisticated violins(D) could be played only by their students5. The word they in line _ refers to(A) Civaldi and Tartini(B) thinner strings and a higher string tension(C) small changes(D) internal structure and fingerboard6. The word strain in line _ is closest in meaning to(A) struggle(B) strength(C) strategy(D) stress7. The word Accordingly in line 23 is closest in meaning to(A) However(B) Consequently(C) Nevertheless(D) Ultimately8. According to the passage , early violins were different from modernviolins in that early violins(A) were heavier(B) broke down more easily(C) produced softer tones(D) were easier to play9. According to the passage , which of the following contributes to a dullsound being producedby a violin?(A) A long fingerboard(B) A small body(C) High string tension(D) Thick strings10. Which of the following terms is defined in the passage ?(A) resonator (line 2)(B) solo (line 7)(C) left-hand technique (line 25)(D) fingering patterns (lines 24-25)_. All of the following are mentioned in the passage as contributing tothe ability to play modernviolin music E_CEPT(A) more complicated techniques for the left hand(B) different ways to use the fingers to play very high notes(C) use of rare wood for the fingerboard and neck(D) minor alterations to the structure of the instrumentANSWER KEYS PASSAGE 100 BAACD DBCAA CTOEFL新政后阅读和听力的评分标准 TOEFL新政后阅读和听力的评分标准是怎样的!小编给大家带来了TOEFL新政后阅读和听力的。
全球气候变暖的危害1(Theharmofglobalwarming1)
全球气候变暖的危害1(The harm of global warming 1)There are two reasons for global warming: a large amount of coal, natural gas and so on produce a large number of greenhouse gases; wanton deforestation of virgin forests, so that the ability to absorb carbon dioxide decreased.The system of the atmosphere and the surface of the earth is like a giant "glass greenhouse" that keeps the surface temperature constant and produces an environment suitable for the survival of humans and other organisms. In this system, the atmosphere can not only let the solar radiation pass through the ground, but also prevent the loss of the ground radiation. The protective effect of the atmosphere on the ground is called the greenhouse effect of the atmosphere. Greenhouse gases are known as "greenhouse gases" that allow solar short wave radiation to pass freely and absorb long wave radiation from the earth's surface. These gases have carbon dioxide, methane, chlorofluorocarbons, ozone, nitrogen oxides and water vapor, among which carbon dioxide is the most important. The global climate has been warming up for the past 100 years, and meanwhile, the amount of greenhouse gases in the atmosphere has also increased dramatically. Many scientists believe that the greenhouse effect caused by a large amount of greenhouse gas emissions may be the underlying cause of global warming.Human activities that emit greenhouse gases include all fossil fuels, burning activities, and carbon dioxide emissions. In the fossil energy, coal was the highest, followed by oil, natural gas is relatively low; coal gas leakage in mining process of fossil fuel emissions of carbon dioxide and methane; cement, lime, chemical and other industrial production process ofcarbon dioxide emissions; paddy fields, cattle and other animal on anti digestion process of methane emissions from land use; changes to reduce the absorption of carbon dioxide and methane emissions; Nitrous Oxide.Human combustion of coal, oil, natural gas and trees produces large amounts of carbon dioxide and methane, which heats up the earth after entering the atmosphere, causing carbon cycle imbalances, and changing the energy conversion forms of the earth's biosphere. Since the industrial revolution, the carbon dioxide content in the atmosphere has increased by 25%, far exceeding the historical record that scientists have been able to survey over the past 160 thousand years, and there is no sign of slowing down.The main cause of global warming is that mankind has been using mineral fuels (such as coal, oil, etc.) for a century, emitting a large amount of carbon dioxide and other greenhouse gases. Because these greenhouse gases on the radiation from the sun wave through a highly, highly absorbent on the earth longwave radiation reflected, it is often said that the "greenhouse effect", leading to global warming.Forests in the world are divided into three types: boreal (boreal) forest, temperate forest and tropical forest. According to experts, today's forest ecosystem, is the nature of 8000 years of evolution is gradually formed.Today, all the virgin forests have become targets forlarge-scale exploitation of lumbering. In the tropics, many of the forests that have disappeared now have been cut off in thepast 50 years. Only from 1960 to 1990, there are more than 450 million hectares of tropical forest were swallowed, accounting for 20% of the total area of the world's tropical forests; there are millions of hectares of tropical deforestation, forest degradation in farmland reclamation and mineral exploitation.Moreover, the global illegal logging and illegal timber products trading continues to increase, especially in developing countries with tropical forests and Russia, which is poorly governed by the government. The demand for cheap wood products in the international market has further worsened the situation.The Intergovernmental Panel on climate change predicts that global temperatures will rise by about 1.4-5.8 degrees Celsius (2.5-10.4 degrees Fahrenheit) by 2100, according to climate models. According to this forecast, global temperatures will change dramatically over the past 10000 years, which has potentially significant implications for the global environment.HarmThere are about 40 small island developing countries and territories around the world. They are faced with many unfavorable situations, including the lack of resources, the isolation of the economy, the degradation of land and marine environment, and the possible rise of sea level due to climate change.At the request of the summit on earth issues, the United Nationsheld a global conference on sustainable development of small island developing States in Barbados in 1994". The conference stressed the economic and ecological vulnerability of small island developing countries, and adopted an agenda (Barbados agenda for sustainable development of small island developing countries). The agenda sets out the policies, actions and measures that governments and the international community need to support the sustainable development of these small island developing states.Zhang Piyuan, a researcher at the Institute of Geographic Sciences and natural resources, the Chinese Academy of Sciences, said: "global warming" has caused changes in the entire ecological environment. First of all, "global warming" lead to rising sea levels, rainfall redistribution, change the current world climate pattern; secondly, "global warming" destruction and influence of the chain and the food chain, causing more serious natural consequences. For example, there is a migratory bird who flies from Australia to Northeast China every summer. As the global warming increases the temperature in Northeast China and the summer is prolonged, the time of this bird leaving the Northeast becomes later, and the time to return to the Northeast will be delayed accordingly. As a result, a species of insect eaten by the migratory bird was flooded, destroying large tracts of forest. In addition, extreme events related to the environment, such as droughts, floods and so on, are increasing.Political restrictions on carbon dioxide emissions limit the consumption of energy, and will have a restrictive impact on the world. "Emission reduction" in developing countries, or"emission reduction" in developed countries has become the focus of discussion. As a developing country is a long body of children, need to consume energy to promote the growth of greenhouse gas emissions in developing countries continue to increase, in 2013 after the "emission reduction" problems will focus in developing countries. The scientific question of preventing global warming is bound to lead to the issue of "North-South relations", which has become an international political issue.The distribution of climate precipitation has also changed. The mainland especially the increase of precipitation in the high latitude areas, less precipitation in some regions of Africa. The occurrence frequency and intensity of extreme weather and climate events (El Nino, drought, floods, thunderstorms, hail, storms, hot weather and dust storms) in some areas are increasing.Ocean: as the global temperature rises, the amount of water vapor evaporated in the oceans has increased dramatically, exacerbating the warming phenomenon. The decrease of the total heat capacity of the oceans can also inhibit global warming. In addition, because the ocean releases excess CO2 into the atmosphere, the real culprit is the plankton community in the ocean.Impact of global warming on crop crop growth There are both advantages and disadvantages. First, the global temperature changes directly affect the global water cycle, causing droughts or floods in some areas, resulting in crop yield reduction, and the temperature is too high is not conducive toseed growth. Secondly, the increase of rainfall, especially in the arid areas, will positively promote the growth of crops. Global warming accompanied by elevated CO2 levels also contributes to crop photosynthesis and productivity.Global warming of clouds causes water content in the clouds to increase and absorb more infrared radiation. But scientists have also observed that tropical storm clouds rise to higher altitudes at higher temperatures, producing large amounts of rainfall, lowering the humidity in the troposphere and slowing the warming trend.The sea ice generally rise in temperature will accelerate the melting of snow and ice, increase water for the absorption of solar energy, but also contribute to global warming, sea ice will strengthen heat flux between air and sea, the lower the temperature.Human health (1) global warming led directly to parts of summer high temperature, because of heart disease and cause various diseases of the respiratory system, will take a lot of people's lives every year, with the greatest risk of neonatal and the elderly. (2) global warming causes ozone concentrations to rise, and low air ozone is a very dangerous pollutant that can damage lung tissue and cause asthma or other lung diseases. (3) global warming causes the spread of some infectious diseases.When the mosquito bites a person with an infectious virus, the virus will follow the blood into the mosquito body, begin to reproduce, and through the next bite into a healthy human body to complete the spread of the virus. In a certain temperaturerange, with the increase of temperature, the reproductive rate and biting rate of mosquitoes are greatly improved, and the virus reproduction and maturation rate will also increase. Night and winter temperatures rise, greatly extending the mosquito life and geographical areas, so that the spread of malaria, scarlet fever, jaundice, encephalitis and other malignant infectious diseases increased. (4) global warming will cause different natural disasters in different regions, directly led to food production, but also to the local residents suffered the threat of hunger and malnutrition, and will accelerate the diffusion rate of some water on the spread of the virus, such as encephalitis, dysentery, fever etc..。
全球变暖的原因和影响Causes and Effects of Global Warming英语作文
Causes and Effects of GlobalWarming>Causes and Effects of Global Warming Essay:The emissions of greenhouse gases have caused global warming. One of the many effects of global warming is that it has led to an increase in the planet’s temperatures.The leading cause of global warming is the release of harmful and toxic gases into the atmosphere. Some of the harmful gases include carbon dioxide and sulphur dioxide. These twogases are the main ones because of the burning of fossil fuels and industrial activities.There are various effects of global warming. Some of the results are acid rain, climate change and depletion of flora and fauna. Here in this article, we have provided short and long essays on Causes and Effects of Global Warming Essay in English. The essays have been written in simple yet effective English for your information and knowledge and aim to help during school assignments or a speech on Causes and Effects of Global Warming.Long and Short Essays on Causes and Effects of Global Warming for Students and Kids in EnglishWe provide children and students with essay samples on a long essay of 500 words and a short essay of 150 words on the topic “Causes and Effects of Global Warming” for reference.Short Essay on Causes and Effects of Global Warming 250 Words in EnglishShort Essay on Causes and Effects of Global Warming is usually given to classes 1, 2, 3, 4, 5, and 6.Global warming is one of the biggest concerns of people all around the world. One of the most important reasons is a concern because of the rising temperatures of the atmosphere every day.There are many reasons for the increasing temperature of the planet. One of the biggest reasons for global warming is the emission of harmful greenhouse gases in the atmosphere. Some greenhouse gases are carbon dioxide, nitrous oxide, chlorofluorocarbons, and methane.There has been continuous emission of the greenhouse gases by the activity of the humans. Some of the humans’ activities that cause globalwarming are increasing automobiles, industrial activities and burning of fossil fuels. All the activities emit carbon dioxide in the air, which increases the temperature of the planet. The effects of global warming are visible in the environment around us. It is causing glaciers to melt, temperatures to rise, climate changes and unpredictable natural disasters.The increase in environmental temperature and climate change on the planet has become evident in the last five decades. The concentration of the greenhouse gases in the atmosphere of the earth has increased.Gases like water vapour, carbon dioxide, methane, ozone, sulphur and nitrogen contribute to the greenhouse effect increase. People should come together and work toward solving the problem of global warming. The most significant cause of increasing greenhouse gases in the planet’s atmosphere is the burning of fossil fuels. These fossil fuels emit carbon dioxide in the environment, which leads to an increase in greenhouse gases. The greenhouse gases can absorb more heat from various sources and warm the temperature of the planet. The effects that the greenhouse gases have on the environment is called the greenhouse effect.When the environment starts to heat, it leads to changes in the atmospheric temperature and the changes in the sea level. Some of the changes in the atmosphere because of the greenhouse gases are melting of glaciers, soil erosion, famine, natural disasters, and the increase in the annual power of hurricanes. The changes in the environment that are affecting the lives of all the living creatures on the planet.Scientists and economists around the world are trying to find ways to reserve the changes of global warming. Many international organisations are trying to find ways to solve theproblem of worldwide warming and the effect that it is having on the environment.One such organisation working towards researching global warming is the Intergovernmental Panel on Climate Change (IPCC), an organisation under the United Nations. It is an organisation working towards studying the causes, effects and effects to practical solutions.Long Essay on Causes and Effects of Global Warming 800 Words in EnglishLong Essay on Causes and Effects of Global Warming is usually given to classes 7, 8, 9, and 10.Global warming is increasing every year because of the continuous emission of greenhouse gases. They trap heat from various sources like the sun, electricity, burning fossil fuels, and stop them from escaping back into the atmosphere. The collection of the greenhouses gases leads to the increase or rise in the temperature on earth. The increasing weather on the planet has caused many problems on earth.Earlier, the planet was cool, and the natural cycles in the climate were going correctly. However, the constant change in the environment due to global warming has caused the natural process to become irregular, and it keeps fluctuating. There are fluctuations in the weather, temperature, health and climate.The rising temperature leads to the melting of the ice glaciers. When the glaciers melt, they increase the sea level drastically. In the past few decades, there has been an increase in temperature, sea level and the weather patterns. The various climatic changes happening aroundus are because of global warming. These effects of global warming are not coincidences. They are happening because of the activities of humans and the technological advancement of humans.When there is a little increase in the amount of carbon dioxide emitted in the atmosphere, it causes a massive global temperature change. The continuous rise in the percentage of atmospheric carbon dioxide is dangerous and alarming because it is causing many changes.Many people are ignoring the changes in the environment. People continuously use morefossil fuels for their needs, and this is causing changes in the background. Due to the continuous burning of fossil fuels, the carbon dioxide emission in the air is increasing. This is leading to an increase in the temperature of the planet.Another cause of global warming is deforestation. It is causing the depletion of the plants, and it exposes the soil to direct sunlight. One of the best sources that absorb carbon dioxide is trees. However, due to the cutting of trees all around the planet, this source is depleting.Humans cut trees to make more space for human occupation in areas that should be forests. We deplete the green cover and are harming the environment. If there is a little increase in the level of greenhouses gases may impact global warming immensely.One of the major causes of global warming is the use of a chemical called chlorofluorocarbons. You will find the use of chlorofluorocarbons in refrigerators, and aerosols spray propellants and many other objects around you. These chlorofluorocarbons continuously damage the ozone layer, which increases the chance of theheat to remain on the planet. It is preventing the heat from escaping, which is increasing the temperature of the earth.The destruction of the ozone layer is due to the emission of chlorofluorocarbons. When the ozone layer starts depleting, it causes the change in the environments. It causes an increase in health disorders such as skin cancer, respiratory diseases, and respiratory problems.A significant effect of global warming is the damage it does to the seasonal crops and marine food. Marine life is facing the consequences of the changes in the climate asthe sea is heating up. The weather changes are drastic due to global warming. Summers are longer, and winters have shortened due to global warming. Many countries have banned the use of chlorofluorocarbons because of the effects that it has on the environment. Their ability to degrade the ozone layer and trap more heat than carbon dioxide is the main reason for the ban.There are many other causes of global warming. One of the causes of global warming is the emission of carbon dioxide by cars and other vehicles. The amount of carbon dioxide that isemitted by cars causes serious harm to the environment. In all the countries around the world, there has been an increase in the number of vehicles on the road. However, there has been a change because of the introduction of electric cars.An effect of global warming is the significant fluctuations in the weather change. There is going to be an extreme change in the weather because of global warming. It is leading to permanent changes in the climate. Another effect of global warming is ice melting. Globalwarming is causing the ice in the two poles of the planet to melt.The scientists are continuously working towards finding ways to reduce greenhouse gas emissions and save the environment. Climate change and global warming are one of the things that most countries are trying to reverse. The increase in the emission of greenhouse gases is causing many problems in the environment.。
- 1、下载文档前请自行甄别文档内容的完整性,平台不提供额外的编辑、内容补充、找答案等附加服务。
- 2、"仅部分预览"的文档,不可在线预览部分如存在完整性等问题,可反馈申请退款(可完整预览的文档不适用该条件!)。
- 3、如文档侵犯您的权益,请联系客服反馈,我们会尽快为您处理(人工客服工作时间:9:00-18:30)。
Global temperature changeJames Hansen*†‡,Makiko Sato*†,Reto Ruedy*§,Ken Lo*§,David W.Lea ¶,and Martin Medina-Elizade ¶*National Aeronautics and Space Administration Goddard Institute for Space Studies,†Columbia University Earth Institute,and §Sigma Space Partners,Inc.,2880Broadway,New York,NY 10025;and ¶Department of Earth Science,University of California,Santa Barbara,CA 93106Contributed by James Hansen,July 31,2006Global surface temperature has increased Ϸ0.2°C per decade in the past 30years,similar to the warming rate predicted in the 1980s in initial global climate model simulations with transient greenhouse gas changes.Warming is larger in the Western Equatorial Pacific than in the Eastern Equatorial Pacific over the past century,and we suggest that the increased West–East temperature gradient may have increased the likelihood of strong El Niños,such as those of 1983and parison of measured sea surface temperatures in the Western Pacific with paleoclimate data suggests that this critical ocean region,and probably the planet as a whole,is approximately as warm now as at the Holocene maximum and within Ϸ1°C of the maximum temperature of the past million years.We conclude that global warming of more than Ϸ1°C,relative to 2000,will constitute ‘‘dangerous’’climate change as judged from likely effects on sea level and extermination of species.climate change ͉El Niños ͉global warming ͉sea level ͉species extinctionsGlobal temperature is a popular metric for summarizing the state of global climate.Climate effects are felt locally,but the global distribution of climate response to many global climate forcings is reasonably congruent in climate models (1),suggesting that the global metric is surprisingly useful.We will argue further,consistent with earlier discussion (2,3),that measurements in the Western Pacific and Indian Oceans provide a good indication of global temperature change.We first update our analysis of surface temperature change based on instrumental data and compare observed temperature change with predictions of global climate change made in the 1980s.We then examine current temperature anomalies in the tropical Pacific Ocean and discuss their possible significance.Finally,we compare paleoclimate and recent data,using the Earth’s history to estimate the magnitude of global warming that is likely to constitute dan-gerous human-made climate change.Modern Global Temperature ChangeGlobal surface temperature in more than a century of instrumental data is recorded in the Goddard Institute for Space Studies analysis for 2005.Our analysis,summarized in Fig.1,uses documented procedures for data over land (4),satellite measurements of sea surface temperature (SST)since 1982(5),and a ship-based analysis for earlier years (6).Estimated 2error (95%confidence)in comparing nearby years of global temperature (Fig.1A ),such as 1998and 2005,decreases from 0.1°C at the beginning of the 20th century to 0.05°C in recent decades (4).Error sources include incomplete station coverage,quantified by sampling a model-generated data set with realistic variability at actual station loca-tions (7),and partly subjective estimates of data quality problems (8).The estimated uncertainty of global mean temperature implies that we can only state that 2005was probably the warmest year.The map of temperature anomalies for the first half-decade of the 21st century (Fig.1B ),relative to 1951–1980climatology,shows that current warmth is nearly ubiquitous,generally larger over land than over ocean,and largest at high latitudes in the Northern Hemi-sphere.Our ranking of 2005as the warmest year depends on the positive polar anomalies,especially the unusual Arctic warmth.In calculating the global mean,we give full weight to all regions based on area.Meteorological stations are sparse in the Arctic,but the estimated strong warm anomaly there in 2005is consistent withrecord low sea ice concentration and Arctic temperature anomalies inferred from infrared satellite data (9).Our analysis includes estimated temperature anomalies up to 1,200km from the nearest measurement station (7).Resulting spatial extrapolations and interpolations of temperature anomalies usually are meaningful for seasonal and longer time scales at middle and high latitudes,where the spatial scale of anomalies is set by Rossby waves (7).Thus,we believe that the unusual Arctic warmth of 2005is real.Other characteristics of our analysis method are summarized in Supporting Text ,which is published as supporting information on the PNAS web site.Independent analysis by the National Climate Data Center ( ͞oa ͞climate ͞research ͞2005͞ann ͞global.html),using a ‘‘teleconnection’’approach to fill in data sparse regions,also finds 2005to be the warmest year.The joint analysis of the University of East Anglia and the Hadley Centre ( ͞research ͞hadleycentre ͞obsdata ͞globaltemperature.html)also yields high global tem-perature for 2005,but a few hundredths of a degree cooler than in 1998.Record,or near record,warmth in 2005is notable,because global temperature did not receive a boost from an El Niño in 2005.The temperature in 1998,on the contrary,was lifted 0.2°C above the trend line by a ‘‘super El Niño’’(see below),the strongest El Niño of the past century.Global warming is now 0.6°C in the past three decades and 0.8°C in the past century.It is no longer correct to say ‘‘most global warming occurred before 1940.’’A better summary is:slow global warming,with large fluctuations,over the century up to 1975,followed by rapid warming at a rate Ϸ0.2°C per decade.Global warming was Ϸ0.7°C between the late 19th century (the earliest time at which global mean temperature can be accurately defined)and 2000,and continued warming in the first half decade of the 21st century is consistent with the recent rate of ϩ0.2°C per decade.The conclusion that global warming is a real climate change,not an artifact due to measurements in urban areas,is confirmed by surface temperature change inferred from borehole temperature profiles at remote locations,the rate of retreat of alpine glaciers around the world,and progressively earlier breakup of ice on rivers and lakes (10).The geographical distribution of warming (Fig.1B )provides further proof of real climate rgest warming is in remote regions including high latitudes.Warming occurs over ocean areas,far from direct human effects,with warming over ocean less than over land,an expected result for a forced climate change because of the ocean’s great thermal inertia.Early Climate Change Predictions.Manabe and Wetherald (11)madethe first global climate model (GCM)calculations of warming dueAuthor contributions:D.W.L.and M.M.-E.contributed data;J.H.,M.S.,R.R.,K.L.,D.W.L.,and M.M.-E.analyzed data;and J.H.wrote the paper.The authors declare no conflict of interest.Freely available online through the PNAS open access option.Abbreviations:SST,sea surface temperature;GHG,greenhouse gas;EEP,Eastern Equatorial Pacific;WEP,Western Equatorial Pacific;DAI,dangerous antrhopogenic interference;BAU,business as usual;AS,alternative scenario;BC,black carbon.‡Towhom correspondence should be addressed:E-mail:jhansen@.©2006by The National Academy of Sciences of the USA14288–14293͉PNAS ͉September 26,2006͉vol.103͉no.39 ͞cgi ͞doi ͞10.1073͞pnas.0606291103to instant doubling of atmospheric CO 2.The first GCM calculations with transient greenhouse gas (GHG)amounts,allowing compar-ison with observations,were those of Hansen et al.(12).It has been asserted that these calculations,presented in congressional testi-mony in 1988(13),turned out to be ‘‘wrong by 300%’’(14).That assertion,posited in a popular novel,warrants assessment because the author’s views on global warming have been welcomed in testimony to the United States Senate (15)and in a meeting with the President of the United States (16),at a time when the Earth may be nearing a point of dangerous human-made interference with climate (17).The congressional testimony in 1988(13)included a graph (Fig.2)of simulated global temperature for three scenarios (A,B,and C)and maps of simulated temperature change for scenario B.The three scenarios were used to bracket likely possibilities.Scenario A was described as ‘‘on the high side of reality,’’because it assumed rapid exponential growth of GHGs and it included no large volcanic eruptions during the next half century.Scenario C was described as ‘‘a more drastic curtailment of emissions than has generally been imagined,’’specifically GHGs were assumed to stop increasing after 2000.Intermediate scenario B was described as ‘‘the most plausi-ble.’’Scenario B has continued moderate increase in the rate of GHG emissions and includes three large volcanic eruptions sprin-kled through the 50-year period after 1988,one of them in the 1990s.Real-world GHG climate forcing (17)so far has followed a course closest to scenario B.The real world even had one large volcanic eruption in the 1990s,Mount Pinatubo in 1991,whereas scenario B placed a volcano in 1995.Fig.2compares simulations and observations.The red curve,as in ref.12,is the updated Goddard Institute for Space Studies observational analysis based on meteorological stations.The black curve is the land–ocean global temperature index from Fig.1,which uses SST changes for ocean areas (5,6).The land–ocean temper-ature has more complete coverage of ocean areas and yields slightly smaller long-term temperature change,because warming on aver-age is less over ocean than over land (Fig.1B ).Temperature change from climate models,including that re-ported in 1988(12),usually refers to temperature of surface air over both land and ocean.Surface air temperature change in a warming climate is slightly larger than the SST change (4),especially in regions of sea ice.Therefore,the best temperature observation for comparison with climate models probably falls between the mete-orological station surface air analysis and the land–ocean temper-ature index.Observed warming (Fig.2)is comparable to that simulated for scenarios B and C,and smaller than that for scenario A.Following refs.18and 14,let us assess ‘‘predictions’’by comparing simulated and observed temperature change from 1988to the most recent year.Modeled 1988–2005temperature changes are 0.59,0.33,and 0.40°C,respectively,for scenarios A,B,and C.Observed temper-ature change is 0.32°C and 0.36°C for the land–ocean index and meteorological station analyses,respectively.Warming rates in the model are 0.35,0.19,and 0.24°C per decade for scenarios A,B.and C,and 0.19and 0.21°C per decade for the observational analyses.Forcings in scenarios B and C are nearly the same up to 2000,so the different responses provide one measure of unforced variability in the model.Because of this chaotic variability,a 17-year period is too brief for precise assessment of model predictions,but distinction among scenarios and comparison with the real world will become clearer within a decade.Close agreement of observed temperature change with simula-tions for the most realistic climate forcing (scenario B)is accidental,given the large unforced variability in both model and real world.Indeed,moderate overestimate of global warming is likely because the sensitivity of the model used (12),4.2°C for doubled CO 2,is larger than our current estimate for actual climate sensitivity,which is 3Ϯ1°C for doubled CO 2,based mainly on paleoclimate data (17).More complete analyses should include other climate forcingsandFig.1.Surface temperature anomalies relative to 1951–1980from surface air measurements at meteorological stations and ship and satellite SST measurements.(A )Global annual mean anomalies.(B )Temperature anomaly for the first half decade of the 21stcentury.Fig.2.Global surface temperature computed for scenarios A,B,and C (12),compared with two analyses of observational data.The 0.5°C and 1°C tempera-ture levels,relative to 1951–1980,were estimated (12)to be maximum global temperatures in the Holocene and the prior interglacial period,respectively.Hansen et al.PNAS ͉September 26,2006͉vol.103͉no.39͉14289E N V I R O N M E N T A L S C I E N C EScover longer periods.Nevertheless,it is apparent that the first transient climate simulations (12)proved to be quite accurate,certainly not ‘‘wrong by 300%’’(14).The assertion of 300%error may have been based on an earlier arbitrary comparison of 1988–1997observed temperature change with only scenario A (18).Observed warming was slight in that 9-year period,which is too brief for meaningful comparison.Super El Niños.The 1983and 1998El Niños were successivelylabeled ‘‘El Niño of the century,’’because the warming in the Eastern Equatorial Pacific (EEP)was unprecedented in 100years (Fig.3).We suggest that warming of the Western Equatorial Pacific (WEP),and the absence of comparable warming in the EEP,has increased the likelihood of such ‘‘super El Niños.’’In the ‘‘normal’’(La Niña)phase of El Niño Southern Oscillation the east-to-west trade winds push warm equatorial surface water to the west such that the warmest SSTs are located in the WEP near Indonesia.In this normal state,the thermocline is shallow in the EEP,where upwelling of cold deep water occurs,and deep in the WEP (figure 2of ref.20).Associated with this tropical SST gradient is a longitudinal circulation pattern in the atmosphere,the Walker cell,with rising air and heavy rainfall in the WEP and sinking air and drier conditions in the EEP.The Walker circulation enhances upwelling of cold water in the East Pacific,causing a powerful positive feedback,the Bjerknes (21)feedback,which tends to maintain the La Niña phase,as the SST gradient and resulting higher pressure in the EEP support east-to-west trade winds.This normal state is occasionally upset when,by chance,the east-to-west trade winds slacken,allowing warm water piled up in the west to slosh back toward South America.If the fluctuation is large enough,the Walker circulation breaks down and the Bjerknes feedback loses power.As the east-to-west winds weaken,the Bjerknes feedback works in reverse,and warm waters move more strongly toward South America,reducing the thermocline tilt and cutting off upwelling of cold water along the South American coast.In this way,a classical El Niño is born.Theory does not provide a clear answer about the effect of global warming on El Niños (19,20).Most climate models yield either a tendency toward a more El Niño-like state or no clear change (22).It has been hypothesized that,during the early Pliocene,when the Earth was 3°C warmer than today,a permanent El Niño condition existed (23).We suggest,on empirical grounds,that a near-term global warming effect is an increased likelihood of strong El Niños.Fig.1B shows an absence of warming in recent years relative to 1951–1980in the equatorial upwelling region off the coast of South America.This is also true relative to the earliest period of SST data,1870–1900(Fig.3A ).Fig.7,which is published as supporting information on the PNAS web site,finds a similar result for lineartrends of SSTs.The trend of temperature minima in the East Pacific,more relevant for our purpose,also shows no equatorial warming in the East Pacific.The absence of warming in the EEP suggests that upwelling water there is not yet affected much by global warming.Warming in the WEP,on the other hand,is 0.5–1°C (Fig.3).We suggest that increased temperature difference between the near-equatorial WEP and EEP allows the possibility of increased temperature swing from a La Niña phase to El Niño,and that this is a consequence of global warming affecting the WEP surface sooner than it affects the deeper ocean.Fig.3B compares SST anomalies (12-month running means)in the WEP and EEP at sites (marked by circles in Fig.3A )of paleoclimate data discussed below.Absolute temperatures at these sites are provided in Fig.8,which is published as supporting information on the PNAS web site.Even though these sites do not have the largest warming in the WEP or largest cooling in the EEP,Fig.3B reveals warming of the WEP relative to the EEP [135-year changes,based on linear trends,are ϩ0.27°C (WEP)and Ϫ0.01°C (EEP)].The 1983and 1998El Niños in Fig.3B are notably stronger than earlier El Niños.This may be partly an artifact of sparse early data or the location of data sites,e.g.,the late 1870s El Niño is relatively stronger if averages are taken over Niño 3or a 5°ϫ10°box.Nevertheless,‘‘super El Niños’’clearly were more abundant in the last quarter of the 20th century than earlier in the century.Global warming is expected to slow the mean tropical circulation (24–26),including the Walker cell.Sea level pressure data suggest a slowdown of the longitudinal wind by Ϸ3.5%in the past century (26).A relaxed longitudinal wind should reduce the WEP–EEP temperature difference on the broad latitudinal scale (Ϸ10°N to 15°S)of the atmospheric Walker cell.Observed SST anomalies are consistent with this expectation,because the cooling in the EEP relative to WEP decreases at latitudes away from the narrower region strongly affected by upwelling off the coast of Peru (Fig.3A ).Averaged over 10°N to 15°S,observed warming is as great in the EEP as in the WEP (see also Fig.7).We make no suggestion about changes of El Niño frequency,and we note that an abnormally warm WEP does not assure a strong El Niño.The origin and nature of El Niños is affected by chaotic ocean and atmosphere variations,the season of the driving anomaly,the state of the thermocline,and other factors,assuring that there will always be great variability of strength among El Niños.Will increased contrast between near-equatorial WEP and EEP SSTs be maintained or even increase with more global warming?The WEP should respond relatively rapidly to increasing GHGs.In the EEP,to the extent that upwelling water has not been exposed to the surface in recent decades,little warming is expected,andtheBSST Change (°C) from 1870-1900 to 2001-2005Western and Eastern Pacific Temperature Anomalies (°C)parison of SST in West and East Equatorial Pacific Ocean.(A )SST in 2001–2005relative to 1870–1900,from concatenation of two data sets (5,6),as described in the text.(B )SSTs (12-month running means)in WEP and EEP relative to 1870–1900means.14290͉ ͞cgi ͞doi ͞10.1073͞pnas.0606291103Hansen etal.contrast between WEP and EEP may remain large or increase in coming decades.Thus,we suggest that the global warming effect on El Niños is analogous to an inferred global warming effect on tropical storms (27).The effect on frequency of either phenomenon is unclear,depending on many factors,but the intensity of the most powerful events is likely to increase as GHGs increase.In this case,slowing the growth rate of GHGs should diminish the probability of both super El Niños and the most intense tropical storms.Estimating Dangerous Climate ChangeModern vs.Paleo Temperatures.Modern SST measurements (5,6)are compared with proxy paleoclimate temperature (28)in the WEP (Ocean Drilling Program Hole 806B,0°19ЈN,159°22ЈE;site circled in Fig.3A )in Fig.4A .Modern data are from ships and buoys for 1870–1981(6)and later from satellites (5).In concatenation of satellite and ship data,as shown in Fig.8A ,the satellite data are adjusted down slightly so that the 1982–1992mean matches the mean ship data for that period.The paleoclimate SST,based on Mg content of foraminifera shells,provides accuracy to Ϸ1°C (29).Thus we cannot be sure that we have precisely aligned the paleo and modern temperature scales.Accepting paleo and modern temperatures at face value implies a WEP 1870SST in the middle of its Holocene range.Shifting the scale to align the 1870SST with the lowest Holocene value raises the paleo curve by Ϸ0.5°C.Even in that case,the 2001–2005WEPSST is at least as great as any Holocene proxy temperature at that location.Coarse temporal resolution of the Holocene data,Ϸ1,000years,may mask brief warmer excursions,but cores with higher resolution (29)suggest that peak Holocene WEP SSTs were not more than Ϸ1°C warmer than in the late Holocene,before modern warming.It seems safe to assume that the SST will not decline this century,given continued increases of GHGs,so in a practical sense the WEP temperature is at or near its highest level in the Holocene.Fig.5,including WEP data for the past 1.35million years,shows that the current WEP SST is within Ϸ1°C of the warmest intergla-cials in that period.The Tropical Pacific is a primary driver of the global atmosphere and ocean.The tropical Pacific atmosphere–ocean system is the main source of heat transported by both the Pacific and Atlantic Oceans (2).Heat and water vapor fluxes to the atmosphere in the Pacific also have a profound effect on the global atmosphere,as demonstrated by El Niño Southern Oscillation climate variations.As a result,warming of the Pacific has worldwide repercussions.Even distant local effects,such as thinning of ice shelves,are affected on decade-to-century time scales by subtropical Pacific waters that are subducted and mixed with Antarctic Intermediate Water and thus with the Antarctic Circumpolar Current.The WEP exhibits little seasonal or interannual variability of SST,typically Ͻ1°C,so its temperature changes are likely to reflect large scale processes,such as GHG warming,as opposed to small scale processes,such as local upwelling.Thus,record Holocene WEP temperature suggests that global temperature may also be at its highest level.Correlation of local and global temperature change for 1880–2005(Fig.9,which is published as supporting information on the PNAS web site)confirms strong positive correlation of global and WEP temperatures,and an even stronger correlation of global and Indian Ocean temperatures.The Indian Ocean,due to rapid warming in the past 3–4decades,is now warmer than at any time in the Holocene,independent of any plausible shift of the modern temperature scale relative to the paleoclimate data (Fig.4C ).In contrast,the EEP (Fig.4B )and perhaps Central Antarctica (Vostok,Fig.4D )warmed less in the past century and are probably cooler than their Holocene peak values.However,as shown in Figs.1B and 3A ,those are exceptional regions.Most of the world and the global mean have warmed as much as the WEP and Indian Oceans.We infer that global temperature today is probably at or near its highest level in the Holocene.Fig.5shows that recent warming of the WEP has brought its temperature within Ͻ1°C of its maximum in the past million years.There is strong evidence that the WEP SST during the penultimate interglacial period,marine isotope stage (MIS)5e,exceeded the WEP SST in the Holocene by 1–2°C (30,31).This evidence is consistent with data in Figs.4and 5and with our conclusion that the Earth is now within Ϸ1°C of its maximum temperature in the past million years,because recent warming has lifted the current temperature out of the prior Holocenerange.parison of modern surface temperature measurements with paleoclimate proxy data in the WEP (28)(A ),EEP (3,30,31)(B ),Indian Ocean (40)(C ),and Vostok Antarctica (41)(D).Fig.5.Modern sea surface temperatures (5,6)in the WEP compared with paleoclimate proxy data (28).Modern data are the 5-year running mean,while the paleoclimate data has a resolution of the order of 1,000years.Hansen et al.PNAS ͉September 26,2006͉vol.103͉no.39͉14291E N V I R O N M E N T A L S C I E N C ESCriteria for Dangerous Warming.The United Nations FrameworkConvention on Climate Change (www.unfccc.int)has the objective ‘‘to achieve stabilization of GHG concentrations’’at a level pre-venting ‘‘dangerous anthropogenic interference’’(DAI)with cli-mate,but climate change constituting DAI is undefined.We suggest that global temperature is a useful metric to assess proximity to DAI,because,with knowledge of the Earth’s history,global tem-perature can be related to principal dangers that the Earth faces.We propose that two foci in defining DAI should be sea level and extinction of species,because of their potential tragic consequences and practical irreversibility on human time scales.In considering these topics,we find it useful to contrast two distinct scenarios abbreviated as ‘‘business-as-usual’’(BAU)and the ‘‘alternative scenario’’(AS).BAU has growth of climate forcings as in intermediate or strong Intergovernmental Panel on Climate Change scenarios,such as A1B or A2(10).CO 2emissions in BAU scenarios continue to grow at Ϸ2%per year in the first half of this century,and non-CO 2positive forcings such as CH 4,N 2O,O 3,and black carbon (BC)aerosols also continue to grow (10).BAU,with nominal climate sensitivity (3Ϯ1°C for doubled CO 2),yields global warming (above year 2000level)of at least 2–3°C by 2100(10,17).AS has declining CO 2emissions and an absolute decrease of non-CO 2climate forcings,chosen such that,with nominal climate sensitivity,global warming (above year 2000)remains Ͻ1°C.For example,one specific combination of forcings has CO 2peaking at 475ppm in 2100and a decrease of CH 4,O 3,and BC sufficient to balance positive forcing from increase of N 2O and decrease of sulfate aerosols.If CH 4,O 3,and BC do not decrease,the CO 2cap in AS must be lower.Sea level implications of BAU and AS scenarios can be consid-ered in two parts:equilibrium (long-term)sea level change and ice sheet response time.Global warming Ͻ1°C in AS keeps tempera-tures near the peak of the warmest interglacial periods of the past million years.Sea level may have been a few meters higher than today in some of those periods (10).In contrast,sea level was 25–35m higher the last time that the Earth was 2–3°C warmer than today,i.e.,during the Middle Pliocene about three million years ago (32).Ice sheet response time can be investigated from paleoclimate evidence,but inferences are limited by imprecise dating of climate and sea level changes and by the slow pace of weak paleoclimate forcings compared with stronger rapidly increasing human-made forcings.Sea level rise lagged tropical temperature by a few thousand years in some cases (28),but in others,such as Meltwater Pulse 1A Ϸ14,000years ago (33),sea level rise and tropical temperature increase were nearly synchronous.Intergovernmental Panel on Climate Change (10)assumes negligible contribution to 2100sea level change from loss of Greenland and Antarctic ice,but that conclusion is implausible (17,34).BAU warming of 2–3°C would bathe most of Greenland and West Antarctic in melt-water during lengthened melt seasons.Multiple positive feedbacks,in-cluding reduced surface albedo,loss of buttressing ice shelves,dynamical response of ice streams to increased melt-water,and lowered ice surface altitude would assure a large fraction of the equilibrium ice sheet response within a few centuries,at most (34).Sea level rise could be substantial even in the AS,Ϸ1m per century,and cause problems for humanity due to high population in coastal areas (10).However,AS problems would be dwarfed by the disastrous BAU,which could yield sea level rise of several meters per century with eventual rise of tens of meters,enough to transform global coastlines.Extinction of animal and plant species presents a picture anal-ogous to that for sea level.Extinctions are already occurring as a result of various stresses,mostly human-made,including climate change (35).Plant and animal distributions are a reflection of the regional climates to which they are adapted.Thus,plants and animals attempt to migrate in response to climate change,but theirpaths may be blocked by human-constructed obstacles or natural barriers such as coastlines.A study of 1,700biological species (36)found poleward migration of 6km per decade and vertical migration in alpine regions of 6m per decade in the second half of the 20th century,within a factor of two of the average poleward migration rate of surface isotherms (Fig.6A )during 1950–1995.More rapid warming in 1975–2005yields an average isotherm migration rate of 40km per decade in the Northern Hemisphere (Fig.6B ),exceeding known paleoclimate rates of change.Some species are less mobile than others,and ecosystems involve interactions among species,so such rates of climate change,along with habitat loss and fragmentation,new invasive species,and other stresses are expected to have severe impact on species survival (37).The total distance of isotherm migration,as well as migration rate,affects species survival.Extinction is likely if the migration distance exceeds the size of the natural habitat or remaining habitat fragment.Fig.6shows that the 21st century migration distance for a BAU scenario (Ϸ600km)greatly exceeds the average migration distance for the AS (Ϸ100km).It has been estimated (38)that a BAU global warming of 3°C over the 21st century could eliminate a majority (Ϸ60%)of species on the planet.That projection is not inconsistent with mid-century BAU effects in another study (37)or scenario sensitivity of stress effects (35).Moreover,in the Earth’s history several mass extinc-tions of 50–90%of species have accompanied global temperature changes of Ϸ5°C (39).We infer that even AS climate change,which would slow warming to Ͻ0.1°C per decade over the century,would contribute to species loss that is already occurring due to a variety of stresses.However,species loss under BAU has the potential to be truly disastrous,conceivably with a majority of today’s plants and animals headed toward extermination.DiscussionThe pattern of global warming (Fig.1B )has assumed expected characteristics,with high latitude amplification and larger warming over land than over ocean,as GHGs have become the dominant climate forcing in recent decades.This pattern results mainly from the ice–snow albedo feedback and the response times of ocean andland.Fig.6.Poleward migration rate of isotherms in surface observations (A and B )and in climate model simulations (17)for 2000–2100for Intergovernmental Panel on Climate Change scenario A2(10)and an alternative scenario of forcings that keeps global warming after 2000less than 1°C (17)(C and D ).Numbers in upper right are global means excluding the tropical band.14292͉ ͞cgi ͞doi ͞10.1073͞pnas.0606291103Hansen etal.。