2007优秀的数学建模论文
2007数学建模优秀论文(最优公交路线选择)
目录 最优公交路线选择 .................................................................................................................... 1 1. 问题重述 ............................................................................................................................. 3 2. 模型假设 ............................................................................................ 3 3. 模型一:基于点搜索的多目标优化模型 ......................................................................... 4
3.3 问题三 .................................................................................................................... 11 3.3.1 问题分析: .................................................................................................. 11 3.3.2 图形改动: .................................................................................................. 12 3.3.3 建模求解: .................................................................................................. 13
数学建模全国赛07年A题一等奖论文
关于中国人口增长趋势的研究【摘要】本文从中国的实际情况和人口增长的特点出发,针对中国未来人口的老龄化、出生人口性别比以及乡村人口城镇化等,提出了Logistic、灰色预测、动态模拟等方法进行建模预测。
首先,本文建立了Logistic阻滞增长模型,在最简单的假设下,依照中国人口的历史数据,运用线形最小二乘法对其进行拟合,对2007至2020年的人口数目进行了预测,得出在2015年时,中国人口有13.59亿。
在此模型中,由于并没有考虑人口的年龄、出生人数男女比例等因素,只是粗略的进行了预测,所以只对中短期人口做了预测,理论上很好,实用性不强,有一定的局限性。
然后,为了减少人口的出生和死亡这些随机事件对预测的影响,本文建立了GM(1,1) 灰色预测模型,对2007至2050年的人口数目进行了预测,同时还用1990至2005年的人口数据对模型进行了误差检验,结果表明,此模型的精度较高,适合中长期的预测,得出2030年时,中国人口有14.135亿。
与阻滞增长模型相同,本模型也没有考虑年龄一类的因素,只是做出了人口总数的预测,没有进一步深入。
为了对人口结构、男女比例、人口老龄化等作深入研究,本文利用动态模拟的方法建立模型三,并对数据作了如下处理:取平均消除异常值、对死亡率拟合、求出2001年市镇乡男女各年龄人口数目、城镇化水平拟合。
在此基础上,预测出人口的峰值,适婚年龄的男女数量的差值,人口老龄化程度,城镇化水平,人口抚养比以及我国“人口红利”时期。
在模型求解的过程中,还对政府部门提出了一些有针对性的建议。
此模型可以对未来人口做出细致的预测,但是需要处理的数据量较大,并且对初始数据的准确性要求较高。
接着,我们对对模型三进行了改进,考虑人为因素的作用,加入控制因子,使得所预测的结果更具有实际意义。
在灵敏度分析中,首先针对死亡率发展因子θ进行了灵敏度分析,发现人口数量对于θ的灵敏度并不高,然后对男女出生比例进行灵敏度分析得出其灵敏度系数为0.8850,最后对妇女生育率进行了灵敏度分析,发现在生育率在由低到高的变化过程中,其灵敏度在不断增大。
2007美国大学生数学建模竞赛B题特等奖论文
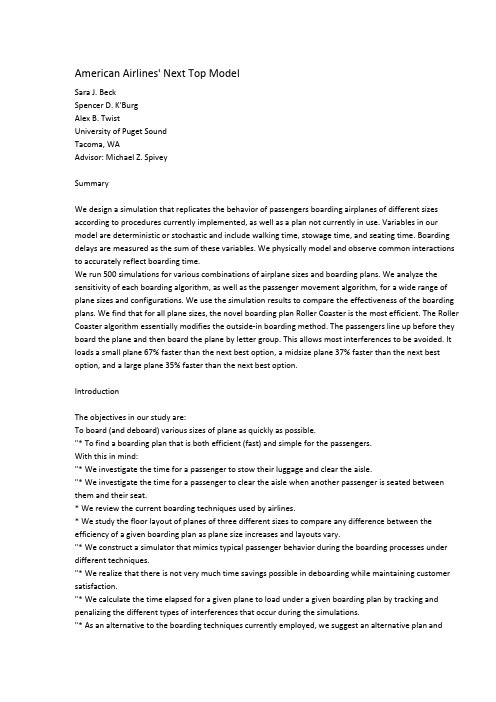
American Airlines' Next Top ModelSara J. BeckSpencer D. K'BurgAlex B. TwistUniversity of Puget SoundTacoma, WAAdvisor: Michael Z. SpiveySummaryWe design a simulation that replicates the behavior of passengers boarding airplanes of different sizes according to procedures currently implemented, as well as a plan not currently in use. Variables in our model are deterministic or stochastic and include walking time, stowage time, and seating time. Boarding delays are measured as the sum of these variables. We physically model and observe common interactions to accurately reflect boarding time.We run 500 simulations for various combinations of airplane sizes and boarding plans. We analyze the sensitivity of each boarding algorithm, as well as the passenger movement algorithm, for a wide range of plane sizes and configurations. We use the simulation results to compare the effectiveness of the boarding plans. We find that for all plane sizes, the novel boarding plan Roller Coaster is the most efficient. The Roller Coaster algorithm essentially modifies the outside-in boarding method. The passengers line up before they board the plane and then board the plane by letter group. This allows most interferences to be avoided. It loads a small plane 67% faster than the next best option, a midsize plane 37% faster than the next best option, and a large plane 35% faster than the next best option.IntroductionThe objectives in our study are:To board (and deboard) various sizes of plane as quickly as possible."* To find a boarding plan that is both efficient (fast) and simple for the passengers.With this in mind:"* We investigate the time for a passenger to stow their luggage and clear the aisle."* We investigate the time for a passenger to clear the aisle when another passenger is seated between them and their seat.* We review the current boarding techniques used by airlines.* We study the floor layout of planes of three different sizes to compare any difference between the efficiency of a given boarding plan as plane size increases and layouts vary."* We construct a simulator that mimics typical passenger behavior during the boarding processes under different techniques."* We realize that there is not very much time savings possible in deboarding while maintaining customer satisfaction."* We calculate the time elapsed for a given plane to load under a given boarding plan by tracking and penalizing the different types of interferences that occur during the simulations."* As an alternative to the boarding techniques currently employed, we suggest an alternative plan andassess it using our simulator."* We make recommendations regarding the algorithms that proved most efficient for small, midsize, and large planes.Interferences and Delays for BoardingThere are two basic causes for interference-someone blocking a passenger,in an aisle and someone blocking a passenger in a row. Aisle interference is caused when the passenger ahead of you has stopped moving and is preventing you from continuing down the aisle towards the row with your seat. Row interference is caused when you have reached the correct row but already-seated passengers between the aisle and your seat are preventing you from immediately taking your seat. A major cause of aisle interference is a passenger experiencing rowinterference.We conducted experiments, using lined-up rows of chairs to simulate rows in an airplane and a team member with outstretched arms to act as an overhead compartment, to estimate parameters for the delays cause by these actions. The times that we found through our experimentation are given in Table 1.We use these times in our simulation to model the speed at which a plane can be boarded. We model separately the delays caused by aisle interference and row interference. Both are simulated using a mixed distribution definedas follows:Y = min{2, X},where X is a normally distributed random variable whose mean and standard deviation are fixed in our experiments. We opt for the distribution being partially normal with a minimum of 2 after reasoning that other alternative and common distributions (such as the exponential) are too prone to throw a small value, which is unrealistic. We find that the average row interference time is approximately 4 s with a standard deviation of 2 s, while the average aisle interference time is approximately 7 s with a standard deviation of 4 s. These values are slightly adjusted based on our team's cumulative experience on airplanes.Typical Plane ConfigurationsEssential to our model are industry standards regarding common layouts of passenger aircraft of varied sizes. We use an Airbus 320 plane to model a small plane (85-210 passengers) and the Boeing 747 for a midsize plane (210-330 passengers). Because of the lack of large planes available on the market, we modify the Boeing 747 by eliminating the first-class section and extending the coach section to fill the entire plane. This puts the Boeing 747 close to its maximum capacity. This modified Boeing 747 has 55 rows, all with the same dimensions as the coach section in the standard Boeing 747. Airbus is in the process of designing planes that can hold up to 800 passengers. The Airbus A380 is a double-decker with occupancy of 555 people in three different classes; but we exclude double-decker models from our simulation because it is the larger, bottom deck that is the limiting factor, not the smaller upper deck.Current Boarding TechniquesWe examine the following industry boarding procedures:* random-order* outside-in* back-to-front (for several group sizes)Additionally, we explore this innovative technique not currently used by airlines:* "Roller Coaster" boarding: Passengers are put in order before they board the plane in a style much like those used by theme parks in filling roller coasters.Passengers are ordered from back of the plane to front, and they board in seatletter groups. This is a modified outside-in technique, the difference being that passengers in the same group are ordered before boarding. Figure 1 shows how this ordering could take place. By doing this, most interferencesare avoided.Current Deboarding TechniquesPlanes are currently deboarded in an aisle-to-window and front-to-back order. This deboarding method comes out of the passengers' desire to be off the plane as quickly as possible. Any modification of this technique could leadto customer dissatisfaction, since passengers may be forced to wait while others seated behind them on theplane are deboarding.Boarding SimulationWe search for the optimal boarding technique by designing a simulation that models the boarding process and running the simulation under different plane configurations and sizes along with different boarding algorithms. We then compare which algorithms yielded the most efficient boarding process.AssumptionsThe environment within a plane during the boarding process is far too unpredictable to be modeled accurately. To make our model more tractable,we make the following simplifying assumptions:"* There is no first-class or special-needs seating. Because the standard industry practice is to board these passengers first, and because they generally make up a small portion of the overall plane capacity, any changes in the overall boarding technique will not apply to these passengers."* All passengers board when their boarding group is called. No passengers arrive late or try to board the plane early."* Passengers do not pass each other in the aisles; the aisles are too narrow."* There are no gaps between boarding groups. Airline staff call a new boarding group before the previous boarding group has finished boarding the plane."* Passengers do not travel in groups. Often, airlines allow passengers boarding with groups, especially with younger children, to board in a manner convenient for them rather than in accordance with the boarding plan. These events are too unpredictable to model precisely."* The plane is full. A full plane would typically cause the most passenger interferences, allowing us to view the worst-case scenario in our model."* Every row contains the same number of seats. In reality, the number of seats in a row varies due to engineering reasons or to accommodate luxury-class passengers.ImplementationWe formulate the boarding process as follows:"* The layout of a plane is represented by a matrix, with the rows representing rows of seats, and each column describing whether a row is next to the window, aisle, etc. The specific dimensions vary with each plane type. Integer parameters track which columns are aisles."* The line of passengers waiting to board is represented by an ordered array of integers that shrinks appropriately as they board the plane."* The boarding technique is modeled in a matrix identical in size to the matrix representing the layout of the plane. This matrix is full of positive integers, one for each passenger, assigned to a specific submatrix, representing each passenger's boarding group location. Within each of these submatrices, seating is assigned randomly torepresent the random order in which passengers line up when their boarding groups are called."* Interferences are counted in every location where they occur within the matrix representing the plane layout. These interferences are then cast into our probability distribution defined above, which gives ameasurement of time delay."* Passengers wait for interferences around them before moving closer to their assigned seats; if an interference is found, the passenger will wait until the time delay has finished counting down to 0."* The simulation ends when all delays caused by interferences have counted down to 0 and all passengers have taken their assigned seats.Strengths and Weaknesses of the ModelStrengths"* It is robust for all plane configurations and sizes. The boarding algorithms that we design can be implemented on a wide variety of planes with minimal effort. Furthermore, the model yields reasonable results as we adjust theparameters of the plane; for example, larger planes require more time to board, while planes with more aisles can load more quickly than similarlysized planes with fewer aisles."* It allows for reasonable amounts of variance in passenger behavior. While with more thorough experimentation a superior stochastic distribution describing the delays associated with interferences could be found, our simulationcan be readily altered to incorporate such advances."* It is simple. We made an effort to minimize the complexity of our simulation, allowing us to run more simulations during a greater time period and mini mizing the risk of exceptions and errors occurring."* It is fairly realistic. Watching the model execute, we can observe passengers boarding the plane, bumping into each other, taking time to load their baggage, and waiting around as passengers in front of them move out of theway. Its ability to incorporate such complex behavior and reduce it are key to completing our objective. Weaknesses"* It does not account for passengers other than economy-class passengers."* It cannot simulate structural differences in the boarding gates which couldpossibly speed up the boarding process. For instance, some airlines in Europeboard planes from two different entrances at once."* It cannot account for people being late to the boarding gate."* It does not account for passenger preferences or satisfaction.Results and Data AnalysisFor each plane layout and boarding algorithm, we ran 500 boarding simulations,calculating mean time and standard deviation. The latter is important because the reliability of plane loading is important for scheduling flights.We simulated the back-to-front method for several possible group sizes.Because of the difference in thenumber of rows in the planes, not all group size possibilities could be implemented on all planes.Small PlaneFor the small plane, Figure 2 shows that all boarding techniques except for the Roller Coaster slowed the boarding process compared to the random boarding process. As more and more structure is added to the boarding process, while passenger seat assignments continue to be random within each of the boarding groups, passenger interference backs up more and more. When passengers board randomly, gaps are created between passengers as some move to the back while others seat themselves immediately upon entering the plane, preventing any more from stepping off of the gate and onto the plane. These gaps prevent passengers who board early and must travel to the back of the plane from causing interference with many passengers behind them. However, when we implement the Roller Coaster algorithm, seat interference is eliminated, with the only passenger causing aisle interference being the very last one to boardfrom each group.Interestingly, the small plane's boarding times for all algorithms are greater than their respective boarding time for the midsize plane! This is because the number of seats per row per aisle is greater in the small plane than in the midsize plane.Midsize PlaneThe results experienced from the simulations of the mid-sized plane areshown in Figure 3 and are comparable to those experienced by the small plane.Again, the Roller Coaster method proved the most effective.Large PlaneFigure 4 shows that the boarding time for a large aircraft, unlike the other plane configurations, drops off when moving from the random boarding algorithm to the outside-in boarding algorithm. Observing the movements by the passengers in the simulation, it is clear that because of the greater number of passengers in this plane, gaps are more likely to form between passengers in the aisles, allowing passengers to move unimpeded by those already on board.However, both instances of back-to-front boarding created too much structure to allow these gaps to form again. Again, because of the elimination of row interference it provides for, Roller Coaster proved to be the most effective boarding method.OverallThe Roller Coaster boarding algorithm is the fastest algorithm for any plane pared to the next fastest boarding procedure, it is 35% faster for a large plane, 37% faster for a midsize plane, and 67% faster for a small plane. The Roller Coaster boarding procedure also has the added benefit of very low standard deviation, thus allowing airlines a more reliable boarding time. The boarding time for the back-to-front algorithms increases with the number of boarding groups and is always slower than a random boarding procedure.The idea behind a back-to-front boarding algorithm is that interference at the front of the plane is avoided until passengers in the back sections are already on the plane. A flaw in this procedure is that having everyone line up in the plane can cause a bottleneck that actually increases the loading time. The outside-in ("Wilma," or window, middle, aisle) algorithm performs better than the random boarding procedure only for the large plane. The benefit of the random procedure is that it evenly distributes interferences throughout theplane, so that they are less likely to impact very many passengers.Validation and Sensitivity AnalysisWe developed a test plane configuration with the sole purpose of implementing our boarding algorithms on planes of all sizes, varying from 24 to 600 passengers with both one or two aisles.We also examined capacities as low as 70%; the trends that we see at full capacity are reflected at these lower capacities. The back-to-front and outside-in algorithms do start to perform better; but this increase inperformance is relatively small, and the Roller Coaster algorithm still substantially outperforms them. Underall circumstances, the algorithms we test are robust. That is, they assign passenger to seats in accordance with the intention of the boarding plans used by airlines and move passengers in a realistic manner.RecommendationsWe recommend that the Roller Coaster boarding plan be implemented for planes of all sizes and configurations for boarding non-luxury-class and nonspecial needs passengers. As planes increase in size, its margin of success in comparison to the next best method decreases; but we are confident that the Roller Coaster method will prove robust. We recommend boarding groups that are traveling together before boarding the rest of the plane, as such groups would cause interferences that slow the boarding. Ideally, such groups would be ordered before boarding.Future WorkIt is inevitable that some passengers will arrive late and not board the plane at their scheduled time. Additionally, we believe that the amount of carry-on baggage permitted would have a larger effect on the boarding time than the specific boarding plan implemented-modeling this would prove insightful.We also recommend modifying the simulation to reflect groups of people traveling (and boarding) together; this is especially important to the Roller Coaster boarding procedure, and why we recommend boarding groups before boarding the rest of the plane.。
优秀的数学建模论文范文(通用8篇)
优秀的数学建模论文范文第1篇摘要:将数学建模思想融入高等数学的教学中来,是目前大学数学教育的重要教学方式。
建模思想的有效应用,不仅显著提高了学生应用数学模式解决实际问题的能力,还在培养大学生发散思维能力和综合素质方面起到重要作用。
本文试从当前高等数学教学现状着手,分析在高等数学中融入建模思想的重要性,并从教学实践中给出相应的教学方法,以期能给同行教师们一些帮助。
关键词:数学建模;高等数学;教学研究一、引言建模思想使高等数学教育的基础与本质。
从目前情况来看,将数学建模思想融入高等教学中的趋势越来越明显。
但是在实际的教学过程中,大部分高校的数学教育仍处在传统的理论知识简单传授阶段。
其教学成果与社会实践还是有脱节的现象存在,难以让学生学以致用,感受到应用数学在现实生活中的魅力,这种教学方式需要亟待改善。
二、高等数学教学现状高等数学是现在大学数学教育中的基础课程,也是一门必修的课程。
他能为其他理工科专业的学生提供很多种解题方式与解题思路,是很多专业,如自动化工程、机械工程、计算机、电气化等必不可少的基础课程。
同时,现实生活中也有很多方面都涉及高数的运算,如,银行理财基金的使用问题、彩票的概率计算问题等,从这些方面都可以看出人们不能仅仅把高数看成是一门学科而已,它还与日常生活各个方面有重要的联系。
但现在很多学校仍以应试教育为主,采取填鸭式教学方式,加上高数的教材并没有与时俱进,将其与生活的关系融入教材内,使学生无法意识到高数的重要性以及高数在日常生活中的魅力,因此产生排斥甚至对抗的心理,只是在临考前突击而已。
因此,对高数进行教学改革是十分有必要的,而且怎么改,怎么让学生发现高数的魅力,并积极主动学习高数也是作为教师所面临的一个重大问题。
三、将数学建模思想融入高等数学的重要性第一,能够激发学生学习高数的兴趣。
建模思想实际上是使用数学语言来对生活中的实际现象进行描述的过程。
把建模思想应用到高等数学的学习中,能够让学生们在日常生活中理解数学的实际应用状况与解决日常生活问题的方便性,让学生们了解到高数并不只是一门课程,而是整个日常生活的基础。
07年全国数学建模优秀论文

基于网络拓扑的公交查询方案摘 要公交、地铁线路和站点组成了一个极其复杂的网络结构,如何从这个网络的任意两 个节点找到一条最优的乘车方案,传统遍历算法是很费时甚至不可行的,必须采取一种 高效的方法。
本文运用了网络拓扑的知识来分析问题,结合隐含枚举,双向搜索遍历, 动态规划方法减少运算量,较好的解决了这一问题。
对于问题一,我们采用了网络拓扑进行分析,采用隐含枚举,双向搜索的方法,建 立了两点之间线路搜索的动态规划多目标模型,设计了基于直达站点间点—点最优距离 的广度优先搜索算法,得出了较好的结果,如:L436L176 311L15L201L41 4135S3359S1828S3359S 1784S 1828 S3359S 1327S 1790S 1828 ® ¾¾¾®¾¾¾® ¾¾®¾¾¾®¾¾¾ ® : 对于问题二,我们在问题一已经给出的纯公交路径基础上,采取了增加地铁连通站 点集合(两两可达)的方法,建立了求经地铁中转的最优线路的多目标模型,设计了基 于搜索地铁出入站点的最优路径算法,得到了令人满意的结果,如:T2 8S0087S3676S0087D27D36S3676 ® ®¾¾®® : 对于问题三,我们采用了网络拓扑进行分析,确立了两点之间的距离正比于步行时 间的原则,在此基础上,建立了基于归并相邻站点的最优线路的改良模型。
综合我们使用的各种方法,可以把原来很难实现的求解过程复杂度缩小数个数量 级,使算法可行并可以搜索更多的区域,最终得到了令人满意的路径。
关键词:网络拓扑 隐含遍历 动态规划 点—点最优距离 广度优先搜索 最优路径1.问题提出与分析2008年奥运会在京举行期间,将有大量游客到北京,北京公共交通系统的发展极大 的满足了游客们在京的出行需求,同时也产生了多条公交线路的选择问题。
2007年全国大学生数学建模竞赛优秀论文集

1 问题重述(略)
2 模型假设
(1)将出生人口数、死亡人口数、老龄化、人口迁移以及性别比作为衡量人口 状态变化的全部因素,不再考虑其他方面对人口状态的影响;
(2)所有表征和影响人口变化的因素都是在整个社会人口的平均意义下确定的; (3)人口死亡率函数只依赖于各个年龄段,而与时间的流逝无关,即针对同一
2000 126743 65437
51.63 61306
48.37 45906 36.22 80837 63.78
2001 127627 65672
51.46 61955
48.54 48064 37.66 79563 62.34
2002 128453 66115
51.47 62338
48.53 50212 39.09 78241 60.91
2007 年我校共有 29 队参赛,11 个队参加甲组比赛,获全国一等奖 2 项、全国二等奖 1 项、重庆市一等奖 6 项;18 个队参加乙组比赛,获全国一等奖 3 项、重庆市一等奖 5 项、 重庆市二等奖 6 项。我校获得全国奖的比例高出全国平均水平 11.37 个百分点。我校参赛队 数占重庆市高校参赛队数的 5.66%,获全国一等奖队数的比例却高达 35.71%,彰显我校实力, 为我校争得荣誉。
2007 年获全国甲组二等奖 关于我国人口增长问题的研究………………………………………弓毅等 (84)
中国人口增长的预测模型
李阳、罗虎、陈道森 指导教师:罗万春
摘要:
本文研究的是根据中国实际情况,结合近年中国人口发展出现的新特点(老 龄化加速、出生人口性别比持续升高以及乡村人口城镇化等),对中国人口的增 长趋势做出中短期及长期预测的问题。首先,我们扩充了中国历年的总人口数据, 建立了 BP 神经网络模型,对中国短、中、长期的人口增长分别做了简单预测; 其次借用 Logistic 人口增长模型,将各种影响人口发展的因素归结到环境的容量 因素中,建立了符合中国实际情况的人口增长模型,并编程求解。之后,我们对 宋健人口模型进行了改进,建立了一阶偏微分方程模型,并借用高斯赛德尔迭 代法的思想将已预测出的数据加以迭代来预测下一年的数据,使该模型具有更好 的时效性,利用 Excel 对所给数据进行统计和筛选,并用 Matlab6.5 编程实现, 对中国人口发展进行了预测。最后我们以改进的宋健模型为基础,将农村人口城 镇化的因素纳入考虑范围,提出了人口城镇化影响因子,从而建立了人口城镇化 进程中的人口增长模型四。
2007数学建模A题CUMCM全国二等奖

3 of page 45
f X (mi (t ),i di (t )) ——组间交换人口数; TFR——总和生育率;
S (t , a ) ——幸存矩阵; C (t , a ) ——人口组间交换矩阵;
mi (t ) ——组别迁入人口数; di (t ) ——组别迁出人口数;
μinf ant (t ) ——第 t 年代的婴儿死亡率; μ0 (t ) ——第 t 年代不能存活到 t 时代统计时刻的婴儿比率;
k =1
。
则 GM (1,1) 模型的微分方程为: dX (1) + aX (1) = u dt
2007CUMCM 全国二等奖
湖南大学
程雨
倪剑光
何良勇
湖南大学数学建模网站
4 of page 45
系数向量为:
a = [a , u]
Λ
T
。累加矩阵B为:
⎡ −[ X (1) (1) + X (1) (2)] 1⎤ ⎢ ⎥ −[ X (1) (2) + X (1) (3)] 1⎥ ⎢ B= ⎢M M⎥ ⎢ ⎥ (1) (1) ⎢− ⎣ [ X (n − 1) + X (n)]1⎦ , Yn = [ X (0) (2)
⎧ x1 (t , a) ⎫ ⎪ x (t , a ) ⎪ 2 ⎪ ⎪ ⎪ ⎪ X (t , a) = ⎨ x3 (t , a) ⎬ ⎪ x (t , a ) ⎪ ⎪ 4 ⎪ ⎪ ⎪ ( , ) x t a ⎩ 5 ⎭ 我们现在推导各年龄组的人口变化规律。 第 i 个年龄组第 t+1 年代人口数由两个因素决定:上一年代 t 的保留人口 f c (ui (t ), xi (t , a)) 和组间交换人口 f X (mi (t ),i di (t )) :
2007年全国数学建模大赛A题中国人口增长预测与控制题目和论文赏析(1)(1)

中国人口增长预测与控制摘要近年来,中国人口最突出的特点是:老龄化加速、出生人口性别比持续增高和乡村人口城镇化。
针对这些特点,建立各个影响因素的数学模型,最后建立中国人口的增长模型。
对于问题一,首先将人口增长的预测问题转化为对出生率、死亡率和城镇乡转移率的预测。
通过原题附录3数据的分析研究,发现影响人口增长的主要因素可以归结为出生率、死亡率和城镇乡转移率,并依此建立了不同参数随时间变化的递推数学模型,讨论了各个参数对人口增长的影响。
其次,分别拟合死亡率和生育率、城镇乡转移率对年龄的分布。
建立了差分数学模型,将死亡率、生育率与城镇乡转移率的预测归结到总和死亡率、总和生育率与城镇乡总和转移率的预测,由于概率分布是相对稳定的,模型参数整体健壮。
对中短期的预测而言,总和死亡率、生育率和转移率的变化是近似线性的;对长期的预测,采用SI和SIS模型来描述其非线性变化,其模型的控制参数变化体现了国家人口政策的控制力度,结果表明模型具有长期可控性。
对于问题二,采用所建模型对0—90岁人口做出中短期和长期预测。
2006-2030年总人口逐年增加,2006年为13.062亿,2007年为13.109亿,2008年为13.158亿,2010年为13.3亿,2023年达到高峰期13.829亿,以后开始下降趋于平缓,到2030年为13.805;乡城转移率逐年增加,短期线性变化,2006年为0.454,2007年为0.471,2008年为0.490,2010年为0.526,长期由非线性模型描述,到2030年,城乡比例为0.901;整体老龄化程度增大,2006年为0.129,2007年为0.134,2008年为0.139,2010年为0.150,到2030年为0.325,在农村老龄化尤其严重,可以确定为地区间的迁移。
同时在做长期预测时,不同的国家策略导致不同的人口状况(见图[26-30]),得到的结论可以作为国家制定人口方针的建议。
- 1、下载文档前请自行甄别文档内容的完整性,平台不提供额外的编辑、内容补充、找答案等附加服务。
- 2、"仅部分预览"的文档,不可在线预览部分如存在完整性等问题,可反馈申请退款(可完整预览的文档不适用该条件!)。
- 3、如文档侵犯您的权益,请联系客服反馈,我们会尽快为您处理(人工客服工作时间:9:00-18:30)。
中国人口增长模型摘要人口问题涉及人口质量和人口结构等因素,是一个复杂的系统工程,稳定的人口发展直接关系到我国社会、经济的可持续发展。
如何从数量上准确的预测人口数量以及各种人口指标,对我国制定与社会经济发展协调的健康人口发展计划有着决定性的意义。
近年来我国的人口发展出现了许多新的特点,这些都影响着我国人口的增长。
鉴此,本文依据灰色预测方法和年龄移算理论,基于人口普查统计数据,从人口系统发展机理上展开讨论。
首先根据灰色预测理论,建立了一级的灰色预测模型,再将近几年我国的人口数量带入模型,便得到未来较短时间内我国的人口数量。
所得结果为我国总人口将于2006年、2007,2008,2009,2010年分别达到13.1495,13.2212,13.2909,13.3587,13.4246亿人。
然后分析人口发展方程中按年龄死亡率及生育模式等参数函数的内在变化规律,及其对总人口的影响,建立了莱斯利主模型,并在此基础上针对各参数函数的不同特点,建立了生育模型和死亡模型等子模型。
在将所得子模型和主模型结合,依据当前人口结构现状对我国的人口做了长期的预测。
所得结果是我国总人口将于2010年、2020年、2030年分别达到13.51058,14.38295,14.78661亿人与国家发展战略报告数据一致。
最后对所建模型的优缺点进行了客观的评价。
关键词:灰色预测模型,改进的莱斯利模型,老龄化指数,平均寿命,平均年龄。
一、问题的提出1.1问题:中国是一个人口大国,人口问题始终是制约我国发展的关键因素之一。
根据已有数据,运用数学建模的方法,对中国人口做出分析和预测是一个重要问题。
近年来中国的人口发展出现了一些新的特点,例如,老龄化进程加速、出生人口性别比持续升高,以及乡村人口城镇化等因素,这些都影响着中国人口的增长。
2007年初发布的《国家人口发展战略研究报告》还做出了进一步的分析。
关于中国人口问题已有多方面的研究,并积累了大量数据资料。
试从中国的实际情况和人口增长的上述特点出发,参考附录2中的相关数据(也可以搜索相关文献和补充新的数据),建立中国人口增长的数学模型,并由此对中国人口增长的中短期和长期趋势做出预测。
1.2背景分析:中国是世界上人口最多的发展中国家,人口多,底子薄,人均耕地少,人均占有资源相对不足,是我国的基本国情,人口问题一直是制约中国经济发展的首要因素。
人口数量、质量和年龄分布直接影响一个地区的经济发展、资源配置、社会保障、社会稳定和城市活力。
在我国现代化进程中,必须实现人口与经济、社会、资源、环境协调发展和可持续发展,进一步控制人口数量,提高人口质量,改善人口结构。
对此,单纯的人口数量控制(如已实施多年的计划生育)不能体现人口规划的科学性。
政府部门需要更详细、更系统的人口分析技术,为人口发展策略的制定提供指导和依据。
长期以来,对人口年龄结构的研究仅限于粗线条的定性分析,只能预测年龄结构分布的大致范围,无法用于分析年龄结构的具体形态。
随着对人口规划精准度要求的提高,通过数学方法来定量计算各种人口指数的方法日益受到重视,这就是人口控制和预测。
二、问题分析2.1 整体分析人口增长模型是由生育、死亡、疾病、灾害、环境、社会、经济等诸多因素影响和制约的共同结果,如此众多的因素不可能通过几个指标就能表达清楚,他们对人口增长的潜在而复杂的影响更是无法精确计算。
这反映出人口系统具有明显的灰色性,适宜采用灰色模型去发掘和认识原始时间序列综合灰色量所包含的内在规律。
灰色预测模型属于全因素的非线性拟合外推类法,其特点是单数列预测,在形式上只用被预测对象的自身序列建立模型,根据其自身数列本身的特性进行建模、预测,与其相关的因素并没有直接参与,而是将众多直接的明显的和间接的隐藏着的、已知的、未知的因素包含在其中,看成是灰色信息即灰色量,对灰色量进行预测,不必拼凑数据不准、关系不清、变化不明的参数,而是从自身的序列中寻找信息建立模型,发现和认识内在规律进行预测。
基于以上思想我们建立了灰色预测模型。
2.2 局部分析在灰色预测模型中,与起相关的因素并没有直接参与,但如果考虑到直接影响人口增长的因素,例如出生率、死亡率、迁入迁出人口数等,根据具体的数据进行计算,则可以根据年龄移算理论,从某一时点的某年龄组人数推算一年或多年后年龄相应增长一岁或增长多岁的人口数。
在这个人口数的基础上减去相应年龄的死亡人数,就可以得到未来某年龄组的实际人口数。
对于0岁的新生人口,则需要通过生育率作重新计算。
当社会经济条件变化不大时,各年龄组死亡率比较稳定,相应活到下一年龄组的比例即存活率也基本上稳定不变。
因而可以根据现有的分性别年龄组存活率推算未来各相应年龄组的人数。
即,若某t 年年初有i 岁人口数()t x i 人,次年即(t+1)年年初这些人长了一岁为(r+1)岁。
若()t d i 为这批人在一年内的死亡率,则(t+1)年年初(i+1)岁的人口数为()()()t d t x i i -⨯1。
0岁人口数需要通过妇女生育情况另行计算。
因此可以建立人口发展矩阵方程模型这一主模型,并在其基础上建立生育率模型和死亡率模型。
三、模型假设1. 假设附件中所给数据真实可靠且具有预测性。
2. 不考虑国内外的人口迁移对我国人口的影响。
3. 不考虑香港、台湾以及澳门人口。
4. 假设影响中国总人口数的主要因素是死亡率和出生率。
5. 假设在社会稳定的前提下,生育和死亡率都比较稳定。
6. 由国家人口发展战略研究报告知,我国总和生育率从20世纪70年代初的5.8下降到目前的1.8,低于更替水平。
假设在未来的发展进程中,我国妇女的总和生育率保持为1.8。
四、名词解释1. 人口:生活在一定社会生产方式、一定时期、一定地域,实现其生命活动并构成社会生活主体,具有一定数量和质量的人所组成的社会群体。
2. 出生率:指某年每1000人对应的活产数,又称总出生率或粗出生率。
它反映人口的出生水平,一般以千分数表示。
3. 生育率:某年每1000名15-49岁妇女的活产婴儿数。
又称一般生育率。
该指标比出生率要精确一些,因为它将同可能生育的特定性别年龄的人口联系起来(通常是15-49岁的妇女),排除了年龄性别结构不同引起的偏差。
生育率比出生率更能揭示生育水平的变化。
4. 总和生育率:指假定妇女按照某一年的年龄别生育率度过育龄期,平均每个妇女在育龄期生育的孩子数5. 死亡率:一定时期内(通常为一年)死亡人数与同期平均人数(或期中人数)之比。
说明该时期人口的死亡强度,通常用千分比表示。
6. 人口增长率:人口增长程度或增长速度,即一定时期内人口增长数与人口总数之比。
通常以一年为期计算,用百分数表示。
7. 人口年龄结构:某一年某一地区按年龄划分的人口数。
8. 老龄化指数:65岁以上人口对15岁以下人口的比例,数值越高说明老龄化程度越深。
9. 平均寿命:0岁时的期望寿命,用以反映同时出生的一群人预期可能存活的岁数。
10.灰生成:将原来数据通过某种运算交换为新数据,成为灰生成,新数据称为变换数据。
11.累加生成:将同一序列中数据逐次相加以生成新的数据。
五、模型的建立模型一 灰色预测模型灰色系统是指既含有已知信息、又含有未知信息或非确知信息的系统,也称为贫信息系统。
灰色模型是根据关联度、生成数灰导数、灰微分等观点和一系列数学方法建立起来的连续性的微分方程。
灰色预测是灰色系统理论的一个重要方面,它利用这些信息,建立灰色预测模型,从而确定系统未来的变化趋势。
灰色预测模型能够根据现有的少量信息进行计算和推测。
灰色建模的思路是:从序列角度剖析微分方程,是了解其构成的主要条件,然后对近似满足这些条件的序列建立近似的微分方程模型。
而对序列而言(一般指有限序列)只能获得有限差异信息,因此,用序列建立微分方程模型,实质上是用有限差异信息建立一个无限差异信息模型。
设原始序列为()()()()()()()},,2,1{0000n x x x x =这是一组信息不完全的灰色量,具有很大的随机性,将其进行生成处理,以提供更多的有用信息。
下面选用累加生成,则m 次累加生成的结果为()()()()()()()},,2,1{n x x x x m m m m =式中()()()()∑=-=ki m m i x k x11 (k=1,2,…,n )一般通过一次累加生成就能使数据呈现一定的规律,若规律不够,可增加累加生成的次数。
同理一次累加序列为()()()()()()()},2,1{1111n x x x x =在数据生成的基础上,用线性动态模型对生成数据拟合和逼近。
对()1x 建立模型()()()()b k az k x =+10其白化形式微分方程为()()()()()μ=+t ax t d t dx 11 记参序列T b a a ][=∧→,再按最小二乘法进行求解。
其向量形式为N T T TB B B b a a →→-→→→⎪⎪⎭⎫ ⎝⎛==∧γ1][其中()()()()()()k x k x k z 001121+-=; ()()()()()()()()()()()()⎥⎥⎥⎥⎥⎦⎤⎢⎢⎢⎢⎢⎣⎡+--+-+-=→1]1[5.01]32[5.01]21[5.0111111n x n x x x x x B ; ()()()()()()T N n x x x ]32[000 =→γ;白化形式微分方程的离散解为()()()()a e a x k xak μμ--=+-]1[1ˆ01 (k=0,1,2,…,n-1) 按()()()()()()t x t x t xm m m ˆ1ˆ1ˆ1-+=+-累减生成还原,计算后得到预测数据。
显然这里只需一次累减。
利用1999年-2005年的中国人口数据,然后根据最小二乘法原理运用Matlab 软件编程(程序见附录)对参数求解可以得到:0281.0=a ,0888.0=μ,初始序列的第一个元素为0.0975。
因此可得白化形式微分方程的离散解为()()[]0281.00888.00281.00888.00975.01ˆ0281.01--=+-k e k x即 ()()1601.30626.31ˆ02881.01--=+-k e k x通过上述GM (1,1)模型的建模过程可知,模型的解是一个指数函数,实际上对于任意非负离散点序列,其一次累加序列呈现指数规律,因此,用指数函数来拟合是可以的。
模型二 模型组下面以人口发展矩阵方程为主模型,并在此基础上进一不建立生育模型和死亡模型的子模型。
主模型:改进的莱斯利模型以年为组划分年龄组,令最长寿命为m,设第t 年满i 足岁不到i+1足岁的人数为()t x i ,t=0,1,2…,i=0,1,2,…,m.其中()t x i 表示符合条件的全部人口。