生产部产能分析表(新项目用)
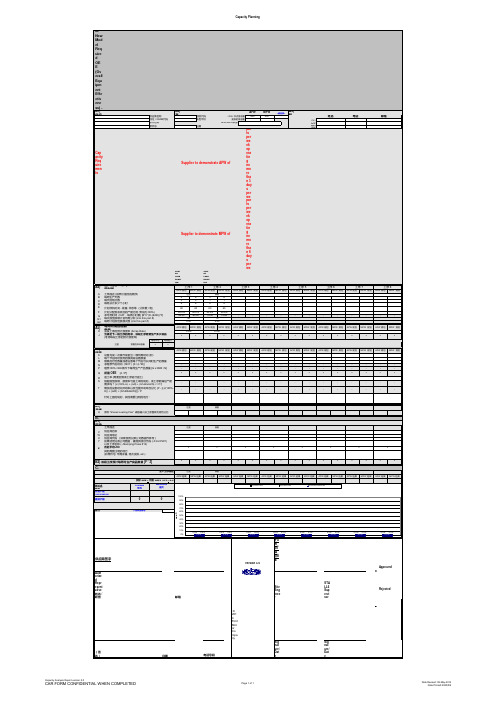
企业产能分析表Capacity_Analysis_Report_v5.0(中文版哦)
Date Revised: 09-May-2014 Date Printed:2018/7/17
© 2014 Ford Motor Company (签名) 日期 电话号码 Signature/Date Signature/Date
Capacity Analysis Report version 5.0
CAR FORM CONFIDENTIAL WHEN COMPLETED
Page 1 of 1
Capacity Planning
A. New Model Required OEE (Overall Equipment Effectiveness) A1) 供应商与零件信息
供应商名称 地址 / GSDB代码 零件名称 零件号
A2) 产能需求信息
项目代码 车型年份 日期
<PA> 节点需求量 更新的需求量
B1) 历史数据 (参考后面的Historical Mfg Performance表格)
工序描述 V W X Y Z 供应商名称 供应商地址 供应商代码 (如果使用兄弟公司数据作参考) 如果使用兄弟公司数据,请提供项目代码 (~Ford P221) 以及工序名称 (~Stamping Press #12) 历史平均OEE 其他需要注明的地方 (如零件号, 年需求量, 班次安排, etc.)
5 1 8 60 30.0% 10.50 15 5.00
APW 规划
6 1 8 60 30.0% 12.60 -
50.0% 52.50
A5)每周所需合格品数量
H J 该段工序的预计报废率 (Scrap Rate) 为满足下一段工序的需求,该段工序需要生产多少良品 (考虑每段工序的预计报废率)
每周平均 注塑 需要的来料数量 每周最大
产能分析管理规范

1.目的为了规范产能评估流程,确保生产线产能满足客户需求,提前识别产能瓶劲并采取措施,避免交付问题。
2.范围适用于本公司所有部门。
3.定义:无4.职责与权限4.1 计划部:负责客户订单信息,预测订单信息的收集和计划工作的安排。
4.2 营销中心:负责及时与客户的沟通协调及报警工作。
4.3 研发中心:负责技术方案制定。
4.4 PIE:负责产能提升方案制定。
4.5 采购部:负责委外资源的协调和调用,紧急物料协调。
4.6 生产部:负责计划的执行。
5.内容5.1 新项目产能分析:5.1.1在接到新项目时,零部件事业部投产经理,与研发中心、营销中心、采购等各部门人员一起将新项目特殊工艺或特殊工装设备识别,在公司没有资源的情况下,在项目前期必须确定,外协加工或公司内部采购新设备加工,内部采购新设备的,进行《设备采购流程》。
5.1.2在项目PP阶段,营销中心、研发中心、PIE、计划部根据客户预测信息;进行产能评估分析,完成产能分析报告。
5.1.3在新项目试生产启动时,PIE根据客户一年预测信息(或量产前三个月预测信息)进行产能评估分析,完成产能分析报告。
5.2 周产能评估分析每周五上午PMC主管组织相关人员,开月周产销协调会议,将下周及下下周客户的预测发布,并由主计划人员确定目前实际产能情况,生产部各科室进行下两周的产能评估,会议中若有不能完成的,及时提出,进行计划变更或资源调整等,确保客户交付。
5.3 月产能评估每月(25-30号)PMC主管组织相关人员,开月度产销协调会议,将下月及下下月客户的预测发布,并由主计划人员确定目前实际产能情况,生产部各科室进行下两周的产能评估,会议中若有不能完成的,及时提出,进行计划变更或资源调整等,确保客户交付。
5.4 年产能评估每年12月中旬,业务部将客户下一年预测发布给计划部,计划部将信息反馈给生产部,其中包括第二年要停产的项目和重新量产的项目的年预测量和月预测量,生产部组织相关人员,对所有项目进行产能分析,完成《年度产能分析报告》。
生产能力分析表

包装课
合计
每工时产量
累计生产数量
人数
生产能力分析表
日期
你相信“人若有志,就不会在半坡停止。”就学习的阶段性而言,你处在初中的半山腰;就你进步的阶段而言,你也处在半山腰,这座右铭包含了你对自己的鼓励,希望你能真正意义上的做到勇往直前!
们的权利和个性发展,在基本的式非标准基础上,允许他们在多元价值中做出不同的选择;我们要尊重学生的差异,关注“边缘儿童”,对学生进行开放性的、发展性的、鼓励性的评价,帮助他们感受成长的逾越!3、梳理与时俱进的教师观新课程理念下的教师,是学生自主学习和探究活动的
工时
产量
人数
工时
产量
人数工时Biblioteka 产量12……
31
生产部各车间设备产能分析表
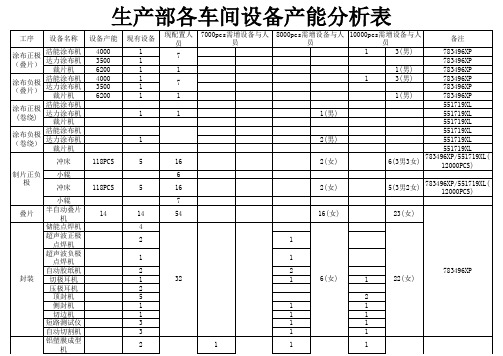
人员需求 测电压:2人 化成分容:8人 全检电压:6人 现车间生产作业人员有28人,还需增加28人(男8人,女20人) 包装车间 配组线 组装线 现有人员19人,所需人员12(女)人 现有人员33人,所需人员25(女)人 产能(组装电池3FB-783496XP2500组,西西利4000组,飞腾8000组)
1 1 1 1 2 2
1 14 1 1
1 1(男) 3 1 2
1 9人(3男6 783496XP 女) 551719XL(12000PCS) 1 1 3 8(7女1男) 551719XL(12000PCS)
1500
13 22 14
产量(叠片8000PCS,卷绕12000PCS) 需27台设备,27*384=10368(点),工作时间10.5H,1天两次 叠片8000PCS,1条拉线两班倒吃平,必须设备正常;卷绕12000PCS,1条拉线两班倒吃平,必须设备正常 叠片8000PCS,工作时间需29H,需21台设备生产,21*384=8064 卷绕12000,工作时间为15H,需32台设备生产,32*384=12288 化成设备点共计26000点,产值所需点30720点,还差4720点 预化:10人夹夹板,6人上下柜 封口:24人
工序设备名称设备产能现有设备现配置人员备注涂布正极浩能涂布机4000783496xp达力涂布机3500783498xp涂布负极浩能涂布机4000783499xp达力涂布机3500783501xp涂布正极浩能涂布机35006844135xp达力涂布机31006844135xp涂布负极浩能涂布机35006844135xp达力涂布机31006844135xp制片正负极冲床783498xp783499xp冲床6844135xp半自动叠片机15封装储能点焊机7000pcs需增设备与人员8000pcs需增设备与人员10000pcs需增设备与人员450pcs大片小时正负极各5台正负极各16人正负极各1人正极6人负正极1台正负极各2台450pcs大片小时正负极各5台正负极各20人正极4人负正负极各1台正负极各8人正极2台负正极1台正负极各2台60人23人783496xp2200mah3737层为标准32人封装压极耳机无尘车间铝塑膜成型机15封装储能点焊机22人783496xp2200mah3737层为标准10人16h783496xp2200mah为标准加上卷绕型号4500pcs60人17人28人51人6844135xp3300mah3132层为标准32人26人26人115h31人14h无尘车间铝塑膜成型机各型号成型模化成检测柜18783496xp封口拉线10工作台检测柜186044135xp封口拉线10工作台烘箱1620783496xp烘箱10206844135xp10人10人16h6844135xp3300mah3132层为标准各型号成型模需加1套482400点5500点55台63台24人80台28人烘箱注液11台45台65台11台10台工序岗位名称现配置人员涂布正极上浆检验涂布负极上浆检验涂布卷绕上浆检验制片负极管烤箱其他制片正极发隔膜统计数据封装贴固定胶定位切边检测领料上夹板无尘车间切边卷绕车间卷绕冲压封装4人2人新员工2人2人辞职12人2人新员工
生产计划产能分析表模板
生产计划产能分析表模板生产计划产能分析表是企业制定生产计划和评估产能利用率的重要工具,通过对生产计划和实际产能的比较分析,可以帮助企业有效调整生产计划,提高产能利用率,实现生产效益最大化。
本模板旨在为企业提供一个简洁、实用的生产计划产能分析表,以便于企业管理人员快速准确地进行生产计划和产能分析。
生产计划产能分析表模板。
一、生产计划情况。
1. 产品名称,__________。
2. 生产计划时间段,__________至__________。
3. 计划生产数量,__________件/台/吨等。
4. 实际生产数量,__________件/台/吨等。
5. 完成率,__________%。
二、产能分析。
1. 设备运行时间,__________小时/天。
2. 设备利用率,__________%。
3. 人工投入情况,__________人/班次。
4. 产能利用率,__________%。
5. 产能瓶颈,__________。
三、产能分析结果。
根据以上生产计划和产能分析数据,对比计划生产数量和实际生产数量,结合设备运行时间、设备利用率、人工投入情况和产能利用率,得出以下产能分析结果:1. 产能利用率较低的原因,__________。
2. 产能瓶颈所在,__________。
3. 产能提升方案,__________。
四、改进措施。
1. 调整生产计划,根据产能分析结果,合理安排生产计划,避免产能浪费和闲置。
2. 设备维护保养,加强设备维护保养工作,提高设备运行稳定性和利用率。
3. 人力资源调配,合理安排人工投入,提高人工利用率,减少人力浪费。
4. 技术改进,引进先进生产技术和设备,提高生产效率和产能利用率。
五、总结与展望。
通过生产计划产能分析表的填写和分析,企业可以及时发现产能问题,制定合理的改进措施,提高产能利用率,实现生产效益最大化。
同时,也可以为未来的生产计划和产能规划提供重要参考依据,促进企业持续健康发展。
产能分析表格
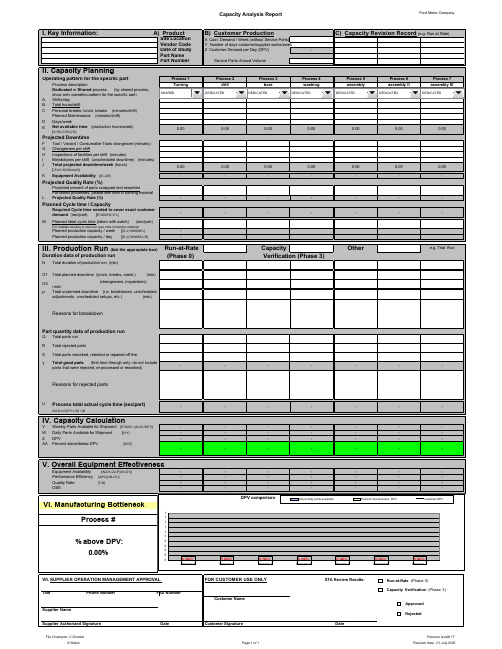
Capacity Analysis Report Ford Motor CompanyFile Champion: V DomdeiS Walsh Page 1 of 1Revision level# 17 Revision date : 01.July.2005General Information - Capacity Analysis ReportCapacity VerificationThe Capacity Analysis Report consists of two elements, Capacity Planning (verification of production readiness) and Performance of Capacity Verification.The Capacity Anaysis Report is though divided into 7 areas for ease of use. Each area has a heading at the top of the box. The headings are:· Key Information - Product / Customer Production / Capacity Revision Record· Capacity Planning· Production Run· Capacity Calculation· Original Equipment Effectiveness (OEE)· Manufacturing Bottleneck· Supplier Operation Management ApprovalData inputThe Capacity Analysis Report worksheet has been divided into a number of easy to identify information boxes. Each box has a main heading to allow easy recognition. Within each box the user is required to input a variety of data forms. This manual will explain how to complete each section in turn.Input & Calculation Cells: Data can only be input into the workbook in the cells on each sheet that require data. This ensures that the headings, or other information cannot be accidentally erased or modified. These cells (input cells) are clearly identified as white in colour and with a solid outline around the box.Cells that are grey in colour are calculation cells. The user cannot enter data into these cells. They calculate values according to specific formula using data entered into the input cells.KEY INFORMATION - Product & Production Information / Capacity Revision RecordProduct InformationThe first Step in completing the Capacity Analysis Report is to enter details of the part being analysed. These Cells hold the basic information on the supplier and the part analysed within the worksheet. Production InformationBefore the Capacity verification can take place, the Program Volume must be verified. This information will be available through the Request for Quote and the Purchase Order or other official information from the Launch teams. Please note that the RFQ may include 10% uplift for Service parts.Input Cell: Customer Demand per Week. Note: Weekly volumes in RFQ include a 10% uplift for service parts.Input Cell: Number of days customer / supplier works per week, this is per default 5, but could be changed to address complex supplier shift patterns e.g. 4 day full work, 5th day 5 hours. Please note that the supplier should work always in or above Tact with the PTO / VO plant.Input Cell: Service Parts: Please enter the number of service parts required for this component. This is for information only. The daily volume should be calculated without 10% uplift factor.Capacity Analysis Report - Revision RecordRecord any changes of this document in this fields for follow up. If a ramp up period to full production capacity is required, where the line will achieve full capacity over a number of stages,then this area will be where these changes are recorded. The proven capacity is entered together with the date. Any revisions to the capacity of the machine must be tracked using this box.CAPACITY PLANNINGThe Capacity Planning element will assess if suppliers have a "true production environment" in place and have a adequately prepared their organization and their suppliers for the start of production and ramp-up.A cut of the Operating pattern is shown above with an example of a data input for a process with five operations. The Operating pattern gives the opportunity to give each operation a different operation pattern. The operating pattern input should mirror the true dedicated manufacturing time for each operation, e.g. by shared machines.Input Cells: Process Description: Enter a brief Description of a process (e.g. final assembly, or inspection)Input Cells: Dedicated or Shared Process: Identify from a drop-down box, the process type – dedicated / shared.Dedicated MachinesA “dedicated” machine is one, which is solely used for the part being analysed in this worksheet. For example, a test station may be a dedicated machine. A machine, which is used by this part, and one or two others, with a short changeover time can also be categorized as a "dedicated" machine. An example is a manually operated projection nut welder.A “shared” facility is one which has many different parts manufactured on the facility, and a more significant tool changeover time. It would be usual for such a machine to manufacture parts in a batch production mode.Examples of a shared facility are:· stamping press· injection moulding machine· heat treatment facilityThe operating pattern should only show the real production time to the part in question.In addition to identifying the process as "shared" in the Capacity Analysis Report, a Shared Capacity Analysis of the "shared" facility should be calculated, identifying all Ford parts,Non-Ford parts volume and other production hours produced on the manufacturing line, determining if the capacity or time available is oversold. (See also attached excel sheet for Shared production lines)· Input Cells: Shifts per day: - indicate the number of shifts in which each process operates per day.· Input Cells: Gross hours per shift– total number of hours for each shift.· Input Cells:Personal Breaks – If the machine stops during personal breaks enter the length of time over one shift that the machine will notbe operating. If the machine operates during personal breaks then enter "0".· Input Cells:Planned Maintenance – this is the length of time that is planned for the machine to be down during a shift for a maintenance.· Input Cells:Days per Week – indicate the number of days in which each process operates per week. Example: Supplier's working 4 days 3shifts each and on Friday only 1 shift should just enter: 4 working days plus 0,333 working day = 4,333 days / week· Input Cells: Tool / Modul changover– Enter the changeover time for tool changes or module changes for the part in question. Changeover time is defined as the total time from last off previous part to checked first off new part.· Input Cells:Changeovers per shift– Enter the frequency of tool / module change per shift.· Input Cells: Inpections per shift - Enter the time required for inpections or adjustments during a shift· Input Cells:Downtime – Enter all other projected / planned downtime during a shift.· Calculation Cell: The Equipment Availability is calculated automatically by using previous data.Equipment Availability= (Total Planned Production Time – Breakdown) / Total Planned Production Time· Input Cells: Projected Scrap Rate – Enter the values for this machines losses. Note: This sheet does not address scrap rate loss of linked processes. To evalute output of linked processes the scrap· Input Cell: Planned Cycle time – Please provide the best estimate of the cycle time of the part on each process. The worksheet will use this data to calculate the Planned Production Capacity. This could be also a time taken with the stop watch at the bottleneck process. The process taken should always be considered including the time for loading / unloading and inspection. Note: For multiple cavities in one tool the actual cycle time of the tool must be devided by the number of cavities in the tool.· Calculation Cell: Required Cycle time needed to cover exact customer demand - For information only the worksheet displays the Cycle time needed to cover exact customer demand, calculated from planned opperating pattern, projected downtime and quality rate. This is to be compared to the Planned cycle time· Calculation Cells:Planned production capacity per week and Planned production capacity per day. This is to be compared with the Customer Demand per Week or Day.PRODUCTION RUNPrior to performing Run-at-Rate (Phase 0) or Capacity Verification (Phase 3), the supplier and customer should be in agreement on the following key parameters: quantity of parts to produce, selection of characteristics to measure, process set-ups, review of personnel involved, data analysis and reporting.The intent of the Production Run is to determine if the supplier can produce quality parts at production feeds and speeds. No direct data from the Capacity Planning chapter is used in the Production Run calculation.· Input Cells: Duration of production run – Please enter the amount of time that is used for the production run. If the production run covers one shift of 8 hours, the total minutes run would therefore by 480 minutes (8*60min).· Input Cells:Total planned downtime (lunch,breaks,maint.) – Please list all real downtimes during production run which have previously been planned according to the capacity planning - opperating pattern, i.e. lunch, breaks, maintanence.· Input Cells:The Planned downtime – (changeovers, inspections) - Please list all real downtimes during production run which have previously been planned according to the capacity planning -projected downtime, i.e. changovers, inpsections and adjustments.These downtimes will be subtracted from the Duration of production run in the Actual Cycle Time calculation.· Input Cells: Total unplanned downtime - List all unplanned downtime, i.e. breakdowns or other unsceduled adjustments or setups. The time of the breakdowns will not be subtracted from the duration of production run.· Input Cells:Total parts run, the Total rejected parts and Total parts reworked from production run need to be listed.· Calculation Cell: Total good parts - Only the total good parts will be used for the Actual Cycle time calculation.Please list in detail the Reasons for breakdown and Reasons for rejected parts.· Calculation Cell: Process a ctual cycle time – The Worksheet will automatically calculate the cycle time based on minutes run of production run and total parts produced. This will give the Procuction Run actual cycle time.For validation, compare the Actual process cycle time with the Planned ideal cycle time from the Capacity Planning.This cycle time used for the Capacity Analysis includes though only the good parts produced and excludes the unplanned breakdown time. This higher cycle time gives the realistic available capacity.CAPACITY CALCULATIONThis part of the Production Run is the analysis of the results. The Cycle time of each process from the Capacity Verification Run is compared with the Customer Demand of the part.If a process does not cover the customer demand on the daily production volume, the process is highlighted RED and marked as the bottleneck process.OVERALL EQUIPMENT EFFECTIVENESSThe Overall Equipment Effectiveness (OEE) is calculated from previous data from Production Verification Run. For the calculation of a Performance Efficiency is through the planned cycle time required. This information is taken from the Cell Planned ideal cycle time from Capacity Planning.If a calculation cell shows 100% or more, the cell is highlighted RED and data input should be validated.B81Capacity Analysis ReportFord Motor CompanyFile Champion: V. Domdei S. WalshPage 1 of 1Revision: #17Revision date: 01.July.2005Shared Production Line Information SheetSupplier / Process InformationCapacity Revison Record DateDesciptionLoadingSupplier Name:ABC SystemsOriginal Capacity submissionSite Location Vendor CodeProcess DescriptionBlank Assy. Line (Focus)Capacity Analysis Sheet Ford Motor CompanyFile Champion: V DomdeiS Walsh Page 1 of 1Revision level# 17Revision date : 1.July.2005 Capacity Verification (Check One)OperationProcessProcess DescriptionCapacity Verification Data Collection。
产能分析报告表格模板

产能分析报告表格模板概述本文档旨在为制定产能分析报告提供表格模板,以便用户可以更加方便和高效地进行产能分析。
1. 产能分析指标在进行产能分析之前,首先需要确定合适的产能分析指标。
以下是一些常用的产能分析指标:1.1 产能利用率产能利用率是指实际产能与理论产能之间的比率,用于衡量企业在特定时间段内实现产品或服务的能力。
产能利用率的计算公式如下:产能利用率 = 实际产能 / 理论产能1.2 产能率产能率是指在特定时间段内实际产出的产品或服务数量与理论产能之间的比率。
产能率的计算公式如下:产能率= 实际产出量 / 理论产能1.3 产能缺口产能缺口是指实际产出量与市场需求量之间的差距。
产能缺口可以帮助企业确定是否需要增加产能或调整生产计划。
产能缺口的计算公式如下:产能缺口 = 实际产出量 - 市场需求量2. 表格模板下面是一个使用表格展示产能分析报告的模板。
用户只需要根据实际情况填入相应数据即可。
时间段理论产能实际产能产能利用率实际产出量产能率市场需求量产能缺口2020年1月1000 900 90% 800 80% 1000 -2002020年2月1200 1100 91.7% 1000 83.3% 1200 -2002020年3月1300 1200 92.3% 1100 84.6% 1300 -2002020年4月1500 1400 93.3% 1300 86.7% 1500 -2002020年5月1600 1500 93.8% 1400 87.5% 1600 -200 ……………………3. 使用说明用户只需要按照自己的需求填入表格模板中的数据即可。
具体步骤如下:1.将时间段填写在“时间段”一栏中;2.将相应时间段的理论产能填写在“理论产能”一栏中;3.将相应时间段的实际产能填写在“实际产能”一栏中;4.根据实际情况计算并填写相应时间段的产能利用率、实际产出量、产能率、市场需求量和产能缺口。
4. 结论通过使用本表格模板进行产能分析,用户可以更好地了解企业在特定时间段内的产能状况,并根据产能指标进行相应的调整和决策。
生产能力分析表

立辉金属制品有限公司生产能力评诂表一.产品范围:各类铁线网,吊篮,厨,浴类用架,家庭式室内工作台,各类烧烤架等。
二.机器设备种类:冲床,油压冲床,脚踏点焊机,T型接法碰焊机,碰焊机,空压点焊机,C02焊机,抽直机,桌上车床,油压冲床,毛边机,攻丝机,空压机,立式磨轮三.生产能力说明:11,200,000 PCS.以两班作业16H/天计, 日产量64,000 PCS,月产量1,920,000 PCS,年产量22,400,000 PCS.粉体表面处理1条NPS流水线,以单班作业8H/天计,日产量12,000 PCS,月产量360,000 PCS,年产量4,200,000 PCS.以两班作业16H/天计, 日产量24,000 PCS,月产量720,000 PCS,年产量8,400,000 PCS.电镀镍铬表面处理2条NPS流水线,以单班作业8H/天计,日产量24,000 PCS,月产量720,000 PCS,年产量8,400,000 PCS.以两班作业16H/天计, 日产量48,000 PCS,月产量1,440,000 PCS,年产量16,800,000 PCS.包装12条NPS流水线,以单班作业8H/天计,日产量38,400 PCS,月产量1,152,000 PCS,年产量13,440,000 PCS.以两班作业16H/天计, 日产量76,800 PCS,月产量2,304,000 PCS,年产量26,880,000 PCS.总经理: 审核: 拟定:注:以下修改处均划线5.6.1 核算生产能量:(增加5.6.1.3)5.6.1.3生管在接到订单后,针对老产品在3天内依据技术文件将订单产品之机台设备,作业人员,生产流程,工序产能等基础资料录入月份生产工时统计表,新产品在技术文件下发后3天内录入月份生产工时统计表。
5.9 (剩)余(劳动)力管理:(删除5.9.1 , 5.9.3原内容,改为5.9.1/2/3/4 ,5.9.2改为5.9.5 原内容:5.9.1 因产能的增加或工序的改善造成人员多余或须补充人员时,生产单位应及时申报至生管处,生管依实际生产能量及订单交期进行人员调整。