A Cationic Azobenzene Dye-Montmorillonite Intercalation Compound
蝴蝶学校

歌曲:Au Lycée Papillon 蝴蝶学校歌手:Georgius 乔治乌斯歌词:Élève Labélure?... Présent!Vous êtes premier en histoire de France?Eh bien, parlez-moi de VercingétorixQuelle fut sa vie? sa mort? sa naissance?Répondez-moi bien... et vous aurez dix. Monsieur l'Inspecteur,Je sais tout ça par coeur.Vercingétorix né sous Louis-PhilippeBattit les Chinois un soir à RoncevauxC'est lui qui lança la mode des slip...es Et mourut pour ça sur un échafaud.Le sujet est neuf,Bravo, vous aurez neuf.REFRAIN:On n'est pas des imbécilesOn a même de l'instructionAu lycée Pa-pa...Au lycée Pa-pil...Au lycée Papillon.Élève Peaudarent?... Présent!Vous connaissez l'histoire naturelle?Eh bien, dites-moi ce qu'est un ruminant. Et puis citez-m'en... et je vous rappelle Que je donne dix quand je suis content. Monsieur l'Inspecteur,Je sais tout ça par coeur.Les ruminants sont des coléoptèresTels que la langouste ou le rat d'égout,Le cheval de bois, le pou, la belle-mère... Qui bave sur sa proie et pis qu'avale tout. Très bien répondu,Je vous donne huit... pas plus...REFRAINÉlève Isaac?... PrésentEn arithmétique vous êtes admirable,Dites-moi ce qu'est la règle de troisD'ailleurs votre père fut-il pas comptable Des films Hollywood... donc répondez-moi. Monsieur l'Inspecteur,Je sais tout ça par coeur.La règle de trois?... C'est trois hommes d'affaires Deux grands producteurs de films et puis c'estUn troisième qui est le commanditaireIl fournit l'argent et le revoit jamais.Isaac, mon petitVous aurez neuf et de mi!...REFRAINÉlève Trouffigne?... Présent!Vous êtes unique en géographie?Citez-moi quels sont les départementsLes fleuves et les villes de la NormandieSes spécialités et ses représentants?Monsieur l'Inspecteur,Je sais tout ça par coeur.C'est en Normandie que coule la MoselleCapitale Béziers et chef-lieu Toulon.On y fait le caviar et la mortadelleEt c'est là que mourut Philibert Besson.Vous êtes très caléJe donne dix sans hésiter.REFRAINÉlève Cancrelas?... Présent!Vous êtes le dernier ça me rend morose.Je vous vois dans la classe tout là-bas dans le fond En philosophie, savez-vous quelque chose?Répondez-moi oui, répondez-moi non.Monsieur l'Inspecteur,Moi je ne sais rien par coeur.Oui, je suis le dernier, je passe pour un cuistre Mais je m'en fous, je suis près du radiateurE puis comme plus tard je veux devenir ministreMoins je se rai calé, plus j'aurais de valeur,Je vous dis: bravo!Mais je vous donne zéro.REFRAINÉlève Legateux?... Présent!Vous êtes le meilleur en anatomie?Répondez, je vous prie, à cette questionPour qu'un être humain puisse vivre sa vieQuels sont ses organes, quelles sont leurs fonctions? Monsieur l'Inspecteur,Je sais tout ça par coeur.Nous avons un crâne, pour faire des crâne ries Du sang pour sentir, des dents pour danser Nous avons des bras...C'est pour les brasse riesDes reins pour rincerUn foie pour fouetterBien. C'est clair et netMais ça ne vaut pas plus de sept.REFRAIN。
A b n o rmally Decreased HbA1 c Can Be

Anti-thyroperoxidase antibodies from patients with Hashimoto'sencephalopathy bind to cerebellar astrocytesStéphanie Blanchin a,⁎,Christine Coffin b ,Fausto Viader c ,Jean Ruf d ,Pierre Carayon d ,Francette Potier a ,Estelle Portier a ,Elisabeth Comby a ,Stéphane Allouche e ,Yann Ollivier f ,Yves Reznik b ,Jean Jacques Ballet aaLaboratoire d ’Immunologie et d ’Immunopathologie,UPRES-EA 2128,CHU Clémenceau,14033Caen cedex,FrancebService d ’Endocrinologie et Maladies Métaboliques,CHU Côte de Nacre,14033Caen cedex,FrancecService de Neurologie,CHU Côte de Nacre,14033Caen cedex,FrancedINSERM U555,Facultéde médecine Timone,Universitéde la Méditerranée,13385,Marseille cedex 5,FranceeLaboratoire de Biochimie,CHU Côte de Nacre,14033Caen cedex,France fService de Médecine Interne,CHU Côte de Nacre,14033Caen cedex,FranceReceived 28June 2007;received in revised form 31July 2007;accepted 6August 2007AbstractA cohort of 10Hashimoto's encephalopathy (HE)patients,33patients with unrelated neurological symptoms,12Hashimoto's thyroiditis patients and 4healthy adult donors was studied to explore the neurological targets of anti-thyroperoxidase (TPO)autoantibodies (aAb)in HE.High levels of anti-TPO aAb were only detected in HE group's cerebrospinal fluids.In immunofluorescence assays on monkey brain cerebellum sections,both HE patients'sera and anti-TPO monoclonal antibodies (mAb)were able to bind cerebellar cells expressing glial fibrillary acid protein.Normal human astrocytes from primary cultures also reacted with anti-TPO mAb.Specific astrocyte binding of anti-TPO aAb suggests a role of these aAb in the HE pathogenesis.©2007Elsevier B.V .All rights reserved.Keywords:Anti-thyroperoxidase antibodies;Astrocytes;Cerebrospinal fluid;Hashimoto's encephalopathy;Hashimoto's thyroiditis1.IntroductionHashimoto's encephalopathy (HE)is a rare,often misdiag-nosed and poorly understood corticosteroid-responsive neuro-logical syndrome occurring in patients with autoimmune thyroid disease (AITD).Since the first description in 1966by Brain et al.(Brain et al.,1966),case reports described heterogeneous clinical manifestations such as psychiatric impairments and neurological disturbances (Kothbauer-Margreiter et al.,1996).The diagnosis was established on the basis of unspecific central nervous dys-function with the presence of serum anti-thyroid autoantibodies (aAb),regardless of the thyroid disorder (Fatourechi,2005).An autoimmune pathogenic link was suggested between HE and AITD based on HE features such as (i)presence of serum anti-thyroid aAb indicating active thyroiditis (Brain et al.,1966),(ii)cerebrospinal fluid (CSF)biochemistry suggesting inflammatory process (Ferracci et al.,2003),(iii)association with other autoimmune diseases such as systemic lupus erythematosus and rheumatoid arthritis (Mulhern et al.,1966),(iv)sex ratio and age distribution similar to AITD (Chaudhuri and Behan,2003;Sawka et al.,2002),(v)the improvement of symptoms after corticoste-roid therapy (Chong et al.,2003),and (vi)presence of serum aAb against neuronal alpha-enolase (Fujii et al.,2005;Ochi et al.,2002;Yoneda et al.,2007)and an unidentified 36kDa autoantigen (Oide et al.,2004).HE is also characterized by an increase in the CSF anti-thyroid,especially anti-thyroperoxidase (TPO)aAb levels (Ferracci et al.,2003)which was proposed as a valuable marker of diagnosis (Ferracci et al.,2004).The main thyroid autoantigens,TPO and thyroglobulin (Tg),are the enzyme-substrate pair involved in thyroid hormone production (Ruf and Carayon,2006).TPO is a 933-amino-acidJournal of Neuroimmunology 192(2007)13–20/locate/jneuroim⁎Corresponding author.Tel.:+33231272551;fax:+33231272550.E-mail address:blanchin-s@chu-caen.fr (S.Blanchin).0165-5728/$-see front matter ©2007Elsevier B.V .All rights reserved.doi:10.1016/j.jneuroim.2007.08.012long,type I integral membrane protein,which carries out the iodination and the intramolecular coupling of tyrosine residues of Tg to form thyroid hormones.Human(Chazenbalk et al., 1993)and murine(Ruf et al.,1989)monoclonal antibodies (mAb)have been used for characterization of the TPO immuno-dominant region(IDR).The aim of the present study was to assess the reactivity of anti-TPO aAb from HE patients with central nervous system (CNS)tissues.In immunofluorescence assays,both HE patient serum anti-TPO aAb and murine anti-TPO mAb were bound to astrocytic cells.2.Materials and methods2.1.HE patients and control subjectsSera and CSF from10HE patients admitted between January 1999and April2006to the neurological ward of Caen University Hospital were collected and kept at−80°C until used.Diagnosis was based on the neurological clinical manifestations and the presence of anti-Tg and-TPO aAb in the serum and CSF in the absence of other central neurological conditions.Serum and CSF samples were also obtained from a panel of33control patients who were referred to the emergency ward with meningitis(15), intractable headache(8),peripheral neuropathy(4),multiple sclerosis(6).They were free of AITD except two who were diagnosed with an Hashimoto's thyroiditis(HT)(serum anti-TPO aAb:80and100IU/mL,normal values:b25IU/mL).Sera from 12patients with a documented HTand serum anti-TPO aAb levels ranging from90to N200IU/mL were obtained from experienced endocrinologists.Normal sera were generous gifts from4healthy adult volunteers without AITD or CNS disease.Sera from HE patients and healthy control donors were tested for the presence of anti-nuclear aAb as described(Comby et al.,2006)and of anti-onconeuronal aAb(anti-Ri,-Hu,-Yo,-CV2,-amphiphysin,-Ma2 assays,Euroimmun GmbH,Gross Grönau,Germany,and Ravo Diagnostika GmbH,Freiburg,Germany)according to the manufacturers'instructions.The procedures used in this study were approved by the local institutional review committee,and informed consent was ob-tained from all donors.2.2.ELISA for the detection of serum and CSF anti-thyroid aAbWells of microtiter plates(Dynatech Laboratories Inc., Chantilly,V A)were coated with phosphate-buffered saline (PBS),pH7.4,containing300ng human TPO(Biodesign Inter-national,Saco,ME)or1000ng human Tg(Valbiotech,Paris, France).After being incubated overnight at4°C,the wells were saturated with1%bovine serum albumin(BSA;Laboratoires Eurobio,Courtaboeuf,France)in PBS.They were then incubated with1/800serum dilution for anti-TPO aAb,1/400serum dilution for anti-Tg aAb or1/5dilution for CSF samples in PBS,1%BSA with0.05%Tween20for1h30min at37°C.A calibration curve was drawn up using World Health Organization standards (NIBSC Codes:66/387and65/93for anti-TPO and-Tg aAb,respectively)and the BP114as substandard plasma(The Binding Site,Saint Egreve,France).After a washing step,the anti-Tg and -TPO aAb levels were both determined using alkaline phospha-tase-coupled goat antibodies to human IgG(P.A.R.I.S,Com-piègne,France)and p-nitrophenyl phosphate(Interchim, Montluçon,France)as substrate.Optical density(OD)was read at405nm using a Bio-Tek Elx808microplate reader(Bio-Tek Instruments Inc,Winooski,VT).Results were expressed as means of duplicate measurements in IU/mL in the case of sera and OD [ΔOD405nm=(OD405nm of coated wells)minus(OD405nm of uncoated wells)]in that of CSF.For18sera from healthy adult volunteers,threshold values for both anti-TPO and-Tg aAb was 25IU/ml,determined as mean values plus3SD from the mean.2.3.Depletion of HE patients’sera in anti-TPO aAbAnti-TPO aAb in sera of HE patients were depleted by performing affinity chromatography(Ruf et al.,1992).Briefly, 10mg of purified human TPO was coupled to25mL Affi-Gel15 (Bio-Rad,Marnes la Coquette,France).After extensive PBS washing,patients’sera were incubated overnight with the coupled gel at4°C under shaking.Unbound material was then checked by ELISA to ensure that it contained no anti-thyroid aAb.2.4.Primary normal human astrocyte cell culturesNormal primary human astrocytes derived from the whole brain of one donor,18weeks old fetus,(Cambrex Bio Science, Verviers,Belgium)were grown on coverslips in Astrocyte Basal Medium supplemented with the Astrocyte Growth Medium SingleQuots(Cambrex Bio Science).2.5.Immunofluorescence assaysStaining was performed on cerebrum,cerebellum and thy-roid tissue sections from Macaccus rhesus monkeys(The Binding Site)and normal human astrocyte coverslips.Human astrocytes were fixed and permeabilized in100%acetone.After BSA saturation,tissues and astrocytes were incubated for1h with HE patients’sera(1/15dilution),HE patients’sera devoid of anti-TPO aAb(1/15dilution),HT patients’sera and normal sera(1/15dilution),4murine anti-TPO mAb directed towards TPO IDR:mAb47,60,15and9(Ruf et al.,1989)and1murine anti-Tg mAb:mAbJ7C9.3(Ruf et al.,1983)(1/300dilution) and with anti-glial fibrillary acid protein(GFAP)mAb(1/1000 dilution;Sigma-Aldrich,Saint Quentin Fallavier,France)in PBS,3%BSA.Dilutions of sera and antibodies yielding optimal signal/background fluorescence were experimentally determined by serial tests.Staining patterns were revealed with rhodamine or FITC coupled goat antibodies against mouse IgG (Jackson ImmunoResearch Laboratories,West Grove,PA)or FITC coupled goat antibodies against human IgG(Euroimmun GmbH)for1h.Sections were then mounted with Vectashield-DAPI(Vector Laboratories,Peterborough,UK)and viewed using an Axioskop2Plus fluorescence microscope(Carl Zeiss Vision GmbH,Munchen,Germany)with a40×oil immersion lens.Pictures were acquired with an AxioCam HRC digital14S.Blanchin et al./Journal of Neuroimmunology192(2007)13–20camera equipped with an AxioVision 3.2software program.The Photoshop software program (version 6;Adobe System Inc.,San Jose,CA)was used to superimpose the pictures for colocalization viewing.2.6.SDS-PAGE and western blot analysisTwo μg of purified human TPO were incubated in Laemmli sample buffer and loaded onto 7.5%acrylamide gels.Proteins were either stained with Coomassie brilliant blue or electro-transferred onto a nitrocellulose sheet (Amersham Biosciences,Buckinghamshire,UK)for western blotting.After BSA satura-tion,the blotted membranes were incubated overnight at 4°C with HE patients'sera (1/100dilution)or mAb47(1/300dilu-tion)in PBS,0.05%Tween 20.Membranes were then incubated with alkaline phosphatase-labeled goat antibodies against human IgG or rabbit antibodies against mouse IgG (Rockland Immunochemicals for research,Gilbertsville,PA)for 2h.Finally,a revelation step was performed using 5-bromo-4-chloro-3-indolyl phosphate/nitro blue tetrazolium as the appro-priate substrate (Sigma-Aldrich).2.7.Statistical analysisResults are expressed as means ±1SD.Significance was determined using unpaired t -tests or one-way ANOVA with Dunnett's post test.Linear correlations were evaluated using R values.Significance levels were set at p b 0.01.3.Results3.1.Clinical and biological characteristics of HE patients The HE cohort consists of 1man and 9women.Their ages ranged from 25to 85(mean:53years)at the onset of the disease.The autoimmune thyroid disorders were HT for 8patients and Graves'disease (GD)with anti-TPO aAb for 2patients.Clinical data are presented in Table 1according to major criteria from Chaudhuri and Behan (2003)and Ferracci et al.(2004).The clinical manifestations included impaired consciousness,tremor,cephalalgia,coma,seizure,paraparesis,hemiparesis,confusion,ataxia,memory loss,myoclonus,apraxia and aphasia.Neither dementia nor behavioural disturbance was observed.In 4patients,non-migraine-type cephalalgia was initially recorded as a prominent symptom,and resolved within 2months in one while persisting for over 6months in the three others.Abnormal electroencephalography (EEG)tracing changes were observed in 3/10patients with diffuse intermittent runs of synchronous sharp waves.Brain magnetic resonance imaging (MRI)was performed in 7/10patients with normal imaging in all subjects except one with unspecific hyperintense spots in the white matter.One day to 4months after initial manifestations,9/10patients underwent a corticosteroid trial (prednisone equivalent:1mg/kg/day)during a minimum period of 6months.One patient (no.2)remained in spontaneous remission for at least 2years and did not receive corticosteroid therapy.Two months after initiation of therapy,symptoms were present in 5/9treated patients and absent in 4/9.Table 1Clinical features of HE patients Patient no.12345678910Sex F F F F F F F F F M Age51413545858457552553Thyroid disorderHT HT HT HT HT HT GD HT GD HT SymptomsImpaired consciousness +−−++++−++Tremor ++++++++++Cephalalgia−−++−−−++−Migraine-type headache −−−−−−−−−−Coma −−−−−−−−+−Seizure −−+−−−−−+−Paraparesis −−+−−−−−−−Hemiparesis +−+−−−−−−−Confusion −−−++++−++Ataxia+++−−−−++−Memory loss +−−−−−−+−+Myoclonus −−−+−−−−++Apraxia −+−−−−−−−−Aphasia−+−−−−−+++Focal neurological deficit −−−−−−−−−−EEG Normal Diffuse abn Normal Normal Normal Normal Normal Normal Diffuse abn Diffuse abn MRINA Normal Normal Hypersignal NA Normal Normal Normal NA Normal Corticosteroid therapy +−++++++++Evolution at 6monthsCR CR CD CR Death CD CD CR CD CR Persisting symptoms at 6months/12months−/−−/−+/−+/−+/NA−/NA+/NA+/−+/+−/−F:female,M:male,HT:Hashimoto's thyroiditis,GD:Graves ’disease,+:presence,−:absence,abn:abnormalities,NA:not available,CR:complete remission,CD:corticodependence.15S.Blanchin et al./Journal of Neuroimmunology 192(2007)13–20At6months,steroid therapy was discontinued in8/9patients. From6months to12months,corticodependence was observed in 4/9patients(no.3,6,7,9).All9steroid-treated patients were clinically improved.At12months,1(no.9)was symptomatic under therapy,5(no.1,3,4,8,10)were asymptomatic after cessation of therapy and2(no.6,7)were under therapy with a follow-up limited to7months.One patient(no.5)had died of an unrelated condition.From12months,therapy was continued in only1/10patient(no.9).All10HE patients exhibited high levels (N50IU/mL)of anti-TPO or-Tg aAb in their sera,or both (Table2).Nine HE patients were evaluated for CSF protein concentration and IgG index which were within normal or near normal ranges(Table2).No serum antibodies against nuclear and onconeuronal antigens were found in HE patients nor healthy donors(data not shown).3.2.High frequency of anti-TPO aAb in CSF from HE patientsThirty three CSF control samples corresponding to diverse CNS diseases with or without HT(2patients)status were quantified for their respective anti-TPO and-Tg aAb level.All these CSF exhibited lowest levels of anti-TPO and-Tg aAb which were used to determine threshold values.These values expressed inΔOD405nm(meanΔOD405nm+2SD),were set at0.228for anti-TPO aAb and0.115for anti-Tg aAb.High levels of anti-TPO (ΔOD N0.228)and-Tg(ΔOD N0.115)aAb were detected in all the HE patients'CSF(p b0.01;Fig.1).No correlation was found between serum and CSF levels of anti-TPO and-Tg aAb or between the respective anti-Tg and-TPO aAb levels.3.3.Serum anti-TPO autoantibody titer follow-up after initiation of corticosteroid therapyIn6HE patients(no.1,2,3,4,9,10),serum anti-TPO aAb levels were evaluated2and12months after initiation of corticosteroid therapy(Fig.2).Four out of6exhibited decreased anti-TPO aAb levels after2months(p b0.01),and in3,antibody titers fell below the threshold anti-TPO aAb value (b25IU/mL)after12months.Interestingly,no alteration of anti-TPO aAb(N200IU/mL)was noted in one HE patient(no.9)after a5-year therapy(data not shown).3.4.Anti-TPO aAb and mAb recognize the same TPO isoformsTo determine the specificity of anti-TPO aAb from HE patients’sera,a western blotting assay was performed on affinity-purified human TPO.TPO at100kDa was detected by performing Coomassie brilliant blue staining(Fig.3,A2).In western blotting assays,anti-TPO mAb47,reacted with the2 main isoforms forming the characteristic TPO doublet around 100kDa(Fig.3,B2).Both TPO isoforms were recognized by sera from the10HE patients as shown in Fig.3,C2which depicts the typical reactivity of the HE patient's no.9serum.3.5.Anti-TPO aAb bind to primate cerebellar tissuesTo investigate more closely the role of anti-TPO aAb in CNS abnormalities,indirect immunofluorescence assays with10HE patients,12HT patients and4healthy donors’sera were performed on CNS and thyroid tissues from M.rhesus.Fig.4A depicts the typical reactivity of one of HE patients'sera(no.9), the same serum depleted from anti-TPO aAb,one HT patient serum(anti-TPO aAb N200IU/mL)and normal serum on cerebellum and thyroid tissues.The anti-TPO aAb reactivity of all sera were first evaluated by specific staining of the thyroidTable2Biological features of HE patientsPatient no.12345678910CSF proteins(NR:0.15–0.45g/L)NA0.420.360.28NA0.35NA0.56NA0.69 IgG index(NR b0.7)NA0.58NA0.580.45NA NA0.47NA0.66 Serum anti-Tg aAb(NR b25IU/mL)17844N300225N30065150N30020041 Serum anti-TPO aAb(NR b25IU/mL)25150N20060N200N20080N200N200170 CSF anti-Tg aAb(ΔOD405nm b0.115)NA0.20 1.500.50 1.500.250.31 2.25 1.470.14 CSF anti-TPO aAb(ΔOD405nm b0.228)NA 3.49 2.320.280.78 2.670.75 4.03 3.91 1.89CSF:cerebrospinal fluid,NA:not available,NR:normal range,aAb:autoantibodies,Tg:thyroglobulin,TPO:thyroperoxidase,ΔOD405nm:optical densities at 405nm.Fig.1.Anti-TPO and-Tg aAb in CSF from HE patients.CSF from9HE patientswas analysed by ELISA to determine the anti-TPO(A,white bars)and-Tg(B,blackbars)aAb levels.Results were expressed as the meanΔOD405nm value±1SD(error bars).Dotted lines give threshold values for anti-TPO and-Tg aAb.16S.Blanchin et al./Journal of Neuroimmunology192(2007)13–20cell membrane (Fig.4,A6).The 10sera from HE patients (Fig.4,A1)but not the 12from HT patients (Fig.4,A3)or the 4from healthy subjects (Fig.4,A4)bound to structures in primate cerebellar tissues.After the depletion procedure which removed more than 90%of anti-TPO aAb but not anti-Tg aAb (Fig.4D and data not shown),the serum did not bind significantly to either thyroid cells or cerebellar cells (Fig.4,A2and A7).As the HE patients'sera contained anti-TPO and -Tg aAb,immuno-fluorescence assays were also performed with mAb directed against human TPO or Tg (Fig.4,B and C)to confirm the specificity of cerebellar staining.Four mAb characteristic of the TPO IDR (mAb47,60,15,9)and one directed toward human Tg (J7C9.3)were selected.The 4anti-TPO mAb all showed a similar reactivity pattern as seen with HE patients'sera on primate cerebellar cells (Fig.4B).Stained cells were mostly located in the subcortical cerebellar white matter,near the granular cell layer.No staining of cerebellar neuronal cells,including granular and Purkinje cells,was observed.The anti-Tg mAbJ7C9.3did not bind to cerebellar tissues (Fig.4,C1).None of the above sera and mAb bound to primate cerebrum tissues (data not shown).These results further suggest that the sole anti-TPO aAb electively recognize primate cerebellum structures.3.6.Reactivity of anti-TPO antibodies to GF AP-expressing astrocytic cellsTo identify further the cerebellar cell type(s)reacting with anti-TPO aAb,a double immunofluorescence assay with HE patients'sera and anti-GFAP mAb was performed on cerebellar tissues (Fig.5).Anti-TPO aAb from 2HE patients'sera (no.2and no.3)bound to GFAP-positive astrocytic cells.Similarly,the anti-TPO mAb47stained strongly at the membrane (Fig.5,D)of normal human astrocyte primary cell cultures expressing GFAP (Fig.5,E).These data therefore indicate that anti-TPO aAb from HE patients and anti-TPO mAb both bind to astrocytes.4.DiscussionPresent data suggest that anti-TPO and/or -Tg aAb are present in the CSF of HE patients and that their serum anti-TPO aAb bind cells of astrocyte lineage.A sensitive ELISA was performed to detect CSF anti-thyroid aAb in two groups,i.e.9HE patients and 33control adults with other neurological conditions.In accordance with the HE cases already reported in the literature (Chong et al.,2003),2GD patients with subclinical or overt hyperthyroidism were included.In the HE patients,anti-TPO and/or anti-Tg aAb were detected at variable levels in sera and significant levels in CSF,consistent with previous reports (Castillo et al.,2006;Ferracci et al.,2003).Their absence in the 33control patients including 2patients with HT suggests that this finding was restricted to HE and thus may provide a clue for early HE S inflammation was not documented since normal or near normal range CSF protein concentrations and IgG indices,and normal or unspecific brain MRI and EEG patterns were found.There is no evidence to conclude between either local antibody synthesis or blood brain barrier passage which is suggested in patients no.4and no.7with lowest serum and CSF aAb levels.Anti-TPO aAb in the CNS of HE patients might contribute to CNS pathology by interacting with CNS tissues,although not excluding a role for some other pathogenic antibodies.A role of aAb is further suggested by the marked clinicalimprovementFig.2.Time course study of serum anti-TPO aAb level in HE patients.Serum anti-TPO aAb levels (IU/ml)were sequentially determined in 6HE patients (no.1,2,3,4,9and 10)for 2to 12months after the onset of corticosteroid therapy.Results were expressed as mean values of triplicated experiments.Standard deviations from all means were lower than 10%of the mean.Threshold value for normal sera (25IU/mL)as described in the Materials and methodssection.Fig.3.Reactivity of anti-TPO aAb from HE patients and anti-TPO mAb with purified human TPO.Purified human TPO samples were run on SDS-PAGE gel and proteins were either directly stained with Coomassie brillant blue (A,2)or electrotransferred onto a nitrocellulose membrane and revealed in western blotting experiments using either anti-TPO mAb47(B,2)or HE patient's no.9serum (C,2).The molecular weights of the standards (column 1)are indicated in kDa on the left.Data shown are of a representative experiment.17S.Blanchin et al./Journal of Neuroimmunology 192(2007)13–20seen in 9HE patients following corticosteroid therapy which paralleled in 4/6the decrease in anti-TPO aAb level.A pathogenic role for anti-TPO aAb was also previously suspected in other conditions such as decreased intelligence quotient scores in children from mothers with high levels anti-TPO aAb and normal thyroid function during pregnancy (Pop et al.,1995)and the predisposition to depression found directly correlated with anti-TPO aAb levels (Pop et al.,1998).The complement-mediated thyrocyte cytotoxicity of anti-TPO aAb from AITD patients was found inhibited by human TPO and absent in patients with other autoimmune diseases such as lupus erythematosus and glomerulonephritis (Wa deleux et al.,1989).Antibody-dependent cell cytotoxicity against thyrocytes was dependent on anti-TPO and not anti-Tg aAb (R odien et al.,1996).A human chimeric anti-TPO Fab-dependent cell cyto-toxicity on human thyroid cells was exerted by peripheral blood mononuclear cells (Guo et al.,1997).Due to limited CSF concentrations of anti-TPO aAb,serum anti-TPO aAb and a panel of murine anti-TPO mAb cross-reacting with HT and GD patients'sera (Ruf et al.,1989),were preferentially used for investigating further their interactions with neurological cells.Indirect immunofluorescenceexperimentsFig.4.Reactivity of anti-TPO aAb from HE patients'sera and anti-TPO mAb to primate cerebellum and thyroid tissues.Immunofluorescent stainings of human sera (A),anti-TPO mAb (B)and anti-Tg mAb (C)were performed on monkey cerebellum (A1–A5,B1–B5,C1–C2)and thyroid (A6–A10,B6–B10,C3–C4)tissues (original magnification ×400).Used antibodies are the following:one typical HE patient serum (no.9;A1,A6),the depleted HE patient no.9serum (A2,A7),one HT patient serum (A3,A8),one healthy individual serum (A4,A9),anti-TPO mAb47(B1,B6),60(B2,B7),15(B3,B8),9(B4,B9)and anti-Tg mAbJ7C9.3(C1,C4).Nucleus DAPI staining is shown in blue.Slides A-5/10,B-5/10and C-2/4exhibit non-specific binding for each tissue when no first antibody was added.Panel D depicts the results of a representative experiment where the HE patient no.9serum were depleted from anti-TPO aAb.Results are expressed as the binding rate to coated human TPO±1SD (error bars).18S.Blanchin et al./Journal of Neuroimmunology 192(2007)13–20exhibited specific staining of cerebellar cells from M.rhesus monkeys while none using HT patients'and healthy donors'sera.The reactivity of HE aAb with TPO epitopes was ascertained by the similar binding pattern of 4anti-TPO mAb on the same cells and confirmed in western blotting experiments showing that HE patients'sera and mAb47,an anti-TPO IDR mAb bound the same TPO isoforms forming a doublet around 100kDa (Ruf and Carayon,2006).Anti-TPO aAb depletion from HE patients'sera confirmed that the anti-TPO aAb bound solely to CNS structures.Furthermore,no cerebellar binding was detected with anti-Tg mAbJ7C9.3,which do not cross-react with anti-TPO aAb (Ruf et al.,1992).Serum aAb from HT patients did not bind cerebellar tissue consistent with differences in anti-TPO aAb repertoire between HT and HE patients.Localization of the stained cells in the subcortical cerebellar white matter and their typical star-shaped morphology were consistent with their astrocytic lineage.In double immunostaining experiments,binding of anti-TPO aAb from HE patients was colocalized with GFAP,an astrocytic marker.This was further supported by binding of the anti-TPO mAb47to normal human astrocytes in primary cultures.In-terestingly,a strong relationship between HTand cerebellar ataxia was reported (Selim and Drachman,2001).Moreover,mild astrocytic gliosis and microglial activation were previously mentioned in reports based on brain biopsies from HE patients (Castillo et al.,2006;Nolte et al.,2000).An involvement of astrocytes was noted in other CNS dysfunctions such as epilepsy and Alzheimer's disease (Blasko et al.,2004;Schipper,1996).Cephalalgia observed in several of the present HE patients may reveal astrocyte-related spreading depression (Chuquet et al.,2007).That aAb trigger neuropathic mechanisms has been previ-ously documented for anti-glutamic acid decarboxylase aAb and anti-calcium channel aAb in patients with the Stiff-personsyndrome (Dalakas et al.,2000)and the Lambert –Eaton myasthenic syndrome,respectively (Rosenfeld et al.,1993).In the present study,presence of serum and CSF anti-TPO aAb,binding of anti-TPO aAb on astrocytic cells,and improvement of the clinical symptoms after reducing the level of serum anti-TPO aAb partially meet the criteria for demonstrating patho-genicity of aAb (Sutton and Winer,2002).Although not excluding the role of other neuropathogenic antibody(ies)in HE,present data prompt identification of the astrocytic anti-genic target(s)of HE anti-TPO aAb.Experimental animal studies are needed to investigate whether passive anti-TPO aAb transfer reproduces the main features of the disease and im-munization with the putative antigen(s)leads to an animal model of the disease providing clues how neurological func-tions are impaired.AcknowledgmentsThis research was supported by a grant from the french ministère de la santéet de la protection sociale,programme hos-pitalier G42006:“Lymphocytes B et ses effecteurs normaux et pathologiques ”.We thank Dr.Benoit Dupuy and Dr.Nizam Kassis,hôpital Louis Pasteur Cherbourg,for providing sera and CSF from HE patient.The authors are also grateful to Pr.Françoise Chapon,laboratoire de neuropathologie CHU Caen,for helpful advices.ReferencesBlasko,I.,Stampfer-Kountchev,M.,Robatscher,P.,Veerhuis,R.,Eikelenboom,P.,Grubeck-Loebenstein,B.,2004.How chronic inflammation can affect the brain and support the development of Alzheimer's disease in old age:the role of microglia and astrocytes.Aging Cell 3,169–176.Brain,L.,Jellinek,E.H.,Ball,K.,1966.Hashimoto's disease and ncet 2,512–514.Fig.5.Immunoreactivity of anti-TPO aAb and mAb47to GFAP-specific astrocytic cells.Immunofluorescent staining patterns were obtained on monkey cerebellum (A –C)with sera from HE patients no.2and no.3(A –B,in green)and anti-GFAP mAb (A –B,in red)and on normal human astrocyte primary cultures (D –F)with anti-TPO mAb47(D,in red)and anti-GFAP mAb (E,in red).Nuclei are shown in blue.Non-specific binding are shown in slides C and F.(Original magnification ×400).19S.Blanchin et al./Journal of Neuroimmunology 192(2007)13–20。
Atrazine removal by powdered activated carbon in floc blanket reactors

ATRAZINE REMOVAL BY POWDERED ACTIVATEDCARBON IN FLOC BLANKET REACTORSCARLOS CAMPOS 1*M ,VERNON L.SNOEYINK 2,BENITO MARINAS 2M ,I.BAUDIN 1and INE11CIRSEE,Lyonnaise des Eaux,38Rue du President Wilson,78230Le Pecq,France and 2University ofIllinois at Urbana-Champaign,Department of Civil and Environmental Engineering,205N.MathewsAve.,Urbana,IL 61801,USA(First received 1May 1999;accepted in revised form 26June 1999)Abstract ÐThe application of powdered activated carbon (PAC)to up¯ow ¯oc blanket reactors (FBR)is widely used to reduce the concentration of organic compounds present in drinking water sources.Long carbon retention times can be reached due to the high solids concentrations attainable in the blanket,potentially resulting in organic loadings close to the maximum adsorptive capacity predicted by the isotherm.However,some operating parameters can compromise both carbon retention time and adsorption capacity,leading to poor adsorption performance.The objective of this study was to point out these parameters and to determine whether the carbon capacity determined by the bottle point isotherm test can be used to predict the removal of organic micropollutants by PAC applied in FBRs.For this purpose,a laboratory-scale up¯ow FBR was used to evaluate the steady-state removal of atrazine spiked in a natural water.The results of this study showed that the PAC was not used at its maximum capacity predicted by batch isotherm experiments,which cannot be attributable to the fact that carbon retention times were lower than 20h.It is hypothesized that carbon capacity for micropollutants in continuous-¯ow systems,where the carbon retention time is higher than the hydraulic retention time,is a function of the DOC throughput.This study also showed that carbon retention time decreases with increasing carbon dose,or hydraulic loading rate.72000Elsevier Science Ltd.All rights reservedKey words Ðadsorption,atrazine,carbon retention time,dissolved organic carbon,¯oc blanket reactor,powdered activated carbonINTRODUCTIONRecent concern over the presence of organic sub-stances of public health signi®cance in drinking water has led to the development of innovative water treatment technologies for their removal.Or-ganic compounds in ®nished water can cause aes-thetic problems,such as taste and odors,and adverse health e ects.Naturally occurring organic matter (NOM)is also a problem because it can cause color and can be the precursor material for the formation of organic disinfection by-products (James M.Montgomery,Consulting Engineers,Inc.(JMM),1985).Adsorption onto powdered activated carbon (PAC)is one process that is widely used to remove organic compounds from drinking water.Appli-cation of PAC in a conventional treatment plant can be performed at di erent locations within thetreatment train.However,other processes,such as coagulation,sedimentation,or oxidation may inter-fere with adsorption and reduce its e ciency (Najm et al .,1990;Snoeyink and Summers,1999).When PAC is added to conventional treatment units,such as coagulation or sedimentation,the carbon resi-dence time (CRT)can be very close to the hydraulic residence time,typically from 0.5to 2h.Such CRTs are too short to allow the PAC to reach its maximum adsorption capacity for most target or-ganic compounds.One reactor con®guration of interest for PAC ap-plications is the up¯ow solids contact clari®er,also known as the ¯oc blanket reactor (FBR).These reactors rely on a high-density blanket of solids to enhance ¯occulation of the coagulated suspended matter.Similarly,this blanket of solids can also entrap PAC particles that would otherwise be washed out of the reactor with the e uent due to their low density.Consequently,a high PAC con-centration can be maintained in the ¯uidized blan-ket,and retention times on the order of days can be achieved (Hoehn et al .,1987;Kassam et al .,1991).Wat.Res.Vol.34,No.16,pp.4070±4080,200072000Elsevier Science Ltd.All rights reservedPrinted in Great Britain0043-1354/00/$-see front matter4070/locate/watresPII:S0043-1354(00)00169-X*Author to whom all correspondence should be addressed.Tel.:+33-1-34-802-383;fax:+33-1-305-36209;e-mail:carlos.campos@lyonnaise-des-eaux.frHowever,some operating parameters can compro-mise both carbon retention time and adsorption ca-pacity,leading to poor adsorption performance.A few studies have attempted to evaluate adsorp-tion e ciencies when PAC is added to FBRs.Najm et al.(1993)evaluated the removal of2,4,6-trichlor-ophenol(TCP)from natural water by PAC in a laboratory-scale FBR.Since steady-state removals of TCP in the FBR were very close to those pre-dicted by the isotherm,it was concluded that the PAC was used at its maximum capacity in the blan-ket.Najm et al.(1993)also proposed a method to evaluate the extent of adsorption of organic com-pounds onto PAC in continuous-¯ow processes. However,no®eld data were used to verify the accu-racy of the predictions presented for various carbon retention times.A later study on TCP removal from the same natural water pointed out the possi-bility of heterogeneous reactions of TCP with dis-solved oxygen on the surface of the carbon particles (Adham et al.,1991).If this reaction occurred,TCP removals observed in the FBR e uent would have been not entirely attributable to adsorption onto PAC since surface reaction with oxygen may have consumed the TCP.Thus,further experimentation is needed to assess whether full isotherm capacity can be achieved in FBRs.Carbon accumulation in the blanket of a slurry recirculating clari®er was evaluated in both pilot and full-scale systems by Kassam et al.(1991). Although equilibrium capacities appeared to decrease for CRTs longer than100h,the results were not conclusive.Previous studies point out important parameters a ecting the adsorption e ciency of PAC in solids contact clari®ers,but do not present a valid approach to predict adsorption performance.The objective of this study is to verify the hypothesis that the steady-state removal of the micropollutant atrazine by PAC in a FBR can be predicted by the isotherm.The e ects of carbon dose and hydraulic loading rate on carbon concentration and carbon retention time in the blanket are also evaluated.MATERIALSWater sourceCentral Illinois groundwater with a pH of7.8,a dis-solved organic carbon(DOC)concentration of2.1mg/l, and an alkalinity of290mg/l as CaCO3was used in this study.An in¯uent suspended solids concentration of 10mg/l was achieved by adding clay(kaolinite)to the low turbidity groundwater.CoagulantsThe coagulant was reagent grade aluminum sulfate (Mallinckrodt,Inc.Paris,KC)dosed at a concentration of 40mg/l as alum together with1mg/l of a cationic poly-electrolyte(Calgon Corporation,Pittsburgh,PA).These concentrations were kept constant for all the experiments performed with the FBR.AdsorbentWPH PAC(Calgon Corporation,Pittsburgh,PA)with an iodine number of1200,6.7%ash,3%moisture,appar-ent density of0.54g/cm3,and geometric mean diameter of 10m m was used in this study.AtrazineAdsorption equilibrium and kinetics parameters were determined in batch experiments using14C-labeled atrazine (Ciba±Geigy,Greensboro,NC)with a speci®c activity of 8.3mCi/mmole.Atrazine samples were analyzed by mix-ing2.5ml aliquots of each sample with18ml of scintil-lation cocktail(Ecoscint,National Diagnostics,Manville, NJ).The emitted radiation of the mixture was measured in a liquid scintillation analyzer(Tri-Carb Model1600CA, Packard Instrument Company,Downers Grove,IL)for 30min.The detection limit of the method was0.1m g/l without need for sample concentration.Non-labeled atrazine(Chem Service,West Chester,PA), added as a step-input,was used for the experiments with the FBR.The enzyme linked immunoassay(RAPIDAssay, Strategic Diagnostics Inc.,Newtown,PA)with a detection limit of0.05m g/l was used to analyze samples containing non-labeled atrazine.All reagents involved in the analysis were supplied with the test kits provided by the manufac-turer.A series of standards prepared using14C-labeled atrazine were also analyzed using the RAPIDAssay to con®rm that atrazine results from both methods were comparable in the concentration range used in the FBR experiments.Triplicate samples at concentrations ranging from0.3to3.7m g/l analyzed by both methods were found to correlate well r2 0X995).Floc blanket reactorThe FBR consisted of a Plexiglas cylinder with an in-ternal diameter of19cm and a depth of51cm,and a con-ical bottom piece with a depth of17cm.The total volume of the blanket and the water above it was15.5l.An in-ternal tube located axially fed the in¯uent water into the bottom conical section.The water¯owed upwards through the solids blanket,and the e uent was discharged through a circular weir located at the top of the cylindrical section. Excess solids formed during the coagulation±¯occulation process as well as excess PAC particles were removed from four symmetrically distributed tubes located in the cylinder at the level corresponding to a blanket volume of 7.25l,38cm from the bottom of the reactor.Three sampling ports located at depths corresponding to1,4 and6l(15,26and34cm from the bottom,respectively) were installed to facilitate sampling for PAC density deter-mination at di erent depths in the blanket.A schematic of the FBR system is presented in Fig.1.A 208-l continuously stirred stainless steel barrel was usedasFig.1.Schematic of the laboratory-scale FBR.Atrazine removal by PAC/FBR4071an equalization basin to ensure constant in¯uent water quality.The in¯uent water was pumped from the equaliza-tion basin at a¯ow rate of0.6l/min and dosed with atra-zine,clay,alum,and polyelectrolyte from stock solutions by means of peristaltic pumps(Cole±Parmer,Chicago, IL).The in¯uent was mixed with these solids and chemi-cals in an airtight rapid mix basin.Water from the rapid mix basin¯owed into an open basin which had an outlet designed to serve as a siphon to dispense periodic pulses of water to the FBR.Fresh PAC was applied directly into this siphon basin from a stock slurry with a peristaltic pump.EXPERIMENTAL METHODS Determination of equilibrium parametersSeven-day isotherm tests were conducted in raw and coagulated groundwater for both atrazine and DOC,following the bottle point isotherm technique as outlined by Randtke and Snoeyink(1983). Duplicate samples were taken from each bottle,®l-tered through a0.45m m membrane®lter(Micron Separations,Westboro,MA)and analyzed for DOC using a Phoenix8000TOC Analyzer(Tek-mar-Dohrmann,Cincinnati,OH).Samples contain-ing14C-labeled atrazine were analyzed using the procedure outlined previously.The amount adsorbed onto the PAC was calculated by using a mass balance.Solid and liquid phase concentrations were plotted on a log±log scale graph and the data were®tted with the Freundlich equation.The pro-cedure to evaluate equilibrium parameters for atra-zine in the presence of NOM is discussed in the section on mathematical modeling. Determination of kinetic parametersBatch kinetic tests were run with both raw and coagulated groundwater in order to determine the homogeneous surface di usion coe cient,D s,of DOC and atrazine.These kinetic tests were per-formed for a minimum of4h.Identical mixing con-ditions were applied to all batch reactors tested simultaneously by means of an overhead stirrer (Phipps&Bird,Richmond,VA)that rotated at a minimum of240rpm.Prior to its use in batch tests, PAC was soaked overnight in organic-free deio-nized distilled water(DOC<0.1mg/l)to allow for complete wetting of the pores.The di usion coe cient for DOC adsorption was estimated using a search routine based on the Homogeneous Surface Di usion Model(HSDM) developed for single-solute systems,which mini-mizes the di erences between the predicted kinetic curve and the experimental data(Hand et al., 1983).The atrazine apparent di usion coe cient in natural water was evaluated by using the pseudo single-solute approach of Qi et al.(1994),which is discussed in the section on mathematical modeling. PAC concentration in the blanketWhen the concentration of PAC in the FBR e uent is negligible compared to the PAC concen-tration in the blanket,the average residence time of the PAC particles at steady-state can be calculated by dividing the mass of carbon present in the blan-ket by the PAC dosage rate.Thus,the CRT can be evaluated with the following expression(Najm et al.,1993):CRTr b V bC c Q l1where r b is the average PAC concentration in the ¯oc blanket,V b is the volume of the blanket,Q l is the in¯uent water¯owrate,and C c is the carbon dose.The PAC concentration(r b)was evaluated at three depths of the blanket in order to determine whether the pulsed feed provided a homogeneous ¯uidization for the range of PAC doses tested.One hundred milliliter samples were withdrawn at sample ports corresponding to1,4and6l volumes of the blanket from the bottom of the reactor. Average PAC densities were calculated by account-ing for the fractions of the blanket volumes rep-resented by each sampling port.The sampling sequence was from top to bottom in order to pre-vent disturbances of blanket structure in subsequent samples.For all FBR experiments,a second batch of samples was collected12h after taking the®rst batch of samples,in order to check whether steady-state conditions were fully developed for each car-bon dose.Total solids and PAC mass were deter-mined using the procedure outlined by Najm et al. (1993).MATHEMATICAL MODELINGNajm et al.(1993),Qi et al.(1994),and Najm (1996)proposed models to describe the steady-state removal of organic micropollutants from natural waters when PAC is applied in various continuous-¯ow systems.In their systems,it was assumed that the PAC particles had an exponential residence time distribution,and that all particles were exposed to the same adsorbate concentration in sol-ution.Under these assumptions in a PAC/UF sys-tem operated as a completely mixed tank reactor (CSTR),Qi et al.(1994)successfully veri®ed atra-zine removals predictions for various CRTs using the expression proposed by Nakhla et al.(1989):q FBR q I,FBRHd1À6p2Ii 11i2 1 i2p2D sR2CRTIe2 with:q I,FBR KC1a n FBR 3 where K and1/n are the Freundlich equilibrium parameters,D s is the surface di usion coe cient,Carlos Campos et al. 4072CRT is the carbon retention time in the reactor, q FBR is the amount adsorbed per mass of carbon, and q I,FBR is the amount of organic compound adsorbed per mass of carbon at equilibrium with the concentration exiting the reactor,C FBR.The concentration of the organic compound in solution exiting the FBR can be evaluated by using a mass balance in the reactor:C inÀC FBRÀq FBR C c 0 4 where C in and C FBR are the atrazine concentrations in the FBR in¯uent and e uent,respectively,and C c is the carbon dose.The application of equation(3)requires the prior determination of the maximum carbon capacity for the given initial concentration of the trace organic compound in the presence of NOM.For such mul-tisolute systems,adsorption capacity dependence on initial concentration of the trace compound has been characterized for a variety of trace organic compounds(Najm et al.,1991;Qi et al.,1994;Gil-logly et al.,1998;Knappe et al.1998).Using the Ideal Adsorbed Solution Theory coupled with the Equivalent Background Compound Method, Knappe et al.(1998)developed a simple method to predict adsorption capacities of trace organic com-pounds in the presence of NOM.This method reduces signi®cantly the amount of experimental data to be collected and eliminates the need for computer modeling.For a given carbon dose,the percentage of trace compound remaining in solution at equilibrium is independent of the initial concen-tration of the trace compound.For atrazine,this method is valid as long as the initial concentration is less than50m g/l.Once the plot of percent atra-zine remaining vs PAC dose is established,carbon capacity can be calculated for each carbon dose for any initial concentration(Knappe et al.1998).In this study,the simpli®ed approach proposed by Knappe et al.(1998)to estimate equilibrium ca-pacities is coupled with equations(2)±(4)to predict steady-state atrazine removals in up¯ow FBRs for a variety of carbon doses and blanket operating con-ditions.Model predictions are compared with ex-perimental data and the applicability of this modeling approach in continuous-¯ow adsorption systems is discussed.RESULTS AND DISCUSSION Evaluation of equilibrium parameters Determination of the equilibrium parameters for atrazine adsorption in the FBR required the evalu-ation of the e ect of coagulation of a fraction of the in¯uent DOC on the atrazine adsorption iso-therm.For this purpose,DOC isotherms were con-ducted in raw and coagulated groundwater using the same coagulant dose as in the continuous-¯ow experiments.Addition of40mg/l aluminum sulfate resulted in a coagulation pH of7.4.Coagulation reduced the DOC concentration from2.1to1.7mg/ l.Figure2shows the results of these isotherm tests and the®t of the experimental data using the Freundlich isotherm.The same Freundlich par-ameters,a K of39.5(mg DOC/g PAC)(l/mg)1/n and a1/n of1.47,were used to®t the experimental data for both the raw and coagulated water r2 0X9718).Data points corresponding to carbon doses higher than300mg/l were excluded from this analysis since these carbon doses are too high to be used in drinking water applications.Additional iso-therms were determined in raw water only and assumed to apply to coagulated water.Atrazine adsorption isotherms were conducted in groundwater to evaluate the dependence of atrazine capacity on its initial concentration.Three isotherm tests,one in organic-free water and two in ground-water were performed to calibrate the EBC model and to develop the plot of percent atrazine remain-ing vs PAC dose proposed by Knappe et al.(1998). The atrazine initial concentrations used for the groundwater isotherms were54.7and 2.0m g/l, whereas515.8m g/l was used in the single-solute iso-therm test.No losses of atrazine were observed in the blanks of the isotherm tests,which con®rmed that adsorption on either the Te¯on tape or the glassware did not contribute to atrazine removal. Figure3shows the experimental data used to cali-brate and verify the EBC model,and the increase in competition from NOM as atrazine initial concen-tration decreases.The single-solute isotherm par-ameters,K and1/n,were238.2(m mol/g)(l/m mol)1/n and0.44,respectively.The EBC parameters from the calibration were a K of1229.4(m mol/g)(l/ m mol)1/n,a slope1/n of0.53,and an initial concen-tration of1.07m mol/l.An additional isotherm in groundwater,using an initial concentration of 28.5m g/l,was used to verify the predictions of the EBCmodel.Fig.2.Isotherm for DOC adsorption from raw and coa-gulated groundwater onto WPH PAC.Atrazine removal by PAC/FBR4073The applicability of the Knappe et al .(1998)approach is illustrated in Fig.4,where the equili-brium data and model predictions for various atra-zine initial concentrations are plotted as percent atrazine remaining vs PAC dose.Also shown in Fig.4are the percent atrazine remaining data that were obtained in the isotherm experiment using coa-gulated groundwater.The agreement of these data with the other data sets provides further evidence to show that coagulation did not a ect atrazine adsorption capacity.Reduction of adsorption capacity for atrazine due to NOM adsorption was evaluated in an iso-therm experiment where atrazine was introduced after the PAC had been in contact with the in¯uent NOM for 7days.The initial atrazine concentration used in this experiment was 40.3m g/l,and the PAC doses ranged from 2to 20mg/l.After contact with atrazine for 7days,the atrazine percent remaining in solution was higher than predicted by the EBC model for simultaneous adsorption of NOM andatrazine.As shown in Table 1,the di erences in percent atrazine remaining decreased as PAC dose increased.Although the percentage di erences are small,they translate to capacity reductions of up to 24%.Evaluation of di usion coe cientThis section presents the results of a series of kin-etic tests performed to evaluate the e ect of coagu-lation and NOM preloading on atrazine adsorption kinetics.The results of DOC adsorption kinetics can be found elsewhere (Campos,1999).Five batch reactors were run in parallel using the same carbon dose of 4mg/l and the same groundwater dosed with 10mg/l of kaolinite.The DOC and atrazine concentrations of these tests were 2.1mg/l and 9.8m g/l,respectively.In the ®rst reactor,PAC was added to a groundwater spiked with atrazine,to simulate the adsorption conditions in the absence of coagulation.In the second reactor,PAC and 40mg/l of alum were added to groundwater spiked with atrazine,to simulate simultaneous coagulation and adsorption conditions.In the third reactor,PAC was added to a solution that contained groundwater previously spiked with atrazine and alum (2h),to simulate coagulation and adsorption occurring sequentially.No atrazine removal was observed by alum coagulation or by adsorption onto kaolinite.In the fourth unit,atrazine was spiked to a solution in which groundwater,alum,and PAC were allowed to react for 2h prior to the atrazine ad-dition.This was done to investigate the e ect of prior PAC exposure to NOM and alum on atrazine adsorption kinetics.A ®fth reactor reproduced the conditions tested with the fourth unit test but with-out alum,to isolate the preloading e ect of NOM from any fouling associated with the formation of aluminum colloids in the pores of the activated car-bonparticles.Fig.3.Atrazine isotherms in organic-free water and inCentral Illinoisgroundwater.Fig.4.Percent remaining vs carbon dose for various atra-zine initialconcentrations.Fig.5.E ect of coagulation on atrazine adsorption kin-etics.Carlos Campos et al.4074The results of these tests (Fig.5)are consistent with the equilibrium experiments.Neither simul-taneous nor prior NOM coagulation a ected atra-zine adsorption kinetics.An apparent di usion coe cient of 2X 0Â10À11cm 2/min,comparable to the value obtained by other authors (Qi et al .,1994),was obtained by ®tting the pseudo-single solute HSDM predictions using the equilibrium ca-pacity with the kinetic data corresponding to simul-taneous adsorption of NOM and atrazine in the batch reactor.However,a signi®cant reduction in atrazine adsorption rate was observed when the PAC was pre-exposed to NOM for 2h,and this e ect was not changed by alum coagulation.This result shows that NOM can hinder atrazine adsorp-tion.An HSDM model prediction,using the di u-sion coe cient obtained in the case of simultaneous adsorption of NOM and atrazine,and a capacity reduced by 24%in accordance with the NOM pre-loaded isotherm,did not ®t the experimental data well.Consequently,a reduction in equilibrium ca-pacity alone could not explain the reduction in the adsorption rate.The HSDM ®t of this set of kinetic data using the isotherm capacity reduced by 24%resulted in a di usion coe cient of 7X 0Â10À12cm 2/min.Therefore,prior adsorption of NOM appeared to reduce both di usivity and capacity.The reduction of adsorption rate might be caused by a reduction of surface di usion coe cient due to pore blockage of the adsorbed NOM molecules,and/or by the reduction in adsorption capacity for atrazine due to irreversible adsorption of NOM molecules in sites potentially available for atrazine adsorption.This observation agrees with those of Pelekani (1999)who showed that the rate of adsorption decreases as pore blockage from com-peting adsorbate occurs.Also,this author showed that capacity decreases as the adsorbed NOM increases.Furthermore,according to the HSDM model,a decrease in capacity will result in a decrease in the rate of adsorption (Crittenden and Weber,1978).The observation that the rate of atrazine adsorp-tion was the same when the water was coagulated as it was when no coagulant was applied is consist-ent with the isotherm experiments.It shows that co-agulation did not a ect atrazine concentration.In addition,this observation shows that alum did notremove the NOM fraction that competes directly with atrazine for adsorption sites.E ect of carbon dose on carbon retention time (CRT)When analyzing the factors a ecting the CRT in FBRs,it should be noted that the parameters in equation (1)are not independent.For the same in¯uent quality characteristics,the concentration of carbon in the blanket (r b )is dependent not only on the carbon dose (C c )but also on the hydraulic load-ing rate.The dependence of PAC density in ¯oc blankets on PAC dose has been reported in pre-vious studies (Kassam et al .,1991;Najm et al .,1993).This dependence was also observed for the range of PAC doses tested in this study:PAC den-sity in the blanket increased as PAC dose increased (2±15mg/l)for a constant in¯uent water quality (in¯uent turbidity),coagulating conditions,and hydraulic loading rate.However,the CRT decreased as PAC increased because PAC density did not increase proportionally with PAC dose.The observed relationship is depicted in Fig.6.A similar e ect may be expected if the in¯uent turbidity increases since the solids removal rate would increase to maintain steady-state conditions in the blanket (Kassam et al .,1991).E ect of blanket depth on carbon retention time According to equation (1),CRT should increaseTable 1.Isotherm experiment for atrazine adsorption after the PAC had been contacted with NOM for 7daysPAC dose (mg/l)C eq (m g/l)C /C 0measured (%)C /C 0predicted a (%)Di erence (%)218.746.335.011.447.4218.411.9 6.56.1 3.097.7 5.1 2.59.1 1.42 3.5 2.2 1.312.10.88 2.2 1.2 1.020.70.320.80.40.4aFrom C /C 0vs PAC dose plot in rawwater.Fig.6.E ect of PAC dose on carbon retention time in the blanket.V b 7X 25l,hydraulic loading rate=1.3m/h.Atrazine removal by PAC/FBR4075in direct proportion to blanket depth.In this study,the e ect of blanket depth on CRT was evaluated for two di erent PAC doses (4and 8mg/l)and a hydraulic loading rate of 1.3m/h (see Table 2).For a PAC dose of 4mg/l,increasing the blanket volume from 7.25to 14l did not greatly a ect the PAC concentration in the blanket,while the CRT increased by a factor of 1.7,from 17to 29h.Simi-larly,for a PAC dose of 8mg/l,increasing the volume of the blanket by a factor of 1.9resulted in a CRT increase by a factor of 1.5,from 15to 23h.In this case,both solids and PAC densities were 20±30%lower for the larger blanket volume than those obtained for a blanket of 7.25l,which suggests that coagulating conditions and resulting ¯oc structure may have been slightly di erent.In full-scale applications of the FBR,increasing CRT by increasing blanket depths may not be a feasible alternative.These types of clari®ers usually operate with blanket depths of 2±3m,and oper-ators may have no control over the blanket depth.Under such conditions,increasing the CRT would have to be accomplished by increasing the blanket density,and there is a limit to the maximum density that can be achieved.For example,with a PAC dose of 10mg/l,a hydraulic loading rate of 4m/h and a blanket depth of 2m,a PAC concentration in the blanket higher than 500mg/l would be necessary to provide a CRT greater than one day.Achieving such PAC concentration may not be possible under this hydraulic loading rate.E ect of hydraulic loading rate on carbon retention timeHydraulic loading rate plays an important role in determining the PAC density in the ¯uidized blan-ket and consequently,in determining CRT.In this study,the blanket ¯uidization conditions and the resulting PAC concentrations were evaluated when the hydraulic loading rate was reduced from 1.3m/h to 0.65m/h,for two di erent PAC doses (4and 8mg/l)and a blanket volume of 14l.PAC concen-trations and total solids resulting from these runs are summarized in Table 2.As hydraulic loading rate decreased,the ¯ow velocity decreased,resultingin denser blankets.For a carbon dose of 4mg/l,the decrease in hydraulic loading rate resulted in an increase in PAC concentration from 300to 625mg/l,and an increase in CRT by a factor of 4,from 29to 122h.Similarly,for a carbon dose of 8mg/l,PAC densities in the blanket increased from 480to 1365mg/l,which resulted in an increase of CRT from 23to 133h.These observations were consistent with the ex-perimental data reported by Najm et al .(1993)for which in¯uent water quality and coagulant doses were very similar to those used in this study.These authors reported that an increase in the hydraulic loading rate from 1to 1.5m/h resulted in a re-duction in the CRT from 25to 10h,for a PAC dose of 10mg/l.This observation has important en-gineering implications since a decrease in CRT may reduce PAC adsorption e ciency.Hydraulic load-ing rates typically used in the design of these type of clari®ers range from 1.3to 3m/h (Kawamura,1991),to as high as 4±8m/h (Degre mont,1989).Fluidization conditions in the blanketFluidization conditions in the blanket were alsoevaluated in this study in order to validate the assumption of a completely mixed blanket.Previous studies on slurry recirculating clari®ers (Kassam et al .,1991)reported that the PAC was evenly distrib-uted throughout the blanket.However,when ¯uidi-zation of the blanket in an FBR is accomplished by using hydraulic pulses,higher PAC densities may result at the bottom of the reactor.In this study,PAC concentrations measured at the bottom of the blanket were higher than those near the top of the blanket.This observation was more pronounced with increasing PAC dose,as illustrated in Fig.7.Consequently,some combination of operating con-ditions,such as low hydraulic loading rate and high carbon doses,may result in PAC density gradients in the blanket,and therefore,the assumption of a completely mixed ¯uidized bed would not be entirely applicable.Another important aspect for validating the assumption of a homogeneous blanket,was to determine whether segregation of the PAC particlesTable 2.Summary of FBR operating conditions and PAC/solids concentrations in blanketPAC dose (mg/l)Hyd.load (m/h)Blanket vol.(l)PAC/Solids (mg/l/mg/l)PAC (%)CRT hours1-l Port4-l Port 6-l Port Average 2 1.37.25206/1089177/928157/820183/96119184 1.37.25366/1376329/1192315/1155340/125727174 1.314312/1667296/1231296/1190300/1298232940.6514714/2877610/2457598/2400625/2510251228 1.37.25654/1970565/1641529/1476591/172634158 1.314565/1439473/1257454/1218480/1271382380.65142302/53821151/27001100/25701365/31914313315 1.37.25977/2307713/1602599/1289787/1797441130a1.3a 7.25a 1750/5750a 1500/3250a1400/2500a1500/4052aNC 11aaFrom Schimmoller et al .(1995).NC:not constant.Carlos Campos et al.4076。
氨基糖苷类耐药机制
Vol. 43, No. 4
MINIREVIEW
Aminoglycosides: Activity and Resistance
MARIE-PAULE MINGEOT-LECLERCQ,1* YOURI GLUPCZYNSKI,2 AND PAUL M. TULKENS1 Unit´e de Pharmacologie Cellulaire et Mol´eculaire, Universit´e Catholique de Louvain, Brussels,1 and Service de
Microbiologie, Cliniques Universitaires UCL de Mont-Godinne, Yare highly potent, broad-spectrum antibiotics with many desirable properties for the treatment of lifethreatening infections (28). Their history begins in 1944 with streptomycin and was thereafter marked by the successive introduction of a series of milestone compounds (kanamycin, gentamicin, and tobramycin) which definitively established the usefulness of this class of antibiotics for the treatement of gram-negative bacillary infections. In the 1970s, the semisynthetic aminoglycosides dibekacin, amikacin, and netilmicin demonstrated the possibility of obtaining compounds which were active against strains that had developed resistance mechanisms towards earlier aminoglycosides as well as displaying distinct toxicological profiles (65). Since then, however, the pace of development of new aminoglycosides has markedly slowed down. Conversely, we have witnessed a period of extensive basic and clinical research which has made us view these drugs very differently from what was commonly accepted when they were first introduced in the clinic. We attempt to present and discuss these developments, not to ascertain whether there is a likelihood that new molecules or effective means to avoid bacterial resistance and drug-induced toxicity will eventually reach the clinical arena, but to foster continuing research on aminoglycosides and to make the clinician aware of the pertinent progress made in this area. The present paper is focused on activity and resistance, whereas the companion review (65) deals with nephrotoxicity (ototoxicity has been reviewed earlier in this journal [4]). In both reviews, we did not attempt to be exhaustive in any of these domains, and the material presented has been selected on the basis of its interest in terms of new concepts or because it deals directly with the design of new aminoglycosides or an improved use of the available agents.
chancefavorsthepreparedmind
Editorial CommentChance Favors the Prepared MindMark C.Bates,*MD,FACC,FSCAIDepartment of Surgery,Charlesto Area Medical Center,Charleston,West VirginiaIn1894,during his inaugural lecture as the new Dean of University of Lille in Douai France,Louis Pasteur[1]commented;‘‘Dans les champs de l’obser-vation,le hazard ne favorise que les esprits pre´pare´s’’(In thefields of observation,chance favors only pre-pared minds).Such is the case100years later when Dr.Juan Parodi began his meticulous observation of changes in transcranial Dopplerflow patterns during different stages of carotid endarterectomy(CEA).It is likely many of us had seen these patterns before but after reflecting on thefindings Dr.Parodi recognized some interesting subtle cerebralflow physiology sig-nals.He was able to then amplify middle cerebralflow patterns during CEA with passive and active back bleeding of the internal carotid artery(ICA)in wake patients without causing symptoms.Through this work he then postulated that transcatheter carotidflow con-trol and even reversal may be possible with a balloon tipped sheath in the common carotid artery(CCA).He also recognized the importance of collateralflow from the external carotid artery(ECA)and that persistent antegrade ICAflow via retrograde ECA collateraliza-tion could be expected during CCA occlusion and accordingly ECA occlusion would also be required to achieve protection.He believed occlusion of the ECA using a balloon on a wire navigated through the bal-loon tipped CCA sheath would solve the issue and the two components proximal carotid protection system reported herein was born.Interestingly,around the same time,a group of innovative well-known clini-cians in Italy were also considering proximal protec-tion alternatives tofilters and their pioneering work gave rise to the single component proximalflow con-trol system(Mo.Ma.,Invatec,Roncadelle,Italy) While Dr.Parodi was solidifying his proximal protec-tion vision our team was developing a distalfilter protection system for carotid stenting.Based on our interpretation of past basic science embolization research and clinical analysis of the particle size thresh-old associated with documented neurologic events caused by particles from10to50microns,it seemed thefilter pore size threshold should be well below50 microns[2].Unfortunately animal studies with sub-50 micron porefilter prototypes were disastrous as theflow resistance not only occluded the vessel but also caused a‘‘sail’’effect forcing the system forward withflow while also frequently causing thefilter material to sepa-rate from the cage.Like many others,we began arbitra-rily increasing pore size to solve theflow resistance issue.In the end,we found the ideal pore size needed to ensure normal end organflow was best calculated by balancing the individual pore size and number of pores with the cone length to achieve the samefinal total pore cross-sectional area as the target vessel cross-sectional area(note:In carotids this turned out to be around100 microns with our25mm cone length).Thus,the current filter pore size for available distal protection systems was selected based on the ability to maintainflow rather than objective data on particle size safety.Coincident with our work Dr.Takao Ohki[3]began studyingfilter embolic capture performance with a unique ex vitro model and found embolization(although minor)occurs during crossing with the wire andfilter before protection can be initiated.Dr.Ohki’s work amplified our concerns aboutfilters and it was at this time we were introduced to Dr.Parodi’s concept which seemed to solve some of the theoretical concerns related tofilters.We then teamed up with Drs Parodi,Ohki, and Claudio Schonholz to move the proximal protection vision forward.The initial method offlow reversal with the Parodi system was passive back bleeding through the Touhy valve or via10cc syringe suction.During thefirstflow reversal animal studies in Charleston,we found there was significant blood loss and saturation of the opera-tivefield during passive back bleeding.Out of neces-sity,we worked on several remedies and found gradient Conflict of interest:Nothing to report.*Correspondence to:Mark C.Bates,MD,Department of Surgery, Charlesto Area Medical Center,3110MacCorkle Avenue,SE Char-leston,WV25304.E-mail:********************Received14October2012;Revision accepted15October2012DOI10.1002/ccd.24714Published online5December2012in Wiley Online Library ().'2012Wiley Periodicals,Inc.Catheterization and Cardiovascular Interventions80:1069–1071(2012)driven passiveflow may be achieved by simply creating a connection between the CCA balloon occlusion sheath and a venous sheath.We obtained adapters and an in-linefilter from our hospital perfusion department and with a simple sheath to sheath connection we were able to maintain continuous retrograde carotidflow without blood loss or ICC vessel collapse due to inadvertent excess syringe suction.Thefilter was added to avoid paradoxical embolization in patients with unrecognized PFO.After establishing the A-V connection,the egress of lead particles injected into the porcine carotid artery could be observed onfluoroscopy,then followed retro-grade back into the sheath and ultimately captured in the shuntfilter outside the body.In1999,thefirst carotidflow reversal case was per-formed in Buenos Aires,Argentina by Dr Parodi.We selected a patient with a baseline ECA occlusion to simplify thefirst-in-man index case.Note in Fig.1, the left ICA lesion is imaged by contrast injection into the right carotid artery confirmingflow-reversal.Dur-ing the subsequent formative years of carotid artery stent(CAS)maturation,distalfilter systems were favored over proximal protection due to ease-of-use and acceptable results.Reflecting on our early enthusi-asm regardingflow reversal in the context of recent successful large randomizedfilter trials,one could argue our concerns about embolization during crossing the lesion and risk of reduced cognitive function due to microembolization may have been overreaching. However,in the lead article by Demitrios Nikas and col-leagues evaluating CAS withflow reversal,wefind one of the lowest neurologic event rates reported to date (<1%major stroke).The intolerance was lower than reported in previousflow reversal studies and this was likely related to patient selection.The authors noteflow reversal seems to be better tolerated thanflow arrest and speculate this may be related to favorable changes in in-tracranialflow patterns.We were also surprised in early years regarding thefinding thatflow reversal paradoxi-cally seemed to be better tolerated than distal ICA bal-loon occlusion.The intracranialflow change explanation by the authors is interesting but this unexpectedfinding may also be due to recruitment of collateralflow from the pial arteries duringflow reversal.The remarkable low MAE in this series is notewor-thy but there are some limitations to the study that soften the conclusions as detailed by the authors.Obvi-ously,the sample size and nonrandomized design limits our ability to compare against other protection systems.In addition,the trialists were all well-known, experienced CAS experts,so we must be cautious about extrapolation of thesefindings to the general population of interventional physicians.Indeed,we cannot conclude from this study thatflow reversal should replace distal protection but this study adds to the increasing argument that a randomized trial against distal protection may be warranted.In the meantime, we believeflow reversal should be considered in patients with complex or echolucent plaque as well as those with poor cerebral reserve who may not be able to tolerate microembolization.It may also have a role in symptomatic patients and octogenarians but addi-tional data are needed.The neurologic benefit will always need to be counterbalanced by the need fora Fig.1.A:Contralateral carotid contrast injection during left carotidflow reversal.B:Contrast from the contralateral injec-tion nowfilling the left carotid retrograde illustrating the target critical left carotid lesion undergoing treatment.Catheterization and Cardiovascular Interventions DOI10.1002/ccd.Published on behalf of The Society for Cardiovascular Angiography and Interventions(SCAI). 1070Mark Bateslarger sheath and potential increased risk of access complications along with the need for venous access,flow reversal intolerance,and procedure complexity. Dr.Parodi dramatically changed medicine through his pioneering work in the stent graft treatment of aneurysmal disease and once again seems to have posi-tively impacted patient care though his gift of seeing what others have observed but with a creative and ‘‘prepared mind.’’REFERENCES1.Pasteur L.Respectfully quoted,no174.Available at:http:///73/174.html(accessed October14,2012).2.Moody DM,Bell MA,Challa VR,Johnston WE,Prough DS.Brain microemboli during cardiac surgery or aortography.Ann Neurol1990;28:477–486.3.Ohki T,Roubin GS,Veith FJ,Iyer SS,Brady E.Efficacy of afil-ter device in the prevention of embolic events during carotid angioplasty and stenting:An ex vivo analysis.J Vasc Surg 1999;30:1034–1044.Chance Favors the Prepared Mind1071 Catheterization and Cardiovascular Interventions DOI10.1002/ccd.Published on behalf of The Society for Cardiovascular Angiography and Interventions(SCAI).。
科学实验室用的辐射探测器说明书
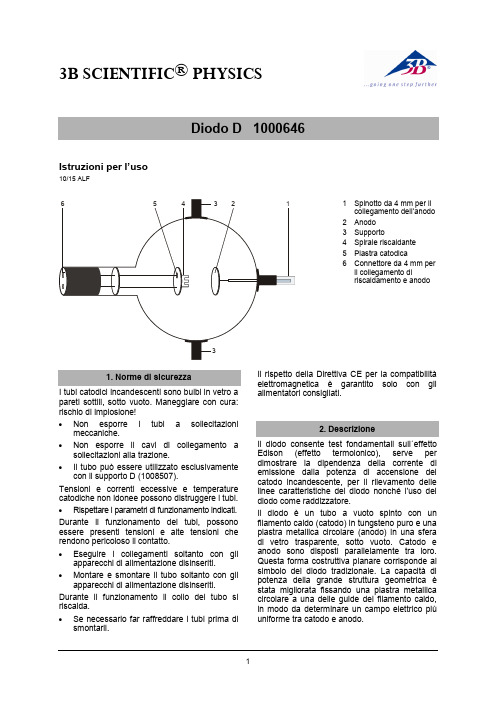
3B SCIENTIFIC® PHYSICSIstruzioni per l’uso10/15 ALF1 Spinotto da 4 mm per ilcollegamento dell’anodo2 Anodo3 Supporto4 Spirale riscaldante5 Piastra catodica6 Connettore da 4 mm peril collegamento diriscaldamento e anodo I tubi catodici incandescenti sono bulbi in vetro apareti sottili, sotto vuoto. Maneggiare con cura:rischio di implosione!∙Non esporre i tubi a sollecitazionimeccaniche.∙Non esporre il cavi di collegamento asollecitazioni alla trazione.∙Il tubo può essere utilizzato esclusivamentecon il supporto D (1008507).Tensioni e correnti eccessive e temperaturecatodiche non idonee possono distruggere i tubi.∙Rispettare i parametri di funzionamento indicati.Durante il funzionamento dei tubi, possonoessere presenti tensioni e alte tensioni cherendono pericoloso il contatto.∙Eseguire i collegamenti soltanto congliapparecchi di alimentazione disinseriti.∙Montare e smontare il tubo soltanto con gliapparecchi di alimentazione disinseriti.Durante il funzionamento il collo del tubo siriscalda.∙Se necessario far raffreddare i tubi prima dismontarli.Il rispetto della Direttiva CE per la compatibilitàelettromagnetica è garantito solo con glialimentatori consigliati.Il diodo consente test fondamentali sull´effettoEdison (effetto termoionico), serve perdimostrare la dipendenza della corrente diemissione dalla potenza di accensione delcatodo incandescente, per il rilevamento dellelinee caratteristiche del diodo nonché l’uso deldiodo come raddizzatore.Il diodo è un tubo a vuoto spinto con unfilamento caldo (catodo) in tungsteno puro e unapiastra metallica circolare (anodo) in una sferadi vetro trasparente, sotto vuoto. Catodo eanodo sono disposti parallelamente tra loro.Questa forma costruttiva planare corrisponde alsimbolo del diodo tradizionale. La capacità dipotenza della grande struttura geometrica èstata migliorata fissando una piastra metallicacircolare a una delle guide del filamento caldo,in modo da determinare un campo elettrico piùuniforme tra catodo e anodo.Tensione di accensione: ≤ 7,5 V Corrente di accensione: ≤ ca. 3 A Tensione anodo: max. 500 V Corrente anodo: tip. 2,5 mA conU A= 300 V,U F = 6,3 V CC Lunghezza del tubo: ca. 300 mm Diametro: ca. 130 mm Distanza tra catodo eanodo: ca. 15 mmPer il funzionamento del diodo sono inoltre necessari i seguenti dispositivi:1 Portatubo D 1008507 1 Alimentatore CC 500 V (@230 V) 1003308 oppure1 Alimentatore CC 500 V (@115 V) 1003307In aggiunta si consiglia:Adattatore di protezione bipolare 10099614.1 Inserimento del tubo nel portatubi∙Montare e smontare il tubo soltanto con gli apparecchi di alimentazione disinseriti.∙Spingere completamente all'indietro il dispositivo di fissaggio del portavalvole.∙Inserire il tubo nei morsetti.∙Bloccare il tubo nei morsetti mediante i cursori di fissaggio.∙Se necessario, inserire un adattatore di protezione sui jack di collegamento del tubo.4.2 Rimozione del tubo dal portatubi∙Per rimuovere il tubo, spingere di nuovo all'indietro i cursori di fissaggio e rimuoverlo.5.1 Produzione di portatori di caricamediante un catodo incandescente (effetto Edison) nonché misurazione della corrente anodica in funzione della tensione di accensione del catodo incandescenteSono necessari inoltre:1 Multimetro analogico AM50 1003073 ∙Realizzare il collegamento come illustrato in figura 1. Collegare il polo negativo della tensione anodica al connettore da 4 mmcontrassegnato con il segno meno sul collo del tubo.∙Avviare il test con un riscaldamento freddo (tensione di accensione U F = 0 V).∙Variare la tensione anodica U A tra 0 e 300 V. In pratica non c’è pass aggio di corrente (< 0,1 µA) tra catodo e anodo, anche se in presenza di alte tensioni.∙Applicare una tensione di 6 V al riscaldamento finché diventa caldo.Aumentare gradualmente la tensione anodica e misurare la corrente anodica.∙Riazzerare la tensione di accensione e far raffreddare il riscaldamento. Quindi, con tensione anodica costante, aumentare gradualmente la tensione di accensione e osservare la corrente anodica I A.Con tensione di accensione costante, la corrente anodica aumenta con l’aumentare della tensione anodica.Con tensione anodica costante, la corrente anodica aumenta con l’aumentare della tensione di accensione.5.2 Rilevamento delle linee caratteristichedel diodo∙Realizzare il collegamento come illustrato in figura 1. Collegare il polo negativo della tensione anodica al connettore da 4 mm contrassegnato con il segno meno sul collo del tubo.∙Selezionare la tensione 4,5 V, 5 V e 6 V.∙Determinare la corrente anodica I A per la rispettiva tensione di accensione in funzione della tensione anodica U A. All’uopo, aumentare la tensione anodica in fasi da 40 V a 300 V.∙Riportare in un diagramma le coppie di valori I A- U A per la rispettiva tensione di accensione.Con l’aumentare della tensione anodica, la corrente anodica aumenta fino a raggiungere un valore di saturazione.Con l’aumentare della tensione di accensione, aumenta l’inte nsità della corrente anodica.5.3 Il diodo come raddrizzatoreSono necessari inoltre:1 Resistenza di 10 kΩ1 Generatore di tensione per una tensione di 16 V CA 1 Oscilloscopio∙Montaggio come illustrato in Fig. 3 con U F = 6,3 V e U A = 16 V CA.∙Sull’oscilloscopio osservare l’effetto raddizzante del diodo.Nel circuito anodico del diodo azionato con tensione alternata, è presente una corrente continua determinata dal blocco di una semifase.Fig. 1 Rapporto di dipendenza della corrente anodica dalla tensione di accensione e misurazione della correnteanodicaFig. 2 Linee caratteristiche del diodo. La corrente anodica in funzione della tensione anodicaFig. 3 Il diodo come raddrizzatore3B Scientific GmbH ▪ Rudorffweg 8 ▪ 21031 Amburgo ▪ Germania ▪ 。
伯杰氏细菌鉴定手册最新版弧菌科部分
GENUS XIII.SHEWANELLA491M NaCl.Growth occurs at4–30ЊC.Optimum growth tem-perature is25ЊC.Grows between pH6–8.Optimum pH for growth is7.0.Chemoheterotrophic facultative anaerobe.Can grow an-aerobically using nitrate,fumarate,iron,manganese, TMAO,thiosulfate,and elemental sulfur as alternative elec-tron acceptors with lactate acting as the carbon source.Cat-alase,oxidase,and lipase positive.Amylase and gelatinase negative.Glucose,galactose,lactate,acetate,pyruvate,cit-rate,succinate,glutamate,Casamino acids,yeast extract, and peptone are used aerobically as energy sources.Fruc-tose,glycerol,sorbitol,arabinose,formate,and ethanol are not utilized.Isolated from the accessory nidamental glands of female adults of the squid species Loligo pealei.The mol%GםC of the DNA is:45.0(HPLC).Type strain:ANG-SQ1,ATCC700345.GenBank accession number(16S rRNA):AF011335.12.Shewanella violacea Nogi,Kato and Horikoshi1999,341VP(Effective publication:Nogi,Kato and Horikoshi1998b, 337.)Јce.a.L.gen.n.violacea of violet.Cells are straight or slightly curved rods,0.8–1.0ן2–4l m.Colonies on marine agar are circular,smooth,convex with entire edges,and butyrous in consistency.After2–3d, colonies are nonpigmented;after more than7d,colonies appear violet.NaCl is required for growth;optimal levels for growth are2–3%.No growth with6%NaCl.Psychrophilic.Grows optimally between4–10ЊC.Baro-philic.Optimal pressure for growth is30MPa.Other characteristics are as given in the genus descrip-tion and in Table BXII.c.148.Acid is produced from cel-lobiose and d-galactose,but not from dl-arabinose,d-fruc-tose,glycerol,inositol,lactose,maltose,d-mannitol,d-man-nose,d-raffinose,l-rhamnose,d-sorbitol,sucrose,d-treha-lose,or d-xylose.Isolated from the Ryukyu Trench,northwest Pacific Ocean,at a depth of5110m.The mol%GםC of the DNA is:47(T m).Type strain:DSS12,JCM10179.GenBank accession number(16S rRNA):D21225.13.Shewanella woodyi Makemson,Fulayfil,Landry,Van Ert,Wimpee,Widder and Case1997,1039VPwoodЈy.i.M.L.gen.n.woodyi of Woody,in honor of the American biologist J.Woodland Hastings.Cells are rod-shaped,0.4–1.0ן1.4–2.0l m.Colonies on marine agar are pink-orange due to the accumulation of cytochromes.NaCl is required for growth.Growth factors are not required.Psychrophilic.Growth occurs between4and25ЊC;op-timum temperature,20–25ЊC;no growth at30ЊC.Other characteristics are as given in the genus descrip-tion and in Tables BXII.c.148and BXII.c.151.Isolated from squid ink,seawater and marine snow(col-lected from the Alboran Sea).The mol%GםC of the DNA is:39(by measurement of the relative binding of DNA-binding-fluorescent dyes bis-benzimide and chromomycin A3).Type strain:MS32,ATCC51908,DSM12036.GenBank accession number(16S rRNA):AF003549.Order XI.“Vibrionales”Vib.ri.o.naЈles.M.L.masc.n.Vibrio type genus of the order;-ales ending to denote order;M.L.fem.pl.n.Vibrionales the order of bacteria whose circumscription is based on thegenus Vibrio.Description is the same as for the family Vibrionaceae.Type genus:Vibrio Pacini1854,411.Family I.Vibrionaceae Ve´ron1965,5245ALJ.J.F ARMER III AND J.M ICHAEL J ANDAVib.ri.o.naЈce.ae.M.L.masc.n.Vibrio type genus of the family;-aceae ending to denote family;M.L.fem.pl.n.Vibrionaceae the family of bacteria whose circumscription is based on the genusVibrio.Gram-negative straight or curved rods.Motile by means of polar flagella.Additional lateralflagella may be produced when grown on solid media;these differ in wavelength and antigenicity from the polarflagellum and may number from a few to over100flagella/cell.Do not form endospores or microcysts.Chemoor-ganotrophs.Facultative anaerobes,having both a respiratory and a fermentative metabolism.Oxygen is a universal electron ac-ceptor.Do not denitrify.Most strains:are oxidase positive,reduce nitrate to nitrite,ferment d-glucose and utilize it as a sole or principal source of carbon and energy,grow in minimal media with d-glucose or other compounds as the sole source of carbon and energy and use NH4םas the sole nitrogen source.A few species require vitamins and amino acids.Ferment and utilize a wide variety of simple and complex carbohydrates and utilize a wide variety of other carbon sources.Most species require Naםor a seawater base for growth and require0.5–3%NaCl for op-timum growth.Several species are bioluminescent;other species include a few bioluminescent strains.Primarily aquatic.Found in fresh,brackish,and sea water,often in association with aquatic animals and plants.Several species are pathogenic for humans.FAMILY I.VIBRIONACEAE 492Other species are pathogenic forfish,eels,and other aquatic animals.The mol%GםC of the DNA is38–51%.The family is classified in the phylum Proteobacteria in the class Gammapro-teobacteria.Type genus:Vibrio Pacini1854,411.Historical overview A history of the family Vibrionaceae as it has appeared in Bergey’s Manual is given in Table BXII.c.152. Related families include Enterobacteriaceae,Aeromonadaceae,and Pasteurellaceae.The family Vibrionaceae has undergone intense study since thefirst edition of Bergey’s Manual of Systematic Bac-teriology(Krieg and Holt,1984)was published in1984.In their chapter on the family Vibrionaceae in that edition,Baumann and Schubert(1984)included the genera Vibrio,Photobacterium,Ae-romonas,and Plesiomonas.These are the same four genera in-cluded in the original classification of the family proposed by Ve´ron almost twenty years earlier(Ve´ron,1965).In this Manual Aeromonas and Plesiomonas are classified in other families(Table BXII.c.152).For practical identification schemes,it is still useful to consider Aeromonas and Plesiomonas together with other oxidase positive genera of fermentative bacteria such as Vibrio and Pho-tobacterium(Table BXII.c.153).A detailed history of changes in the classification of Vibrio and related genera that occurred as new methods were introduced has been given by Farmer(1992). These methods include examinations of the structure,function, and regulation of proteins;comparison of mol%GםC content; DNA–DNA hybridization;rRNA–DNA hybridization;5S rRNA cataloging and sequence comparisons;and16S rRNA gene se-quence comparisons(Fig.BXII.c.157).The family Vibrionaceae presently includes three genera:Genus1.Vibrio(the type genus)Genus II.PhotobacteriumGenus III.SalinivibrioThe type strain of the type and only species of the genus Allomonas,Allomonas enterica,is very closely related to Vibrioflu-vialis by DNA–DNA hybridization studies and phenotypic analysis (Kalina et al.,1984).Allomonas and Allomonas enterica are not described separately in this edition of the Manual;the reader is referred to the description of V.fluvialis.The two species of the genus Listonella,Listonella anguillarum(the type species)and Lis-tonella pelagia,are included in the genus Vibrio in this edition of the Manual as Vibrio anguillarum and Vibrio pelagius.*F URTHER DESCRIPTIVE INFORMATIONHabitats The ecological niches of members of the family Vibrionaceae have been described by Campbell(1957);Baumann and Baumann(1981a);Sakazaki and Balows(1981);and Simidu and Tsukamoto(1985)).In humans,some vibrios cause diarrhea, wound infections,and occasionally other extraintestinal infec-tions.In aquatic animals,vibrios cause wound and generalized infections.Many vibrios and related organisms are also widely distributed in aquatic environments.Many factors govern the distribution of these organisms,but the most important probably include:particular human,animal or plant hosts;inorganic nu-trients and carbon sources available;temperature;salinity;dis-solved oxygen;and depth below the surface for the species that are found in the ocean(Simidu and Tsukamoto,1985).A few species are adapted to particular hosts.For example,Vibrio chol-erae serogroup O1is adapted to humans and is the cause of cholera,a life-threatening diarrheal disease.Recent studies have shown that the ecology of this organism is more complex than originally thought.Photobacterium leiognathi is usually isolated fromfish in shallow tropical water,and P.phosphoreum is usually found in the luminous organs offish that live at depths of200–1200meters(Hastings and Nealson,1981).Isolation Most members of the Vibrionaceae grow well on ordinary complex media.Samples are spread onto solid medium or diluted in an enrichment broth.NaCl concentrations of0.5–0.85%satisfy the requirements of most species,although a few require greater concentrations of NaCl.Incubation temperatures are also important.A few species grow only at temperatures Ͻ25ЊC;others grow at25ЊC but not at35–37ЊC.General and selective media for Vibrionaceae are described in the chapter on the genus Vibrio.Identification Methods for the isolation and identification of Vibrio spp.from clinical specimens and non-clinical samples are discussed in detail in the chapter describing the genus Vibrio. Assignment of non-clinical isolates to a species can be problem-atic because over50species of Vibrio and Photobacterium must be considered and because comparative data for these organisms are sparse relative to data available for clinically important spe-cies.The US Centers for Disease Control and Prevention maintain computer programs and databases for the identification of iso-lates subjected to a battery of45–60phenotypic tests;for details contact the Vibrio Laboratory at the CDC.These alternatives to phenotypic methods are now being used routinely and have proven extremely useful in a research setting. It will be important to evaluate the sensitivity and specificity,and to understand the advantages and disadvantages of these meth-ods.In the United States,the reporting of cultures from human specimens is subject to specific government regulations(the Clin-ical Laboratory Improvement Amendments of1988),which has limited the application of these approaches in clinical and public health laboratories.A CKNOWLEDGMENTSWe dedicate this chapter to M.Ve´ron for giving us the name Vibrionaceae and for all his contributions to our understanding of the family,its or-ganisms,and their close and distant relatives.F URTHER R EADINGBaumann,P.and L.Baumann.1977.Biology of the marine enterobac-teria:genera Beneckea and Photobacterium.Ann.Rev.Microbiol.31:39–61.Baumann,P.and L.Baumann.1981.The marine Gram-negative eubac-teria.In Starr,Stolp,Tru¨per,Balows and Schlegel(Editors),The Pro-karyotes,a Handbook on Habitats,Isolation and Identification of Bacteria,1st Ed.,Springer-Verlag,New York.pp.1352–1394. Baumann,P.,L.Baumann,S.S.Bang and M.J.Woolkalis.1980.Reeval-uation of the taxonomy of Vibrio,Beneckea,and Photobacterium:aboli-tion of the genus Beneckea.Curr.Microbiol.4:127–132. Baumann,P.,L.Baumann and M.Mandel.1971.Taxonomy of marine bacteria:the genus Beneckea.J.Bacteriol.107:268–294. Baumann,P.,A.L.Furniss and J.V.Lee.1984.Genus I.Vibrio.In Krieg and Holt(Editors),Bergey’s Manual of Systematic Bacteriology,1st Ed.,Vol.1,The Williams&Wilkins Co.,Baltimore.pp.518–538. Baumann,P.and R.H.W.Schubert.1984.Family II.Vibrionaceae.In Krieg and Holt(Editors),Bergey’s Manual of Systematic Bacteriology,1st Ed.,Vol.1,The Williams&Wilkins Co.,Baltimore.pp.516–517. Brenner,D.J.,G.R.Fanning,F.W.Hickmann-Brenner,J.V.Lee,A.G.Stei-FAMILY VIBRIONACEAE493gerwalt,B.R.Davis and J.J.Farmer.1983a.DNA relatedness among Vibrionaceae,with emphasis on the Vibrio species associated with human infection.INSERM Colloq.114:175–184.Chakraborty,S.,G.B.Nair and S.Shinoda.1997.Pathogenic vibrios in the natural aquatic environment.Rev.Environ.Health.12:63–80. Farmer,J.J.1992.The family Vibrionaceae.In Balows,Tru¨per,Dworkin,Harder and Schleifer(Editors),The Prokaryotes.A Handbook on the Biology of Bacteria:Ecophysiology,Isolation,Identification,Ap-plications,2nd Ed.,Vol.3,Springer-Verlag,New York.pp.2938–2951. Farmer,J.J.,M.J.Arduino and F.W.Hickman-Brenner.1992.Aeromonas and Plesiomonas.In Balows,Tru¨per,Dworkin,Harder and Schleifer (Editors),The Prokaryotes.A Handbook on the Biology of Bacteria:FAMILY I.VIBRIONACEAE 494GENUS I.VIBRIO495FIGURE BXII.c.157.Relationship of most of the species of Vibrio and relatives based on16S rRNA gene sequences.* Only the type strain of each species was included.The distances in the tree were calculated using1101positions (the least-squares method,Jukes-Cantor model).(Courtesy T.Lilburn of the Ribosomal Database Project.)*Editorial Note:Photobacterium damselae subsp.damselae is a junior objective synonym of Vibrio damsela.Vibrio pelagius and Vibrio anguillarum are synonyms of Listonella pelagia and Listonella anguillarum,respectively.and volume(15–67%)and a conversion of rods into coccal forms called spherical ultramicrocells(Holmquist and Kjelleberg,1993; Kondo et al.,1994;Nelson et al.,1997).As the length of nutrient starvation increases,cytoplasmic inclusions and granules disap-pear,cell cultivability decreases,and the nuclear region becomes compressed(Hood et al.,1986).There are also noticeable dif-ferences in the integrity of the outer membrane and cell wall. Some changes may be linked to specific nutrient starvation(for example,nitrogen starvation produces longfilaments and phos-phorus starvation produces swollen large rods),whereas others occur regardless of the type of nutritional stress(Holmquist and Kjelleberg,1993).“Non-culturable”V.cholerae O1strains pro-duced in response to nutrient deprivation display a number of ultrastructural changes,which include an undulating outer mem-brane,a surface layer offinefibers,and a thicker peptidoglycan layer(Kondo et al.,1994).FAMILY I.VIBRIONACEAE 496Poly-b-hydroxybutyrate granules(PHB)can be found in a number of Vibrio species,including V.cholerae O1and O139and V.harveyi(Hood et al.,1986;Sun et al.,1994;Finkelstein et al., 1997).In V.cholerae,accumulation of PHB appears to be related to colonial opacity and growth on glycerol-containing media(Fin-kelstein et al.,1997).In V.harveyi,PHB accumulation is de-pendent on cell density and is controlled by the autoinducer,N-(3-hydroxybutanoyl)homoserine lactone(Sun et al.,1994). Other kinds of granules can be found in vibrios,including elec-tron dense lipoid particles and electron translucent inclusions of unknown composition(Sun et al.,1994;Finkelstein et al., 1997).Cell wall composition Vibrios contain the same three lipo-polysaccharide(LPS)elements found in other Gram-negative bacteria:lipid A,core polysaccharide,and an O polysaccharide side chain that determines serological specificity.The most ex-tensive work on biochemical characterization of Vibrio LPS has been done on V.cholerae.The lipid A portion consists of a b(1Ј-6)-linked glucosamine disaccharide backbone with two phos-phoryl groups(Janda,1998).Pyrophosphorylethanolamine is linked to one of these phosphoryl groups at the C-1position of the reducing sugar,and a phosphate group ester is bound to the nonreducing glucosamine residue(Manning et al.,1994).Three fatty acids are ester linked at hydroxyl positions to this disaccha-ride backbone:tetradecanoic acid(C14:0),hexadecanoic acid (C16:0),and3-hydroxydodecanoic acid(C12:03OH).A fourth,3-hydroxytetradecanoic acid(C14:03OH),is connected to the back-bone by an amide bond.The core oligosaccharide region of V.cholerae contains KDO (keto-3-deoxy-d-mannose-octulosonic acid),d-glucose,heptose (l-glycero-d-manno-heptose),d-fructose,and ethanolamine phosphate(Manning et al.,1994).KDO,a normal constituent of the core oligosaccharide of enteric LPS,was originally thought to be absent in Vibrio species.However,when conventional per-iodate-thiobarbituric acid tests were replaced by strong acid hy-drolysates,KDO was detected in Vibrio(Janda,1998).The KDO molecule of V.cholerae differs in several aspects from those of enteric bacteria such as Escherichia coli and the genus Salmonella: only a single KDO molecule has been detected in the core oli-gosaccharide of V.cholerae,and the KDO moiety is phosphory-lated at the C4position(Kondo et al.,1990;Manning et al., 1994).The C5position binds to a distal portion of the core region (heptose)similar to the KDO-C5binding of l-glycero-d-manno-heptose(Janda,1998).The other sugars form the remaining portion of the core oligosaccharide region and often contain additional sugar substitutions at various positions.The O-polysaccharide side chain of V.cholerae O1is a homo-polymer of d-perosamine(4,6-dideoxy-d-mannose)approxi-mately17–18units in length(Manning et al.,1994;Knirel et al., 1997).The amino groups of perosamine units are commonly acetylated with3-deoxy-l-glycero-tetronic acid.Another com-pound,quinovosamine,is thought to be a“capping sugar”on either the distal or the proximal end of the O antigen(Manning et al.,1994).An unusual sugar,4-amino-4,6-dideoxy-2-O-methyl-mannose is present only in the LPS of serogroup Ogawa and may have a role in serological specificity(Itoh et al.,1994).The LPS composition of V.cholerae O139—a second serotype capable of causing pandemic cholera—is remarkably similar to that of O1(Hisatsune et al.,1993;Isshiki et al.,1996).The lipid A moieties of O1and O139,including fatty acid substitutions, appear to be identical(Hisatsune et al.,1993).The core oligo-saccharide region contains two subtle differences:the presence of2-aminoethyl phosphate,which is the O-acetyl group,and the presence of a second fructose molecule(Knirel et al.,1997).The most profound differences between O-groups1and139occur in the O-polysaccharide side chain.Unlike serogroup O1,which has long O-polysaccharide side chains,V.cholerae O139has a short chain LPS similar to“SR strains”(Knirel et al.,1997).These truncated side chains migrate with the core oligosaccharide-lipid A fraction in LPS SDS-PAGE gels(Waldor et al.,1994).Classic “ladder-like”profiles of silver stained LPS side chains in SDS-PAGE gels are absent in O139strains(Hisatsune et al.,1993; Nandy et al.,1995).Perosamine,the main component of the O1 side chain,is also absent in O139strains(Hisatsune et al.,1993); instead,the unique sugar colitose(3,6-dideoxy-l-galactose)—which is not found in any other Vibrio species—is the main side chain subunit in O139strains(Hisatsune et al.,1993).The ab-breviated O-polysaccharide side chain of V.cholerae O139appears to be a hexasaccharide containing colitose residues and a cyclic phosphate group(Knirel et al.,1997).The LPS of other Vibrio species is similar in many aspects to that of O139.KDO-phosphate has been detected in V.parahaemolyticus by gas chromatography-mass spectrometry analysis(Janda,1998).The O-polysaccharide side chains of Vibrio species produce only a single fast-migrating band on silver-stained SDS-PAGE gels(Amaro et al.,1992;Iguchi et al.,1995).This result suggests that the side chains are short;a chain length ofՅ10monosaccharides has been proposed for V.parahaemolyticus(Iguchi et al.,1995).Some species however (e.g.,V.vulnificus)may exhibit ladder-like patterns by immu-noblotting with whole cell antisera;this result suggests that the LPS O-polysaccharide side chains are mbert et al.(1983) studied the cellular fatty acids of most of the Vibrionaceae and postulated that differences among the Vibrio species might prove useful for identification.Flagella Two types offlagella are synthesized by vibrios in different environments.In liquid culture,swimmer cells predom-inate due to production of a single sheathed polarflagellum in most species(Figs.BXII.c.158and BXII.c.159).The sheath is an extension of the outer membrane(Fig.BXII.c.160).The polar flagella are24–30nm in diameter with a central core14–16nm in thickness with a wavelength of1.4–1.8l m(Baumann et al., 1984b;Janda,1998).Some Vibrio species(e.g.,V.harveyi,V.fischeri, V.logei,and V.salmonicida)produce tufts(3–12)of polarflagella (Fig.BXII.c.161)with a wavelength of approximately3.6l m (Baumann et al.,1984b;Ishimaru et al.,1996).Polarflagella provide chemotactic motility in liquid media and derive their energy from the sodium membrane potential(McCarter,1995). In some marine vibrios(e.g.,V.anguillarum),the polarflagellum appears critical for disease production in estuarinefish(Milton et al.,1996;O’Toole et al.,1996).When vibrios come into contact with solid surfaces,a series of morphogenetic changes are ini-tiated that result in the conversion of swimmer cells into swarmer cells in some marine species such as V.parahaemolyticus,V.algi-nolyticus,V.diabolicus,and V.pectenicida(Rague´ne`s et al.,1997a; Lambert et al.,1998).During this process,cell septation ceases, the cells elongate from1to30l m,and numerous lateralflagella are formed(Fig.BXII.c.162)(McCarter and Silverman,1990). These lateralflagella,14–15nm in diameter with a wavelength of0.9l m,are distinct from polarflagella.They are unsheathed, have a different protein subunit composition,and are internally driven by the protonmotive force(Baumann et al.,1984b; McCarter,1995).Formation of lateralflagella permits swarmerGENUS I.VIBRIO497FIGURE BXII.c.158.Leifsonflagella stain of Vibrio cholerae.(Source:CDC archive,courtesy of EdEwing.)FIGURE BXII.c.159.Electron micrograph of Vibrio alginolyticus grown in liquid medium.Note the sheathed polarflagellum and absence of pe-ritrichousflagella.Shadowed preparation.ן13,000.(Reproduced with permission from C.Golten and W.A.Scheffers,Netherlands Journal of Sea Research9:351–364,1975,᭧Netherlands Institute for SeaResearch.)FIGURE BXII.c.160.Electron micrograph of a polarflagellum of Vibrio alginolyticus.Note that the sheath has partially disintegrated exposing the inner core.Negatively stained preparation.ן30,000.(Courtesy of R.D. Allen.)migration across solid surfaces and results in progressive spread-ing of the bacterial colony(McCarter and Silverman,1990),a phenomenon called swarming.Swarming in many vibrio species is dependent upon a number of factors including agar concen-tration,media composition,iron availability,temperature,and relative viscosity(Baumann et al.,1984b;McCarter and Silver-man,1990).The microscopic morphology of vibrio cells removed from different concentric zones of swarming has been studied in some Vibrio strains(Sar and Rosenberg,1989).Innermost zones consist of irregular cells including bent rods that pro-gressively evolve into short rods and then into large rods with bundles of detachedflagella(Fig.BXII.c.163),whereas cells inFAMILY I.VIBRIONACEAE498FIGURE BXII.c.161.Electron micrograph of Vibriofischeri.Note the tufts of sheathed polarflagella.Negatively stained preparation.ן23,000. (Reproduced with permission from:J.L.Reichelt and P.Baumann,Ar-chives of Mikrobiology94:283–330,1973,᭧Springer-Verlag,Berlin.)FIGURE BXII.c.162.Electron micrograph of Vibrio alginolyticus grown on solid medium.Note the thick,sheathedflagellum and numerous un-sheathed lateralflagella.Shadowed preparation.ן18,000.(Reproduced with permission from W.E.de Boer et al.,Netherlands Journal of Sea Research9:197–213,1975,᭧Netherlands Institute for Sea Research.)the outermost circles of swarming colonies consist of longfila-mentous forms.Fimbriae Fimbriae are produced by a number of pathogenic vibrios such as V.cholerae O1and non-O1,V.parahaemolyticus, and V.vulnificus(Hall et al.,1988;Honda et al.,1988;Gander and LaRocco,1989;Nakasone and Iwanaga,1990).Several dif-ferent morphologic types offimbriae have been described in V. cholerae O1.These include both wavy pili3nm in diameter and rigidfilaments5–6nm wide and180–800nm in length(Hall et al.,1988).The most important of these pili is composed of the protein TcpA;these pili are5–6nm wide and form bundles of parallel undulatingfilaments up to15l m long(Hall et al.,1988). TcpA formation is coregulated with cholera toxin expression and is a key determinant of in vivo colonization.The gene encoding TcpA appears to reside on a pathogenicity island.Capsules Capsules have been detected surrounding cells of strains of V.cholerae O139and V.vulnificus strains with a variety of staining techniques such as uranyl acetate,polycationic fer-ritin,and ruthenium red(Janda,1998).The V.vulnificus poly-saccharide capsule is60nm thick and has a low electron density (Amako et al.,1984;Hayat et al.,1993).The carbohydrate com-position of the capsule of V.vulnificus varies from strain to strain. Sugars detected in different isolates include␣-N-acetyl quino-vosamine,␣-N-acetyl galactosamine uronic acid,rhamnosamine, and fucosamine(Hayat et al.,1993).Colonial morphology Most vibrios grow well on a variety of media,including protein-based agars and marine and seawater media,if sufficient Naםis present(Baumann et al.,1984b; Farmer and Hickman-Brenner,1992).On most selective media, vibrios appear as smooth,buff-to-cream-colored colonies2–5mm in diameter,with an entire margin after overnight incubation (Baumann et al.,1984b;Janda,1998).Some species tend to pro-duce grayish colonies,particularly on blood agar.Considerable variation in colonial morphology has been reported for some species,and this is best demonstrated by observing colonies with a dissecting microscope at10–25magnification with oblique lighting.V.cholerae strains can have several different colonial mor-phologies(smooth,rough,and rugose forms)in response to different growth conditions.Rugose colonies are often chlorine-resistant.They are usually found in older cultures and are com-posed of an amorphous intercellular matrix of aggregated bac-teria and exopolysaccharide material(Morris et al.,1996).For-mation of rugose colonies can be enhanced by growth in en-richment broths such as alkaline peptone water(APW)or by picking the growth that has migrated up the sides of a culture tube.They can largely be avoided by picking a smooth colony and freezing it.In addition to these colony types,several path-GENUS I.VIBRIO499FIGURE rge bundle offlagella in a culture of Vibrio harveyi. These bundles are frequently observed in cultures grown on solid me-dium.Negatively stained preparation.ן13,000.(Courtesy of R.D.Allen.) ogenic vibrios,including V.cholerae and V.vulnificus,produce opaque and translucent varieties of smooth colonies on common media such as heart infusion and meat extract agars(Simpson et al.,1987;Finkelstein et al.,1992,1997).Cells from colonies of these different morphologies differ from each other in a num-ber of characteristics,including encapsulation,cell surface com-position,cellular metabolism,and ability to survive under adverse conditions.Pigmentation Several Vibrio species produce pigmented col-onies.V.nigripulchritudo produces an insoluble blue-black pig-ment that accumulates in a crystalline form within the colonies (Baumann et al.,1984b).Other Vibrio species also produce blue-black crystals under various growth conditions,but typically do not produce the characteristic blue-black colonies of V.nigripul-chritudo.Similar blue-black colonies are produced by a few strains of Kluyvera(Farmer et al.,1981a).Other pigmented species in-clude V.gazogenes(red)and V.fischeri and V.logei(yellow-orange).A few strains of V.cholerae produce a brown diffusible melanin-like pigment(Ivins and Holmes,1980).Life cycles The marine environment is the natural habitat of vibrios,and the life cycle of these organisms is probably quite complex.A model for the life of V.cholerae in Gulf Coast estuaries has been proposed(Hood et al.,1984).Depending on nutrient scarcity and the density/availability of particulate matter,V.chol-erae can exist in several states.An epibiotic form attached to plankton predominates during periods of relatively high nu-trient/particulate matter concentrations;this form changes to a microvibrio form(small rounded cells)during times of nutrient and particulate deprivation(Hood et al.,1984;Janda,1998).This latter form may be analogous to the“viable but nonculturable state”(Colwell,1984)that has been described for many Vibrio species including V.cholerae,V.parahaemolyticus,V.vulnificus,V. anguillarum,V.campbellii,V.harveyi,and V.fischeri during colder seasons of the year(Oliver,1995).The microvibrio and“non-culturable”stages may be dormant phases for vibrios in winter from which subsequent blooms are triggered in response to in-creasing temperatures in spring and summer.However,it is still unclear whether any dormant state actually exists and whether blooms are due to the growth of a small number of cultivable cells(present at all times)or the actual resuscitation of dormant cells(Ravel et al.,1995;Bogosian et al.,1998).Nutrition and growth conditions Vibrio species vary in their nutrition and growth requirements.The most important feature is that Naםis required for or stimulates growth.Minimum con-centrations of Naםrequired for optimal growth(Fig.BXII.c.164) range from5–15mM(0.029–0.087%)for V.cholerae and V.metsch-nikovii to600–700mM(3.5–4.1%)for Salinivibrio costicola(Bau-mann et al.,1984b).Most species grow well in solid or liquid media containing0.5–2%NaCl.Some species(Photobacterium ili-opiscarium)form bacterial aggregates in broth culture containing 2%NaCl(Onarheim et al.,1994).The“salt requirement”of a strain will often depend on the test conditions.The main variables are temperature,the growth medium used prior to testing,the suspending medium,and the testing medium.All Vibrio species except V.cholerae and V.mimicus have an absolute requirement for Naם(Fig.BXII.c.164).In some instances,this requirement may be partially offset by concentra-tions of Mg2םor Ca2םsimilar to those normally present in sea-water(Baumann et al.,1984b).However,most species exhibit a specific requirement for Naם(Pujalte and Garay,1986;Borrego et al.,1996).The range and optimum concentrations of NaCl supporting growth of some of the more recently described Vibrio species are listed in Table BXII.c.154.No single medium or NaCl concentration is optimal for the recovery or growth of all Vibrio species.Many vibrios will grow in mildly alkaline conditions.Al-though most species prefer a pH range of7–8(Rague´ne`s et al., 1997a),some species,including V.cholerae and V.metschnikovii, will even grow at a pH of10(Baumann et al.,1984b).Vibrios also vary in their temperature requirements for growth.Almost all Vibrio species grow well at18–22ЊC.Some will grow at0–4ЊC,whereas others can grow at temperatures up to 45ЊC.The temperature at which vibrios can grow is also de-pendent upon other factors including the composition of the medium and the NaCl concentration(Onarheim et al.,1994).Most Vibrio species do not require specific organic growth factors such as vitamins or amino acids,although amino acid supplementation may be required to revive some strains stored for prolonged periods(Baumann et al.,1984b).Complex nu-trients are required to induce growth of some species(Baumann et al.,1984b;Rague´ne`s et al.,1997a).Such required supplements include yeast extract(for V.anguillarum,Moritella marina,and V. logei)and a seawater base(for V.diabolicus).Vibrios use a variety of compounds as carbon and energy。
英国文学史及选读复习8-summary-of-the-Age-of-Elizabeth
Summary of the Age of Elizabeth ( I )This period is generally regarded as the greatest in the history of English literature. Historically, we note in this age the tremendous impetus received from the Renaissance, from the Reformation, and from the exploration of the New World. It was marked by a strong national spirit, by patriotism, by religious tolerance, by social content, by intellectual progress, and by unbounded enthusiasm.Such an age, of thought, feeling, and vigorous action, finds its best expression in the drama; and the wonderful development of the drama, culminating in Shakespeare, is the most significant characteristic of the Elizabethan period. Though the age produced some excellent prose works, it is essentially an age of poetry; and the poetry is remarkable for its variety, its freshness, its youthful and romantic feeling. Both the poetry and drama were permeated by Italian influence, which was dominant in English literature from Chaucer to the Restoration. The literature of this age is often called the literature of the Renaissance, though, the Renaissance itself began much earlier, and for a century and a half added very little to English literary possessions.In the study of the age we have noted:1.The non-dramatic poetsThe poets who did not write for the stage.a. The center of this group is Edmund Spenser whose Shepherd’s Calendar(1579) marked the appearance of the first national poet since Chaucer’s death in 1400. His most famous work is The Faery Queen .The Shepherd’s Calendar is about his love and his melancholy over the lost love. The themes are generally rural life, nature, love in the fields; and the speakers are shepherds and shepherdesses. It consists of twelve pastoral poems, or eclogues, one for each month of the year.The Faery Queen. The original plan of the poem included twenty four books, each of which was to recount the adventure and triumph of a knight who represented a moral virtue. Spenser completed only six books, celebrating holiness, temperance, chastity, friendship, justice, and courtesy. For The Faery Queen, Spenser invented a new verse form, which has been called since his day the Spenserian stanza. It is in nine lines, eight of five feet each and last of six feet, riming ababbcbcc.Characteristics of Spenser’s po etry:1. perfect melody;2.a rare sense of beauty;3. a splendid imagination;4. a lofty moral purity and seriousness;5.a delicate idealismA Gentle Knight was pricking on the plaine,Ycladd in mightei armes and silver shielde,Wherein old dints of deepe woundes did remaine.The cruell markes of many a bloody fielde;Yet armes till that time did he never wield:His angry steede did chide his foming bitt,As much disdayning to the curbe to yield:Full iolly knight he seemed, and faire did sitt,As one for knightly giusts and fierce encounters fitt.b. minor poets associated with Spenser1. Thomas Sackville 1536-1608 earl of Dorset and Lord High Treasurer of England. In imitation of Dante’s Inferno, he formed the design of a great poem called The Mirror for Magistrates. He wrote also,in connection with Thomas Norton, first English tragedy, Ferrex and Porrex = Gorboduc2. Michael Drayton 1563-1631 most voluminous, chief work is Polyolbion, an enormous poem of many thousand couplets, describing the towns, mountains, and rivers of Britain, with the interesting legends connected with each. Two other long works Baron’s Wars , Heroic Epistle of England and “Ballad of Agincourt”.3. George Chapman 1559-1634, wrote chiefly for the stage. His plays, which were for the most part merely poems in dialogue, fell far below the high dramatic standard of his time and are now almost unread. His most famous work is the metrical translation of the Iliad and of the Odyssey. He is also remembered as the finisher of Marlowe’s Hero and Leander, in which, apart from the drama, the Renaissance movement is seen at perhaps its highest point in English poetry.4. Philip Sidney 1554-1586, the ideal gentleman, more interesting as a man than as a writer. His life expresses, better than any single literary work, the two ideals of the age,--- personal honor and national greatness. As a writer, he is known by three principal works, all published after his death. Arcadia is a pastoral romance. Apologie for Poetrie = Defense of Poesie , appeared in answer to a pamphlet by Stephen Gosson called The School of Abuse, in which the poetry of the age and its unbridled pleasure were denounced with puritan thoroughness and conviction. Astrophel and Stella is a collection of songs and sonnets addressed to Lady Penelope Devereux, to whom Sidney had once been betrothed.2.The rise and development of the drama in EnglandFirst the need, then the story, then the play; that seems to be the natural development of the drama in its simplest form. The great deeds of a people are treasured in its literature and later generations represent in play or pantomime certain parts of the story which appeal most powerfully to the imagination. To act a part seems as natural to humanity as to tell a story; and originally the drama is but an old story retold to the eye, a story put into action by living performers, who for the moment “make believe” or imagine themselves to be the old heroes.In Europe, as in Greece, the drama had a distinctly religious origin. The first characters were drawn from the New Testament, and the object of the first plays was to make the church service more impressive, or to emphasize moral lessons by showing the reward of the good and the punishment of the evil doer. In the latter days of the Roman Empire the church found the stage possessed by frightful plays, which debased the morals of a people already fallen too low. So the corrupt drama was driven from the stage, and plays of every kind were forbidden. But mankind loves a spectacle, and soon the church itself provided a substitute for the forbidden plays in the famous Mysteries and Miracles.a. Miracle and Mystery playsIn France the name miracle was given to any play representing the lives of the saints, while the mystery represented scenes from the life of Christ. In England this distinction was almost unknown;the name miracle was used indiscriminately for all plays having their origin in the Bible or in the lives of the saints; and the name mystery, to distinguish a certain class of plays, was not used until long after the religious drama had passed away. By the year 1300 the miracles were out of ecclesiastical hands and adopted eagerly by the town guilds.b. Morality playsThe second period of drama is shown by the increasing prevalence of the morality plays. In these the characters were allegorical personages,--- life, death, repentance, goodness, love, greed, and other virtues and vices. The morality marks a distinct advance over the miracle in that it gave free scope to the imagination for new plots and incidents. Of the known authors of moralities, two of the best are John Skelton, who wrote Magnificence and David Lindsay. They satirize or denounceabuses of church and state, and introduce living personages thinly disguised as allegories; so that the stage first becomes a power in shaping events and correcting abuses.c. InterludesIt is impossible to draw any accurate line of distinction between the moralities and interludes. In general we may think of the latter as dramatic scenes, sometimes given at banquets and entertainments where a little fun was wanted. The interludes originated, undoubtedly, in a sense of humor and was raised to the distinct dramatic form known as comedy by Heywood 1497?-1580?The Play of the Weather, The Fou r P’sd. Artistic period of the dramaThe artistic is the final stage in the development of the English drama. It differs radically from the other in that its chief purpose is not to point a moral but to represent human life as it is. The first true play in English is the comedy, Ralph Royster Doyster by Nicholas Udall. The story is that of a conceited fop in love with a widow, who is already engaged to another man. Gammer Gurton’s Needle, a domestic comedy, representing the life of the peasant class.The first English tragedy, Gorboduc, was written by Thomas Sackville and Thomas Norton. It is the first play to be written in blank verse.e. Dramatic unitiesIn the classic play the so-called dramatic unities of time, place, and action were strictly observed.Time and place must remain the same, the play could represent a period of only a few hours, and whatever action was introduced must take place at the spot where the play began. The severe simplicity of the classical drama seemed only to hamper the exuberant English spirit. The English drama, on the other hand, strove to represent the whole sweep of life in a single play.f. Two schools of dramaThe university wits generally upheld the classical ideal and ridiculed the crudeness of the new English plays. Sackville, Norton, Sidney were of this class.Lyly, Greene, Peele, Marlowe, these popular playwrights were against these. They recognized the English love of action and disregarded the dramatic unities in their endeavor to present life as it is.John Lyly 1554?-1606, known as having developed the pernicious literary style called euphuism.His two prose works Euphues, the Anatomy of Wit; Euphues and His England. The style is affected and overelegant, abounds in odd conceits, and uses hopelessly involved sentences.Thomas Kyd. Spanish Tragedy, melodrama of passion, copied by Marlow and Shakespeare.Robert Greene 1558-1592, plays the chief part in the early development of romantic comedy. Friar Bacon and Friar BungayChristopher Marlowe 1564—1593. In addition to Hero and Leander, he is famous for four dramas, known as one-man type of tragedy, each revolving about one central personality who is consumed by the lust of power. Tamburlaine, is the story of Timur, the Tartar. Faustus is of a scholar who longs for infinite knowledge. The Jew of Malta, is a study of lust for wealth. Edward II , isa tragic study of a king’s weakness and misery.Marlow is the only dramatist of the time who is ever compared with Shakespeare. When we remember that he died at 29, probably before Shakespeare had produced a single great play, we must wonder what he might have done had he outlived his wretched youth and become a man. Here and there his work is remarkable for its splendid imagination, for the stateliness of its verse, and for its rare bits of poetic beauty; but in dramatic instinct, in wide knowledge of human life, in humor, in delineation of woman’s character, in the delicate fancy----in a word, in all that makes a dramaticgenius, Shakespeare stands alone. Marlow simply prepared the way for the master who was to follow.g. Variety of the early drama1. chronicle plays, founded on historical events and characters. Of Shakespeare’s 37 plays, ten are true chronicle plays of English kings.2. The domestic plays began with crude home scenes introduced into the miracles and developed ina score of different ways, from the coarse humor of Gammer Gurton’s Needle to the comedy of manners of Jonson and the later dramatists. Shakespeare’s The Taming of the Shrew , Merry Wives of Windsor belong to this class.3. The so-called court comedy was marked by elaborate dialogues, jests, retorts, and endless plays on words, rather than by action. It was made popular by Lyly’s success, and was imitated in Shakespeare’s “Lylian” comedies, such as Love’s Labour’s Lost , Two Gentlemen of Verona4. Romantic comedy and tragedy suggest the most artistic and finished types of the drama, brought to perfection in The Merchant of Venice , Romeo and Juliet , The Tempest .5. a. classical plays, favored by cultivated audiences. b. melodrama, favorite of the groundlings.c. tragedy of blood, such as Shakespeare’s Titus Andronicus , Hamlet Lear , Macbeth .3. Conclusion: Shakespeare is the only dramatist whose plays cover the whole range of the drama. He raised the drama from a blundering experiment to a perfection of form and expression which has never since been rivaled.。
免疫学之父琴纳生平简介
免疫学之父琴纳生平简介在了解爱德华琴纳之前,有必要先了解一下天花这种疾病。
天花是痘病的一种,感染力极强,且很难被彻底治愈。
在古代,死于天花的人数不胜数。
美国的第一位总统华盛顿小时候就得过天花,从此留下了满脸麻子。
法国的国王路易十五和中国清朝皇帝顺治也都是因天花而死。
由此可见,天花几乎是当时的一种不治之症。
成功研究了天花疫苗的首位医生,就是爱德华琴纳。
爱德华琴纳1749年5月17日出生于英国格洛斯特郡。
他的父亲很早就过世了,他和他的哥哥相依为命。
随着琴纳的年龄渐长,当时天花正在英国流行,几乎大局部英国人都会染上天花。
琴纳自己本身也感染过天花。
有了切肤之痛,琴纳从小便发誓要找到治疗天花的方法。
在他13岁的那年,经过他哥哥的努力,琴纳成为了英国外科医生卢德洛的学徒,他跟随卢德洛学医7年,成为了一名能干的外科医生助手。
学成后,琴纳就自己开设医院,替人诊疗。
1718年,有位名叫梅丽惠特尼蒙塔古的贵族夫人从土耳其旅行回来,称土耳其有种预防天花的方法,就是把轻度的天花患者的病毒植入正常人体内,这样被接种的那个人就获得了天花的免疫能力。
琴纳相信了这种说法,他通过医学实践和观察,牛痘的病症和天花十分相似,但牛痘不会致人死命,病症也轻许多,但得过牛痘的人,就不会再感染天花。
1796年5月17日,爱德华琴纳在一位八岁的孩子身上进行了实验,他现将牛痘的脓液接种到男孩身上。
2个月后,又将天花的脓液接种给男孩,结果发现那名男孩竟没有得天花的病症。
后来又经过几次试验,发现了牛痘果然有抵抗天花的预防能力。
爱德华琴纳将这一发现无私地奉献给世界人民,从此天花不再是人类的顽敌了,这是人类历史上前所未有的发现和成功,造福了无数人。
琴纳和牛痘只要一说起天花这个疾病的名称,就跟琴纳和牛痘分不开关系。
前者是发现天花疫苗的第一人,后者真是天花疫苗的主要病理成分。
当时整个欧洲大陆上,天花横行肆虐,因此而死的人更是数不胜数。
琴纳是一名英国的医生,他一生都致力于研究天花的预防和治疗工作。
三种常见原生动物对褐潮藻种抑食金球藻(Aureococcus anophagefferens)的摄食
三种常见原生动物对褐潮藻种抑食金球藻(Aureococcusanophagefferens)的摄食陈瑶;杨茜露;何学佳【摘要】微型浮游动物在抑食金球藻(Aureococcus anophagefferens)引发褐潮时表现的摄食压力可潜在控制褐潮的爆发和消亡.本研究就三种海洋常见原生动物——海洋尖尾藻(Oxyrrhis marina)、海洋尾丝虫(Uronema marinum)和扇形游仆虫(Euplotes vannus)——对单种饵料及混合饵料中抑食金球藻中国株的摄食进行了研究.单种抑食金球藻指数期细胞喂食的三种原生动物的生长率和摄食率呈现米氏方程变化趋势.比较三种原生动物摄食抑食金球藻的最大摄食率,发现其随动物粒径的增大而增大,但仅为摄食球等鞭金藻(Isochrysis galbana)的30%~59%.海洋尖尾藻和海洋尾丝虫的最大生长率(μmax)与饵料种类无关,扇形游仆虫摄食抑食金球藻时的μmax值小于摄食球等鞭金藻的个体.海洋尖尾藻、海洋尾丝虫和扇形游仆虫摄食抑食金球藻时的毛生长率(gross growth efficiency,GGE)分别为65.8%、35.2%和49.1%.三种原生动物摄食抑食金球藻指数期细胞和球等鞭金藻以不同比例混合的饵料时表现出对抑食金球藻的选择倾向;在含有抑食金球藻稳定期细胞的混合饵料喂食的情况下,三种原生动物避食抑食金球藻或不表现明显摄食倾向性.抑食金球藻释放胞外聚合物(extracellular polymeric substance,EPS)的测定结果显示,细胞从指数期生长至稳定期释放出的EPS的水平显著上升(P<0.05),可能与原生动物对不同生长期藻细胞具有不同选择偏好有关.【期刊名称】《热带海洋学报》【年(卷),期】2018(037)006【总页数】13页(P120-132)【关键词】褐潮;抑食金球藻;原生动物;摄食;EPS【作者】陈瑶;杨茜露;何学佳【作者单位】暨南大学赤潮与海洋生物学研究中心,水体富营养化与赤潮防治广东普通高校重点实验室,广东广州 510632;暨南大学赤潮与海洋生物学研究中心,水体富营养化与赤潮防治广东普通高校重点实验室,广东广州 510632;暨南大学赤潮与海洋生物学研究中心,水体富营养化与赤潮防治广东普通高校重点实验室,广东广州510632【正文语种】中文【中图分类】Q178.53;Q958.12+2.2抑食金球藻(Aureococcus anophagefferens)是引发褐潮的主要原因种之一, 其引发的褐潮在美国和南非等地持续了20年之久(Bricelj et al, 1997; Probyn et al, 2001; Deonarine et al, 2006)。
- 1、下载文档前请自行甄别文档内容的完整性,平台不提供额外的编辑、内容补充、找答案等附加服务。
- 2、"仅部分预览"的文档,不可在线预览部分如存在完整性等问题,可反馈申请退款(可完整预览的文档不适用该条件!)。
- 3、如文档侵犯您的权益,请联系客服反馈,我们会尽快为您处理(人工客服工作时间:9:00-18:30)。
Preparation and Photochemical Behavior of a Cationic Azobenzene Dye-Montmorillonite Intercalation Compound WAN Tao, XU Huihua, YUAN Yi, HE Wenqiong(College of Materials and Chemistry & Chemical Engineering, Chengdu University of Technology, Chengdu 610059, China)Abstract: Montmorillonite/cationic azobenzene dye(p -(δ-triethylammoniobutoxy)-p ′-methyl- azobenzene bromide) intercalation compounds were prepared by the conventional ion exchange method. As compared with that of pure cationic azo-dye, the thermal stability of the intercalated dye was greatly enhanced, and the absorption band corresponding to azobenzene group in intercalated dye shifted towards longer wave length by 38 nm. This could be ascribed to the strong conjugation of cationic azo-dye supramolecular order structure(J cluster) confined in a nanoscale space of montmorillonite interlayer gallery. UV/vis spectra data show that the intercalated azo dye in the montmorillonite interlayer space exhibited reversible trans-to-cis photoisomerization and daylight cis-to-trans back reaction. FTIR indicates the successful intercalation ofcationic azo-dye into the montmorillonite interlayer.Key words:Na-montmorillonite; azobenzene; intercalation; photoisomerizationDOI 10.1007/s11595-006-3466-71 IntroductionO r g a n i c /i n o r g a n i c n a n o c o m p o s i t e s b y intercalation technique using layered silicate have attracted much attention due to their specific properties such as photocatalysis, photoluminescence, photochromism and optical nonlinearity [1-7].Azobenzenes are well-known photochromic dyes capable of trans–cis isomerization. The photochromic reactions of these compounds in the interlayer space of montmorillonite have been extensively investigated [1-3], and the photochromic behavior has been found to be different from that observed in solutions or other solid matrixes. In order to facilitate the introduction of azobenzene into the interlayer space, the silicates were made hydrophobic by the intercalating alkylammonium surfactants [4]. It was found that the orientation of alkylammonium ions depends largely on their packing density and the length of the alkyl chains. Lagaly et al [8] postulated that the alkyl chains lie flat on the silicate surface in “monolayer, bilayer, pseudotrimolecular arrangement” (through kink formation) or radiate away from the surface “paraffin-type”, depending on the charge density and the chain length. A l t h o u g h t h e i n t e r c a l a t e d a z o b e n z e n e s photoisomerized effectively in the hydrophobic interlayer space of the organoammonium-silicates [5],it was difficult to evaluate and control the location and the orientation of the intercalated azo dyes. In order to overcome this limitation, amphiphilic cationic azobenzene derivatives have been used as the guest species [6].In this paper, the intercalation of a cationic azo dye, p -(δ-triethylammoniobutoxy)-p ′-methyl-azobenzene bromide (shown in Scheme 1) into montmorillonite was reported. The spectral properties as well as the X-ray diffraction results of the supramolecular systems revealed the information on the interlamellar organization and orientation of the cationic azo dye intercalated into the layered silicate. In the present system, the intercalated J-like aggregate azo dye in the interlayer silicate exhibited trans-to-cis photoisomerization and daylight cis-to-trans back reaction, as evidenced by the basal spacing as well as the visible absorption spectra of the intercalation compounds.2 Experimental 2.1 Materials The Na-montmorillonite was a reference clay sample provided by the Qinghe Chemical Plant of China. The cation-exchange capacity of Na montmorillonite was 70 mequiv/100 g of clay. The cationic azo dye, p -(δ-triethylammoniobutoxy)-p′-Scheme 1 Molecular structure of p -(δ-triethylammoniobutoxy)-p ′-methyl-azobenzene bromidemethyl- azobenzene bromide(AZ+) was used after the recrystallization from ethanol.2.2 Preparation of the GTL-montmorillonite intercalation compoundIntercalation of p-(δ-triethylammoniobutoxy)-p′-methyl-azobenzene bromide(AZ+) into montmorillonite was carried out by a conventional ion exchange reaction as followed: 2 g sample of Na-montmorillonite was dispersed in a mixture of 100 mL water and 60 mL ethanol by stirring at 70 ℃ for 1 h and sonication for 10 min. It was added dropwise by stirring the required amount of p-(δ-triethylammoniobutoxy)-p′-methyl- azobenzene bromide dissolved in 40 mL of ethanol, and the reaction mixture was stirred at 70 ℃ for 24 h. At the end of the reaction, the mixture was centrifuged. The yellowish solid precipitate was washed with water and dried at room temperature. The intercalation compounds obtained were dispersed in PVP solutions, and casted on glass substrates to obtain supported films. The films were used for the photochemical studies. 2.3 Photochemical reactionsThe photochemical reactions of the intercalated p-(δ-triethylammoniobutoxy)-p′-methyl-azobenzene bromide were carried out by UV irradiation with a 500 W super-high pressure Hg lamp. The reactions were monitored by the change in the absorbance of the trans-isomer of the azobenzene.2.4 CharacterizationThermogravimetric analysis(TGA) of the intercalation compound was conducted on a Dupont 2100 instrument. The temperature program was 10.0 K/min from 20 ℃ to 800 ℃ in N2 atmosphere. The mass loss with increasing temperature as well as its first derivative (DTG) that represented the change in decomposition rate were plotted. X-ray powder diffraction patterns were obtained on a Mac Science, MXP3 diffractometer using monochromatic Cu Kα radiation(λ=0.15418 nm). To determine the peak positions, the diffractograms were fitted with a split Pearson VII function (TOPAS P profile fitting program, Bruker AXS) and the basal-plane spacing (d001) was calculated by applying Bragg’s law. UV-visible absorption spectra were recorded on a Thermo Spectronic Genesys 10 series spectrophotometer with a quarts cuvette possessing an optical path length of1 cm. Infrared spectra were taken with a 510 Nicolet FTIR spectrometer.3 Results and Discussion3.1 Microstructural analysesFig.1 shows the X-ray powder diffraction patterns for pristine Na-montmorillonite and AZ+-montmorillonite intercalation compounds. As compared with that of pristine Na-montmorillonite, the basal spacing of the intercalation compounds increased from 1.23 nm to 1.87 nm, indicating successful intercalation of AZ+ into the interlayer of Na-montmorillonite by a cation exchange reaction. The interlayer distance(Δd) could be obtained by subtracting the thickness of an individual layer of montmorillonite (0.96 nm) from the observed basal spacings(d001), and the tilt angle(θ) of AZ+ in the interlayer of Na-montmorillonite could be calculated as follows:Δd=d001–0.96=(I C+I G)sinθ (1)where, I C is the hydrophobic chain length of AZ+ ;I G is the length of hydrophilic polar head of AZ+.The structure of AZ+, as simulated by Gaussian 98 software, is shown in Fig.2, and I C and I G of AZ+obtained from Fig.2, were 2.01 nm and 0.25 nm, respectively. As calculated from Eq(1), Δd of the intercalation compounds was 0.91 nm and the corresponding tilt angle of AZ+ was 26.4°, suggesting an interdigitated monolayer of AZ+ with the molecular long axis inclined to the silicate layer, as schematically shown in Fig.3(c).As Maged reported[9]that short alkyl chains, such as cationic dyes, could lie flat on the substrate surface as long as there was enough space. However, with increasing amounts of the organic molecules intercalated into the silicate interlayers, the organic chains forced the layers to enlarge their basal-plane spacing. At a certain length and number of chains, the molecules adopted an ordered state due to increasing chain interactions and packing density. To minimize their conformational entropy and maximize their packing density, the chains attached to platelets facing each other interdigitated. The average organic molecular axis was inclined to the montmorillonite surface normal by an angle, and thus the interdigitatedmonolayer was formed, as shown in Fig.3c.By embedding the AZ+-montmorillonite into a polyvinylpyrrolidone (PVP) solution, a thin film was obtained. The basal spacing was the same as that of the powdered sample, suggesting that the arrangement of the intercalated AZ+ did not change during the film preparation.The UV-visible absorption spectra of a 1.0×10⁻⁴ M chloroform solution of AZ+ and AZ+-montmorillonite are shown in Fig.4. The absorption band of the AZ+-montmorillonite intercalation compound due to the trans-azobenzene chromophore was observed at around 504 nm, which was significantly shifted from that of AZ+chloroform solution (466 nm). In the molecular assembly, the chromophore interacted to give aggregated states and the dye-dye interactions caused both bathochromic and hypsochromic spectral shifts depending on the microstructures[10].According to Kasha’s molecular exciton theory[11], the observed absorption band bathochromic shift of the AZ+-montmorillonite was ascribable to J-aggregates (head-to-tail aggregates) of the intercalated AZ+. This was consistent with the proposed orientation (Fig.3(c)) speculated from the X-ray diffraction result. In summary, from these observations on the variation of the basal spacings and the UV-visible absorption spectra, it is shown that the intercalated AZ+ cations from an interdigitated monolayer gave a J-aggregate in the interlayer space of montmorillonite.3.2 BehaviorsAfter UV irradiation for 30 min, the absorbance band of the AZ+-montmorillonite intercalation compound due to the trans isomer (at around 504 nm) decreased (Fig.5), indicating an isomerization reaction induced by UV irradiation. However, when the irradiated sample was exposed to daylight for 24 h, a reversed isomerization reaction took place. Cis-siomers that formed with UV irradiation changed back to trans-isomers. As shown in Fig.5, the adsorption band due to the trans-isomer recovered its original intensity (Fig.5(b)). A reversible spectral change was observed repeatedly. This spectral change could be ascribed to the trans-to-cis photoisomerization and the daylight cis-to-trans back reaction of the intercalated AZ+.I t i s w o r t h n o t i n g t h a t t h e a z o b e n z e n e chromophore photoisomerized effectively in the interlayer space of montmorillonite, despite the fact that the azobenzene chromophore aggregated in the interlayer space, and the photoisomerization of azobenzene chromophore might be restricted.The thermal stability of AZ+-montmorillonite intercalation compound was evaluated using the TGA technique in programmed heating process(10 ℃/min). The results are shown in Fig.6. From the differential curves of TGA, the temperatures at which there was a maximum mass loss rate(T max), as well as the decompose onset temperature(T onset), was consideredto be a parameter for the estimation of the thermalstability.The TG and DTG thermogram for AZ+(Fig.6(a)) exhibits a gradual mass loss starting from ambient temperature and one decomposition peak at 258.9 ℃, with a corresponding mass loss of 24.6% and a DTGA of 15.33%•min–1. On the other hand, the TG and DTG thermogram for AZ+-montmorillonite intercalation compound (Fig.6(b)) exhibits two peaks; the first peak, attributed to the decomposition of AZ+, increased to 300.8 ℃, with a corresponding mass loss of 5.2% and a DTGA of 3.87%•min–1; the second dehydroxylation peak at 664.8 ℃ corresponded to the decomposition of structural hydroxyl groups in the aluminosilicate.It is noteworthy that an enhanced thermal stability of AZ+ could be achieved by way of intercalating it into the montmorillonite. As shown in Fig.6, T onset of AZ+ intercalated in the montmorillonite, increased from 248.5 ℃ to 290.6 ℃, accompanied by T max increasing from 258.9 ℃ to 300.8 ℃, as compared with that of pure AZ+. This remarkable enhancement of thermal stability of intercalated AZ+ molecules was attributed to their restricted mobility and their spatial confinement as well as the montmorillonite acting as a superior insulator and mass transport barrier to the volatile products generated during decomposition.3.3F T I R s t u d y o f t h e i n t e r c a l a t i o n compoundsFig.7 shows the FTIR spectra of the samples in the frequency range of 4 000-400 cm–1. In the FTIR spectrum of Na-montmorillonite, both stretching and bending vibrations of Al-OH-Al were observed at 3 629 and 915 cm–1. This could be considered to be characteristic of a dioctahedral smectite[12]. The bands at 3 445 and 1 640 cm−1 were the OH stretching and bending frequencies of the hydration water. The stretching vibration of Si-O groups was accompanied by two absorption bands at 1 154 and 1 090 cm–1. The tetrahedral bending modes were at 525 cm−1 for Si-O-Al, at 470 cm−1 for Si-O-Mg, and at 428 cm−1 for Si-O-Si[13]. In the FTIR spectra of AZ+-montmorillonite, all the bands belonging to the original bentonite were reserved. Besides, the bands at 2 950 and 2 865 cm−1 were assigned as the C-H stretching of methyl and methylene groups in AZ+ dye. On the other hand, the band at 1 499 cm−1 was due to deformation bands of the methyl and methylene groups attached to the cation N+ of AZ+. Therefore, the bands at 2 950, 2 865 and 1 499 cm−1 indicated the successful intercalation of AZ+ into the bentonite interlayer.4 ConclusionsThe intercalation of a cationic azo dye into the interlayer space of montmorillonite has been achieved by the conventional ion exchange between sodium-montmorillonite and p-(δ-triethylammoniobutoxy)-p′-methyl- azobenzene bromide(AZ+), as indicated by FTIR spectra. As compared with that of pure AZ+, the thermal stability of the intercalated dye was greatly enhanced, as indicated by TGA and DTGA curves, and the absorption band corresponding to azobenzene group in intercalated AZ+ shifted towards longer wave length by 38 nm, as shown by UV/vis spectra. This could be ascribed to the strong conjugation of AZ+ supramolecular order structure (J cluster) confined in a nanoscale space of montmorillonite interlayer gallery. The intercalated J-like aggregate AZ+ in the interlayer space exhibited reversible trans-to-cis photoisomerization and daylight cis-to-trans back reaction.References[1] M Ogawa, A Ishikawa. Controlled Microstructures ofAmphiphilic Cationic Azobenzene - Montmorillonite Interaction Compounds[J]. J. Mater. Chem. ,1998,8:463-467 [2] T Ikeda, T Sasaki, K Ichimura. Photochemical Switching ofPolarization in Ferroelectric Liquid-Crystal Films[J]. Nature, 1993, 361:428-430[3] Y Lansac,M A Glasser, N A Clark, et al. PhotocontrolledNanophase Segregation in a Liquid-Crystal Solvent[J]. Nature, 1999, 398:54-57[4] M Ogawa, K Kuroda. Preparation of Inorganic-OrganicNanocomposites Through Intercalation of Organoammonium Ions into Layered Silicates[J]. Bull. Chem. Soc. Jpn., 1997, 70:2 593-2 618[5] M Ogawa, M Hama, K Kuroda. Photochromism ofAzobenzene in the Hydrophobic Interlayer Spaces of Dialkyldimethylammonium-fluor-tetrasilicic Mica Films[J].Clay Miner., 1999, 34: 213-220[6] M Ogawa. Preparation of a Cationic Azobenzene DerivativeM ontmori llonite Int erc al ati on Compound a nd t he Photochemical Behavior[J]. Chem. Mater., 1996, 8:1 347-1 349 [7]M Ogawa, K Kuroda. Photofunctions of IntercalationCompounds[J]. Chem Rev.,1995,95:399-438[8]G Lagaly, K Benecke. Intercalation and Exchange Reactions ofClay Minerals and Non-clay Layer Compounds[J]. Colloid Polym. Sci.,1991, 269:1 198-1 211[9] A O Maged, P Michael, S Peter. Structure and Propertiesof Alkylammonium Monolayers Self-Assembled on Montmorillonite Platelets[J]. J. Phys. Chem. B, 2004, 108: 2 580-2 588[10] M Shimomura,S Aiba, N Tajima, et al. Crystal EngineeringBased on Two-dimensional Molecular Assemblies. Relation Between Chemical Structure and Molecular Orientation in Cast Bilayer Films[J]. Langmuir, 1995, 11:969-976[11] M Kasha. Energy Transfer Mechanisms and the MolecularExciton Model for Molecular Aggregates[J]. Radiat. Res., 1963,20:55-71[12] G A Borchardt. Montmorillonite and Other Smectite Minerals”in Minerals in Soil Environments: Soil Science Society of America[M]. Madison, Wisconsin, 1977[13] M H W Vander, H Beutelspacher. Atlas of InfraredSpectroscopy of Clay Minerals and Their Admixtures[M].Elsevier, Amsterdam, 1976。