深圳华强:2010年第一季度报告全文 2010-04-29
2010年深圳市政府工作报告(最终版)

政府工作报告——2010年5月31日在深圳市第五届人民代表大会第一次会议上代市长王荣各位代表:现在,我代表市人民政府向大会作政府工作报告,请予审议,并请各位政协委员和其他列席人员提出意见。
一、过去五年工作回顾过去五年,全市人民在党中央国务院、省委省政府和市委的正确领导下,以邓小平理论和“三个代表”重要思想为指导,以科学发展观统领全局,解放思想,改革创新,团结一心,努力工作,推动经济、政治、文化、社会和生态文明建设取得全面进步,圆满完成了市四届人大一次会议确定的各项目标任务。
(一)过去五年,综合经济实力稳步增长五年来,我们采取各种积极有效的措施,努力克服国际金融危机等不利因素影响,推动综合经济实力跨上新台阶。
本市生产总值年均增长13.8%,2009年达到8201亿元,居内地大中城市第四位;人均生产总值达到13581美元,提前两年实现“十一五”规划目标。
工业增加值年均增长14.3%,达到3598亿元。
全社会固定资产投资年均增长9.4%,达到1709亿元。
社会消费品零售总额年均增长15.8%,达到2599亿元。
全口径财政收入年均增长18.5%,达到2765亿元,其中地方财政一般预算收入达到880.8亿元,比2004年增长173.9%。
5年累计实现中央级财政收入8153亿元,服务全国的能力显著增强。
在中国社科院发布的城市竞争力评估报告中,深圳综合竞争力连续四年列内地城市榜首。
(二)过去五年,发展方式转变初见成效自主创新实现新突破。
国家创新型城市建设全面启动,区域创新体系进一步完善,全社会研发投入占GDP比重达到3.6%。
源头创新能力显著增强,中科院深圳先进技术研究院、国家超级计算深圳中心、深圳华大基因研究院,以及数字音频编解码技术、电子信息产品协同互联、电子信息产品标准化国家工程实验室等一批重大科研机构和创新基地落户深圳,深圳清华大学研究院、深港产学研基地等机构创新能力进一步增强。
“深港创新圈”建设深入推进,深港科技合作不断加强。
2010年第一季度分析报告
斗门区质量技术监督局食品安全形势分析报告(二○一○年第一季度)2010年第一季度,在市质监局、区委和区政府的正确领导下,我局明确工作责任,紧紧围绕建立完善产品质量安全监管长效机制,改革创新监管方式,层层狠抓落实,行动有序,措施有力,工作有效,进一步巩固了食品安全专项整治工作成果,切实加强食品质量安全监管。
一、食品质量基本态势(一)全区产品监督检验合格率较2009年合格率继续提升。
整体状况呈现良好态势,无重大食品安全事故发生。
由于本季度要加强全市食品行业监督抽查,抽样全面覆盖全区食品加工行业。
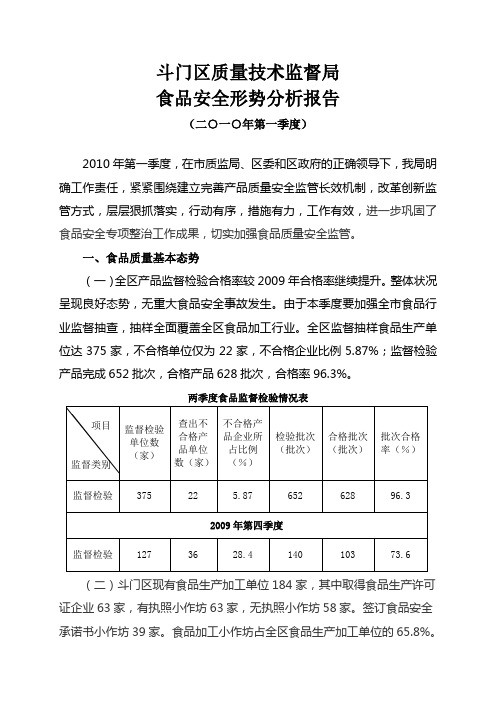
全区监督抽样食品生产单位达375家,不合格单位仅为22家,不合格企业比例5.87%;监督检验产品完成652批次,合格产品628批次,合格率96.3%。
两季度食品监督检验情况表(二)斗门区现有食品生产加工单位184家,其中取得食品生产许可证企业63家,有执照小作坊63家,无执照小作坊58家。
签订食品安全承诺书小作坊39家。
食品加工小作坊占全区食品生产加工单位的65.8%。
同期对比数(三)加大食品执法监管工作,巡查完成覆盖率达100%。
第一季度巡查组出动检查人员93人次,检查食品生产加工企业135家次,下达责令整改通知书16份,稽查立案查处食品案件9宗。
二、辖区内食品行业状况及监管情况分析(一)产品质量状况本季度我局联合质计所开展了市监督抽样、风险监测抽样、区专项监督抽样三项产品抽样检验工作,其中我局制定有饮用水、水产品两个专项监督抽样检查。
从监督检验合格率分析,第一季度斗门区有22家食品生产单位24批次产品被抽检不合格,批次合格率从上季度的73.6%上升到96.3%,从2009年第四季度开始加强食品生产单位产品的监督检验后,产品合格率就稳步上升,本季度合格率创新高,主要原因是包括风险监测在内的产品检验批次增多,企业产品通过开展抽检不合格即进行处罚的手段后,产品质量有所保证,抽检的合格率较高。
豆腐行业本季度检验结果令人满意,合格率从2009年第四季度的%到本季度的100%合格,抽样豆腐13批次,全部合格;2009年第四季度饮用水生产企业有家不合格,本季度抽样家,基本监督检验全部合格,只有家原料水风险监测不合格;斗门区水产品生产企业只有四家,抽检全部合格;本季度不合格率主要受河粉的监督检验不合格率高拖累,抽样15家河粉小作坊,有9家的产品大肠菌群项目不合格。
华测检测:2010年第一季度报告正文 2010-04-20

0
0
20,000 上市前承诺
2010 年 10 月 30
4
陈晓 刘畅 郝爽 孙爽民 杨棵 冯德举 时学香 陈祖燕 钱振华 梁丽霞 钟园园 张玉 何树悠 刘志军 梅璐 涂小强 郑晴涛 李国堂 刘领 李雪燕 张英华 张智娟 乐大娟 李雪钢
20,000 20,000 20,000 20,000 20,000 20,000 20,000 10,000 10,000 10,000 10,000 10,000 10,000 10,000 10,000 10,000 10,000 10,000 10,000 10,000 5,000 5,000 5,000 5,000
3
张鸿 王旭群 刘岩峰 朱凯 何朝标 苏红伟 鲁科 孙伟 陈亚梅 吴素珍 张昭凤 齐凡 廖礼祥 罗彬 程江华 李苑利 梁小会 白光林 熊财生 杨利娟 敖宇清 杨莹 蒋利辉 刘香萍 荆春波
20,000 20,000 20,000 20,000 20,000 20,000 20,000 20,000 20,000 20,000 20,000 20,000 20,000 20,000 20,000 20,000 20,000 20,000 20,000 20,000 20,000 20,000 20,000 20,000 20,000
0
0
10,000 上市前承诺
2010 年 10 月 30 日
0
0
10,000 上市前承诺
2010 年 10 月 30 日
0
0
10,000 上市前承诺
2010 年 10 月 30 日
0
0
10,000 上市前承诺
2010 年 10 月 30 日
0
0
深赛格B:2010年第一季度报告全文(英文版) 2010-04-29
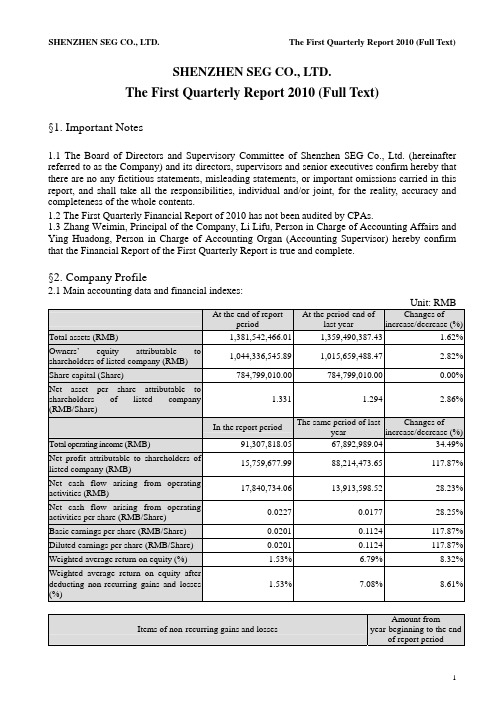
SHENZHEN SEG CO., LTD.The First Quarterly Report 2010 (Full Text)§1. Important Notes1.1 The Board of Directors and Supervisory Committee of Shenzhen SEG Co., Ltd. (hereinafter referred to as the Company) and its directors, supervisors and senior executives confirm hereby that there are no any fictitious statements, misleading statements, or important omissions carried in this report, and shall take all the responsibilities, individual and/or joint, for the reality, accuracy and completeness of the whole contents.1.2 The First Quarterly Financial Report of 2010 has not been audited by CPAs.1.3 Zhang Weimin, Principal of the Company, Li Lifu, Person in Charge of Accounting Affairs and Ying Huadong, Person in Charge of Accounting Organ (Accounting Supervisor) hereby confirm that the Financial Report of the First Quarterly Report is true and complete.§2. Company Profile2.1 Main accounting data and financial indexes:Unit: RMBAt the end of reportperiod At the period-end oflast yearChanges ofincrease/decrease (%)Total assets (RMB) 1,381,542,466.011,359,490,387.43 1.62% Owners’ equity attributable toshareholders of listed company (RMB)1,044,336,545.891,015,659,488.47 2.82% Share capital (Share) 784,799,010.00784,799,010.00 0.00% Net asset per share attributable toshareholders of listed company(RMB/Share)1.331 1.2942.86%In the report period The same period of lastyearChanges ofincrease/decrease (%)Total operating income (RMB) 91,307,818.0567,892,989.04 34.49% Net profit attributable to shareholders oflisted company (RMB)15,759,677.99-88,214,473.65 -117.87% Net cash flow arising from operatingactivities (RMB)17,840,734.0613,913,598.52 28.23% Net cash flow arising from operatingactivities per share (RMB/Share)0.02270.0177 28.25% Basic earnings per share (RMB/Share) 0.0201-0.1124 -117.87% Diluted earnings per share (RMB/Share) 0.0201-0.1124 -117.87% Weighted average return on equity (%) 1.53%-6.79% 8.32% Weighted average return on equity afterdeducting non-recurring gains and losses(%)1.53%-7.08% 8.61%Items of non-recurring gains and lossesAmount from year-beginning to the end of report periodOther non-operating income and expenditure except for the aforementioned items 97,850.12 Influenced amount of income tax -21,527.03Influenced amount of minority shareholders’ equity -31,864.37Total 44,458.72 Explanations of items of significant non-recurring gains and losses1. Other non-operating income and expenditure except for the aforementioned items:mainly the damages for breach of contract received by the Company;2. Influenced amount of income tax: the influenced amount of deductible income tax increased due to the profit increase because of the aforementioned item;;3. Influenced amount of minority shareholders’ equity: this item increased due to the increase of the aforementioned No.1 item of controlling subsidiary of the Company.2.2 Total number of shareholders at the end of the report period and shares held by the top ten shareholders without restricted conditionsUnit: Share Total number of shareholdersat the end of report period59,152Particulars about the shares held by the top ten tradable shareholders without restricted conditionsFull name of shareholder Amount of tradable shares withoutrestricted conditions held at the endof report periodType of sharesSHENZHEN SEG GROUP CO., LTD. 237,359,666 RMB ordinary shares GUANGZHOU FODAK ENTERPRISEGROUP CO., LTD.18,880,334 RMB ordinary shares Yang Zhihui 12,582,734 RMB ordinary shares Taifook Securities CompanyLimited-Account Client5,758,103 Domestically listed foreign shares Gong Qianhua 5,560,967 Domestically listed foreign shares Zeng Ying 4,280,048 Domestically listed foreign shares Zhu Wei 4,066,739 RMB ordinary shares Tang Lizhu 3,796,200 RMB ordinary shares SHANGHAI QILE ECONOMIC ANDTRADE CO., LTD.2,754,330 RMB ordinary shares Cao Xianhua 2,702,000RMB ordinary shares§3. Significant Events3.1 Particulars about material changes in items of main accounting statement and financial index, and explanations of reasons√Applicable □InapplicableI. Balance sheet itemItem Mar. 31, 2010 Dec. 31, 2009 Balance Proportion ofchanges % Inventory 1,919,437.27 5,886,392.39 -3,966,955.12 -67.39% Construction in progress 9,776,526.68 26,192,075.55 -16,415,548.87 -62.67% Staff salaries payable 1,172,559.95 4,261,476.99 -3,088,917.04 -72.48% 1. Inventory: decreased by RMB 3.97 million with a fall of 67.39% over the end of last year, which was mainly because the inventories of the Company decreased in the report period.2. Construction in progress: decreased by RMB 16.42 million with a fall of 62.67% over the end of last year. Its reason was that the construction in progress of the subsidiary Changsha SEG Development Co., Ltd. (hereinafter referred to as Changsha SEG) was completed and thentransferred into fixed assets in the report period.3. Staff salaries payable: decreased by RMB 3.09 million with a fall of 72.48% over the end of last year. Its reason was that the Company paid the staff for salaries in the report period.II. Income statement itemItem Amount in thisperiodAmount in thesame period oflast yearBalanceProportion ofchanges %Operating income 91,307,818.0567,892,989.0423,414,829.01 34.49% Operating cost 56,496,489.2231,746,485.6924,750,003.53 77.96% Operating tax and extras 3,724,614.303,012,887.52711,726.78 23.62% Sales expense 1,370,260.25906,378.64463,881.61 51.18% Losses from devaluation ofassets--1,500,000.001,500,000.00 -100.00% Investment gains -3,029,152.47-115,823,698.14112,794,545.67 -97.38% Operating profit 23,529,850.53-85,166,016.78108,695,867.31 -127.63% Non-operating income 139,079.301,620,912.10-1,481,832.80 -91.42% Non-operating expenditure 41,229.18100,985.93-59,756.75 -59.17% Total profits 23,627,700.65-83,646,090.61107,273,791.26 -128.25% Income tax expense 5,951,587.042,313,487.223,638,099.82 157.26% Net profit 17,676,113.61-85,959,577.83103,635,691.44 -120.56% Net profit attributable toowners of parent company15,759,677.99-88,214,473.65103,974,151.64 -117.87% Basic earnings per share 0.0201-0.11240.1325 -117.87% Diluted earnings per share 0.0201-0.11240.1325 -117.87% Other consolidated income 12,964,835.24-574,782.6813,539,617.92 -2355.61% Total consolidated income 30,640,948.85-86,534,360.52117,175,309.37 -135.41% Total consolidated incomeattributable to owners ofparent company28,677,057.42-88,896,727.63117,573,785.05 -132.26% 1. Operating income: increased by RMB 23.41 million with an increase of 34.49% over the same period of last year. The main reasons were i. In the report period, Changsha SEG and Changsha Hotel of Shenzhen Mellow Orange Business Hotel Management Co., Ltd. (hereinafter referred to as Mellow Orange Hotel) started operation which increased the operating income of the Company; ii. Income from Buy-it Store increased compared with the same period of last year.2. Operating cost: increased by RMB 24.75 million with an increase of 77.96% over the same period of last year. The main reason was the increase of operating income caused the increase of operating cost accordingly.3. Operating tax and extras: increased by RMB 710,000 with an increase of 23.62% over the same period of last year. The main reason was the increase of operating income caused the increase ofoperating tax and extras accordingly.4. Sales expense: increased by RMB 460,000 with an increase of 51.18% over the same period of last year. The main reason was the increase of operating income caused the increase of sales expense accordingly.5. Losses from devaluation of assets: no losses from devaluation of assets occurred in the report period, whereas that was RMB -1.5 million in the same period of last year. The main reasons was part of account receivable which had been withdrawn losses of bad debts in the same period of last year was taken back through lawsuit.6. Investment gains: increased by RMB 112.79 million over the same period of last year. The main reason was the losses of Shenzhen SEG Samsung Co., Ltd. (hereinafter referred to as SEG Samsung) in which the Company holds 22.45% of its equity decreased in the report period over the same period of last year.7. Operating profit: increased largely over the same period of last year. The main reasons were the losses of SEG Samsung in which the Company holds 22.45% of its equity decreased in the report period over the same period of last year causing a large decrease in investment losses.8. Non-operating income: decreased by RMB 1.48 million with a decrease of 91.42% over the same period of last year. The main reasons were the Company switched back the account payable which it did not need to pay in the same period of last year, but no such switch-back occurred in the report period.9. Total profits: increased largely over the same period of last year. The main reason was the same as that of Item 7.10. Income tax expense: increased by RMB 3.64 million with an increase of 157.26% over the same period of last year. The main reason was the profit payable of this report year went up and income tax rate of this report year in Shenzhen also grew.11. Net profit: increased largely over the same period of last year. The main reason was the same as that of Item 7.12. Net profit attributable to owners of parent company: increased largely over the same period of last year. The main reason was the same as that of Item 7.13. Basic earnings per share: increased largely over the same period of last year. The main reasons were the same with Item 7.14. Diluted earnings per share: increased largely over the same period of last year. The main reason was the same as that of Item 7.15. Other consolidated income: increased by RMB 13.54 million largely over the same period of last year. The main reason was in the report period, SEG Samsung in which the Company holds 22.45% of its equity received the financial support funds amounting to RMB 56 million from its shareholder Samsung Corning Investment Co., Ltd., thus RMB 12.57 million was added into other consolidated income of the Company.16. Total consolidated income: increased largely over the same period of last year. The main reasons were the same as that of Items 7 and 15.17. Total consolidated income attributable to owners of parent company: increased largely over the same period of last year. The main reason was the same as that of Items 7 and 15.III. Cash flow statement itemItem Amount in thisperiodAmount in thesame period oflast yearBalanceProportion ofchanges %Other cash receivedrelating to operating activities64,583,939.9735,621,486.0928,962,453.88 81.31% Cash paid to/for staff andworkers11,883,672.359,605,770.002,277,902.35 23.71%Other cash paid relating to53,590,151.5031,135,749.7322,454,401.77 72.12% operating activitiesCash received from0.002,198,720.24-2,198,720.24 -100.00% recovering investmentNet cash received from15,444.00141,500.00-126,056.00 -89.09% disposal of fixed, intangible andother long-term assetsNet cash received from disposal0.0034,229,363.41-34,229,363.41 -100.00% of subsidiaries and other unitsCash paid for purchasing fixed,4,591,584.05701,547.003,890,037.05 554.49% intangible and other long-termassetsCash paid for investment 0.0053,030,000.00-53,030,000.00 -100.00% 1. Other cash received relating to operating activities: increased by RMB 28.96 million with an increase of 81.31% over the same period of last year. The main reasons were i. items of newly-opened Changsha SEG and Mellow Orange Hotel in the report period and newly-increased Buy-it Store in last May increased; ii. The general cashing business was developed in the electronic market, so the goods payment received on behalf of merchants increased.2. Cash paid to/for staff and workers: increased by RMB 2.28 million with an increase of 23.71% over the same period of last year. The main reasons were in the report period, Changsha SEG and Mellow Orange Hotel started operations, and the staff in Buy-it Store added increasing the salaries payable to the staff of the three companies.3. Other cash paid relating to operating activities: increased by RMB 22.45 million with an increase of 72.12% over the same period of last year. The main reasons were i. items of Changsha SEG and Mellow Orange Hotel newly-opened in the report period and Buy-it Store newly-increased last year increased; ii. The general cashing business was developed in the electronic market, the goods payment returning to merchants increased.4. Cash received from recovering investment: decreased by RMB 2.2million over the same period of last year. The main reason was in the same period of last year, the Company reduced the shares of Shenzhen Zero-Seven Co., Ltd. held by the Company amounting to 530,000, but no such sales occurred in the report period.5. Net cash received from disposal of fixed, intangible and other long-term assets: decreased by RMB 130,000 with a decrease of 89.09% over the same period of last year. The main reasons was the amount of fixed assets disposal in the same period of last year was bigger.6. Net cash received from disposal of subsidiaries and other units: decreased by RMB 34.23 million over the same period of last year. The main reasons was in the same period of last year, the Company received the equity account on selling former subsidiaries Shenzhen SEG Communications Co., Ltd, but no such sales of subsidiary occurred in the report period.7. Cash paid for purchasing fixed, intangible and other long-term assets: increased by RMB 3.89 million with an increase of 554.49% over the same period of last year. The main reasons were: the newly-opened Changsha SEG and Mellow Orange Hotel purchased fixed assets in the report period, thus the item increased.8. Cash paid for investment: decreased by RMB 55.03 million over the same period of last year. The main reason was in the same period of last year, the Company purchased 46 percent of the equity of Changsha SEG, but no such expenditure of equity acquisition occurred in the report period.3.2 Analysis and explanation of significant events and their influence and solutions□Applicable √Inapplicable3.3 Implementations of commitments by the Company, shareholders and actual controller√Applicable □InapplicableItem of CommitmentsPromiseeContent of commitmentsImplementationCommitments on Share Merger ReformInapplicable ----Commitments on share restricted tradeInapplicable ----Commitments made in Acquisition Report or Reports on Change in EquityInapplicable ----Commitments made in MaterialAssets ReorganizationInapplicable----Commitments made in issuanceShenzhen SEG Group Co., Ltd. Article 5 of the Equity Transfer Agreement which the Company had signed with SEG Group at the time of the Company’s listing stipulated: SEG Group permits the Company, as well as its subsidiaries of theCompany and affiliated companies to use the 8 registered trademarks that SEG Group has presently registered at the StateTrademark Office; italso permits theCompany to take the aforesaid trademarks and symbols that are similar to these marks as the symbol of the Company, as well as to use the aforesaid symbols or symbols that are similar to these symbols during the operation process; the Company doesn’t have to pay SEG Group any fee for the use of the aforesaidtrademarks or symbols.In the report period, this commitmentwas still executed according to thecommitment.Other commitments (includingadditional commitments)Shenzhen SEG Group Co., Ltd. According to the problem of “Yourcompany’s existing same industry competition in theelectronic market business with SEGIn the report period, controllingshareholder abided by the above commitment.Group” pointed outby Shenzhen Securities Regulatory Bureau in 2007 at the spot investigation of the Company, the Company received written Commitment Letter from SEG Group on Sep.14, 2007 and the content was as follows: our Group has similar business in Shenzhen electronic market with Shenzhen SEG Co., Ltd. (Shenzhen SEG), and the business was resulted by history and it has objective market developmentbackground. The Group made commitment: For the future, we do not operate on the market which is similar to Shenzhen SEG singly in the same city. The aforesaid matters have been disclosed in Securities Times ,China Securities Journal and Hong Kong Wen Wei Po and Juchao Website dated Sep. 18, 2007. In the report period, the holding company observed the above commitment.3.4 Estimation of accumulative net profit from the beginning of the year to the end of next report period to be a loss probably or the warning of its material change compared with the same period of last year and explanation of its reason √Applicable □InapplicableFore-notice of performances Carry-back of lossesYear-beginning to the end of next report period The same period oflast yearChange of increase/decrease (%)Estimated amount ofaccumulative net profit(RMB’0000)Approximately 1,600.00to2,700.00-14,608.35 -- -- Basic earnings per share(RMB/Share)Approximately 0.0204 to -0.1861 -- --0.0344Explanations onfore-notice ofperformances(1) SEG Samsung in which the Company holds its equity is predicted to suffer aloss accumulatively from RMB 30 million to RMB 50 million from year-beginning toend of next report period;(2) The performance prediction has not been pre-audited by CPAs.3.5 Other significant events which need explanations3.5.1 Particulars about securities investment □Applicable √Inapplicable3.5.2 Registration form of receiving research, communication and interview in the report periodDate Place Way ObjectsDiscussed main contents andsupplied materials Jan. 6, 2010 Office of the Company Telephone communication Investors Basic information of theCompany Feb. 12, 2010 Office of the Company Telephone communication Holder of B share Basic information of theCompany Mar. 26, 2010 Office of the Company Telephone communication Holder of B share Basic information of theCompany Apr. 7, 2010Office of the CompanyEnquire in written formSecurities DailyGot to know relevant public information of the Company3.5.3 Explanations of other significant events √Applicable □InapplicableThe net profit attributable to owners of parent company disclosed in the 1st quarterly report 2009 was RMB 2.85 million, but that of the same period of last year disclosed in the report was RMB -88.21 million, with the change amount of RMB -91.06 million. The reason for such change was the net profit attributable to owners of parent company of SEG Samsung in which the Company holds 22.45% of its equity disclosed in the 1st quarterly report 2009 was RMB-122 million, whereas that of the same period of last year disclosed in 1st quarterly report 2010 was RMB -504 million. The Company calculated the investment gains from SEG Samsung based on equity method, which caused the investment losses of the same period of last year disclosed in this report of the Company increased by RMB 91.06 million over that disclosed in the 1st quarterly report of 2009.3.6 Particulars about derivatives investment □Applicable √Inapplicable3.6.1 Particulars about derivatives investment held at the end of report period □Applicable √Inapplicable§4. Appendix4.1 Balance sheetPrepared by Shenzhen SEG Co., Ltd. March 31, 2010 Unit: RMBBalance at period-end Balance at year-beginning Items Consolidation Parent Company Consolidation Parent Company Current assets:Monetary funds 498,955,096.86372,852,381.52485,135,270.94 375,350,393.53 SettlementprovisionslentCapitalTransactionassetfinancereceivableNotesAccounts receivable 17,234,225.88400,000.0018,130,631.40 1,134,357.47 Accounts paid in advance 20,037,842.341,081,095.0018,404,268.08 8,035,295.00 receivableInsurancereceivablesReinsuranceContract reserve ofreinsurance receivableInterest receivable 2,460,821.922,460,821.922,460,821.92 2,460,821.92Dividend receivableOther receivables 12,042,162.4945,095,461.3911,971,998.74 45,306,466.00 Purchase restituted financeassetInventories 1,919,437.275,886,392.39 Non-current asset duewithin one yearassetsOthercurrentTotal current assets 552,649,586.76421,889,759.83541,989,383.47 432,287,333.92 Non-current assets:Granted loans and advancesFinance asset available for4,229,970.093,548,500.003,843,571.87 3,304,100.00 salesHeld-to-maturityinvestmentLong-term accountreceivableLong-term equity129,274,947.39310,372,446.43119,732,099.86 300,829,598.90 investmentInvestment property 438,740,452.42345,143,558.87442,502,999.44 347,797,315.91 Fixed assets 210,589,972.7523,031,843.38189,516,718.30 23,314,450.93 Construction in progress 9,776,526.6826,192,075.55materialEngineeringDisposal of fixed assetassetbiologicalProductiveOil and gas assetIntangible assets 4,681,177.38610,581.394,756,432.31 651,865.38 Expense on Research andDevelopmentGoodwill 10,328,927.8210,328,927.82Long-term expenses to be 13,684,505.73961,414.0213,041,779.82 1,165,451.06apportionedDeferred income tax asset 7,586,398.995,994,015.937,586,398.99 5,994,015.93 assetnon-currentOtherTotal non-current asset 828,892,879.25689,662,360.02817,501,003.96 683,056,798.11 Total assets 1,381,542,466.011,111,552,119.851,359,490,387.43 1,115,344,132.03 Current liabilities:Short-termloansLoan from central bankAbsorbing deposit andinter-bank depositborrowedCapitalTransaction financialliabilitiespayableNotesAccounts payable 7,716,840.382,149,017.128,225,509.02 2,178,169.12Accounts received in90,214,246.1242,701,579.41105,563,890.39 65,801,272.52 advanceSelling financial asset ofrepurchaseCommission charge andcommission payableWage payable 1,172,559.9524,450.874,261,476.99 2,065,724.98 Taxes payable 26,095,556.9526,470,386.0424,421,758.66 24,773,634.49 payableInterestDividend payable 921,420.73153,403.29921,420.73 153,403.29 Other accounts payable 95,328,850.9637,415,008.7786,454,289.91 41,932,495.62 payablesReinsuranceInsurance contract reserveagencySecurity trading ofSecurity sales of agencyNon-current liabilities duewithin 1 yearliabilitiescurrentOtherTotal current liabilities 221,449,475.09108,913,845.50229,848,345.70 136,904,700.02 Non-current liabilities:loansLong-termpayableBondspayableLong-termaccountSpecial accounts payableliabilitiesProjectedDeferred income tax liabilities 22,970,034.63547,125.7123,160,034.29 547,125.71 non-currentliabilitiesOtherTotal non-current liabilities 22,970,034.63547,125.7123,160,034.29 547,125.71 Total liabilities 244,419,509.72109,460,971.21253,008,379.99 137,451,825.73 Owner’s equity (or shareholders’equity):Paid-in capital (or sharecapital)784,799,010.00784,799,010.00784,799,010.00 784,799,010.00 Capital public reserve 409,833,425.36407,164,608.41396,922,482.95 394,348,208.41 Less: Treasury stocksReasonable reserveSurplus public reserve 102,912,835.67102,912,835.67102,912,835.67 102,912,835.67 Provision of general riskRetained profit -252,672,245.53-292,785,305.44-268,431,923.52 -304,167,747.78 Balance difference offoreign currency translation-536,479.61-542,916.63Total owner’s equity attributableto parent company1,044,336,545.891,002,091,148.641,015,659,488.47 977,892,306.30 Minority shareholders’ interests 92,786,410.4090,822,518.97Total owner’s equity 1,137,122,956.291,002,091,148.641,106,482,007.44 977,892,306.30 Total liabilities and owner’sequity1,381,542,466.011,111,552,119.851,359,490,387.43 1,115,344,132.03 4.2 Profit statementPrepared by Shenzhen SEG Co., Ltd. Jan.-Mar. 2010 Unit: RMBAmount in this period Amount in last period ItemsConsolidation Parent Company Consolidation Parent Company I. Total operating income 91,307,818.0528,545,784.8967,892,989.04 28,312,781.50 Including: Operating income 91,307,818.0528,545,784.8967,892,989.04 28,312,781.50 InterestincomeInsurancegainedCommission charge andcommission incomeII. Total operating cost 64,748,815.0510,069,765.9037,235,307.68 6,271,611.87 Including: Operating cost 56,496,489.228,821,226.1931,746,485.69 6,224,508.93 InterestexpenseCommission charge andcommission expenseCash surrender valueNet amount of expense ofcompensationNet amount of withdrawalof insurance contract reserveBonus expense of guaranteeslipReinsuranceexpenseOperating tax and extras 3,724,614.301,652,232.843,012,887.52 1,426,154.86 Sales expenses 1,370,260.25906,378.64Administration expenses 6,914,893.783,749,113.976,753,654.36 3,527,096.41 Financial expenses -3,757,442.50-4,152,807.10-3,684,098.53 -3,406,148.33Losses of devaluation of asset -1,500,000.00-1,500,000.00Add: Changing income offair value (Loss is listed with“-”)Investment income (Loss is-3,029,152.47-3,029,152.47-115,823,698.14 -115,823,699.14 listed with “-”)Including: Investmentincome on affiliated companyand joint ventureExchange income (Loss islisted with “-”)III. Operating profit (Loss is23,529,850.5315,446,866.52-85,166,016.78 -93,782,529.51 listed with “-”)Add: Non-operating income 139,079.30300.001,620,912.10 1,486,477.57Less: Non-operating41,229.18100,985.93expenseIncluding: Disposal loss ofnon-current assetIV. Total Profit (Loss is listed23,627,700.6515,447,166.52-83,646,090.61 -92,296,051.94 with “-”)Less: Income tax 5,951,587.044,064,724.182,313,487.22 450,000.00V. Net profit (Net loss is listed17,676,113.6111,382,442.34-85,959,577.83 -92,746,051.94 with “-”)Net profit attributable to15,759,677.9911,382,442.34-88,214,473.65 -92,746,051.94 owner’s equity of parentcompanyMinority shareholders’ gains1,916,435.622,254,895.82and lossesVI. Earnings per sharei. Basic earnings per share 0.02010.0145-0.1124 -0.1182 ii. Diluted earnings per share 0.02010.0145-0.1124 -0.1182 VII. Other consolidated income 12,964,835.2412,816,400.00-574,782.68 -682,253.97 VIII. Total consolidated income 30,640,948.8524,198,842.34-86,534,360.51 -93,428,305.91 Total consolidated income28,677,057.4224,198,842.34-88,896,727.62 -93,428,305.91 attributable to owners of parentcompanyTotal consolidated income1,963,891.432,362,367.11attributable to minorityshareholders4.3 Cash flow statementPrepared by Shenzhen SEG Co., Ltd. Jan.-Mar. 2010 Unit: RMBAmount in this period Amount in last period ItemsConsolidation Parent Company Consolidation Parent Company I. Cash flows arising fromoperating activities:Cash received from selling76,838,162.928,489,484.2877,509,335.13 16,793,838.47 commodities and providinglabor servicesNet increase of customerdeposit and inter-bank depositNet increase of loan fromcentral bankNet increase of capitalborrowed from other financialinstitutionCash received fromoriginal insurance contract feeNet cash received fromreinsurance businessNet increase of insuredsavings and investmentNet increase of disposal oftransaction financial assetCash received from interest,commission charge andcommissionNet increase of capitalborrowedNet increase of returnedbusiness capitalWrite-back of tax receivedOther cash receivedrelating to operating activities64,583,939.9735,796,951.0335,621,486.09 34,108,393.77 Subtotal of cash inflowarising from operating activities141,422,102.8944,286,435.31113,130,821.22 50,902,232.24 Cash paid for purchasingcommodities and receivinglabor service34,506,524.285,428,566.4833,515,780.98 4,689,090.60Net increase of customerloans and advancesNet increase of deposits incentral bank and inter-bankCash paid for originalinsurance contractcompensationCash paid for interest,commission charge andcommissionCash paid for bonus ofguarantee slipCash paid to/for staff andworkers11,883,672.355,234,585.349,605,770.00 4,602,269.51 Taxes paid 23,601,020.7018,545,462.2824,959,921.99 18,464,019.40 Other cash paid relating tooperating activities53,590,151.5017,876,799.3431,135,749.73 14,893,005.25Subtotal of cash outflowarising from operating activities123,581,368.8347,085,413.4499,217,222.70 42,648,384.76Net cash flows arisingfrom operating activities17,840,734.06-2,798,978.1313,913,598.52 8,253,847.48II. Cash flows arising frominvesting activities:Cash received from recovering investment 2,198,720.242,198,720.24Cash received frominvestment income5,270,590.49 Net cash received from 15,444.00141,500.00。
2010年一季度财政收支情况分析
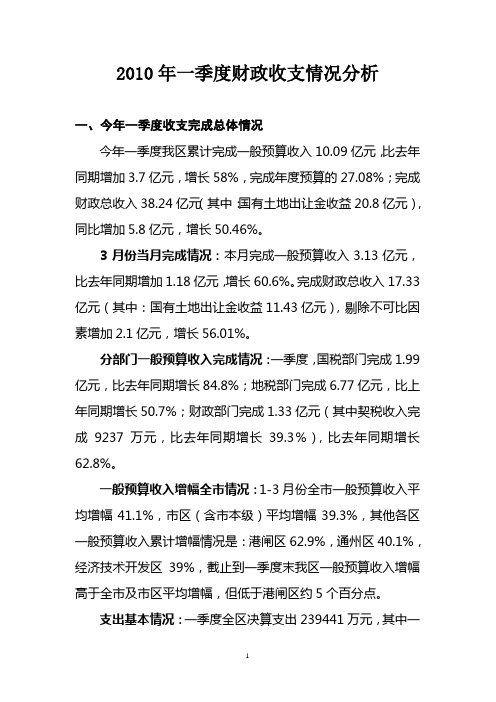
2010年一季度财政收支情况分析一、今年一季度收支完成总体情况今年一季度我区累计完成一般预算收入10.09亿元,比去年同期增加3.7亿元,增长58%,完成年度预算的27.08%;完成财政总收入38.24亿元(其中:国有土地出让金收益20.8亿元),同比增加5.8亿元,增长50.46%。
3月份当月完成情况:本月完成一般预算收入3.13亿元,比去年同期增加1.18亿元,增长60.6%。
完成财政总收入17.33亿元(其中:国有土地出让金收益11.43亿元),剔除不可比因素增加2.1亿元,增长56.01%。
分部门一般预算收入完成情况:一季度,国税部门完成1.99亿元,比去年同期增长84.8%;地税部门完成6.77亿元,比上年同期增长50.7%;财政部门完成1.33亿元(其中契税收入完成9237 万元,比去年同期增长39.3%),比去年同期增长62.8%。
一般预算收入增幅全市情况:1-3月份全市一般预算收入平均增幅41.1%,市区(含市本级)平均增幅39.3%,其他各区一般预算收入累计增幅情况是:港闸区62.9%,通州区40.1%,经济技术开发区39%,截止到一季度末我区一般预算收入增幅高于全市及市区平均增幅,但低于港闸区约5个百分点。
支出基本情况:一季度全区决算支出239441万元,其中一般预算支出31607万元,占年初预算30.4%,比去年同期增加5044万元,增长19%。
其中区本级支出28571万元,比上年增加4228万元,增长17.4%。
基金预算支出207834万元,主要是国有土地使用权出让金全额纳入预算管理支出207572万元。
二、全区收支主要特点及增减因素分析(一)财政收入总体保持高幅增长。
今年一季度,随着经济的复苏,我区收入实现恢复性增长,与去年同期相比增幅较高,一般预算收入增幅1月份为93.5%、2月份为56.9%、3月份为58%,收入增幅在高位运行,为近几年来第一季度增幅之最,其主要原因:一是去年受金融危机影响同期基数较低,去年1-3月份收入增幅分别为-14.2%、12.6%、-30.4%。
2010年一季度我国水产品贸易情况
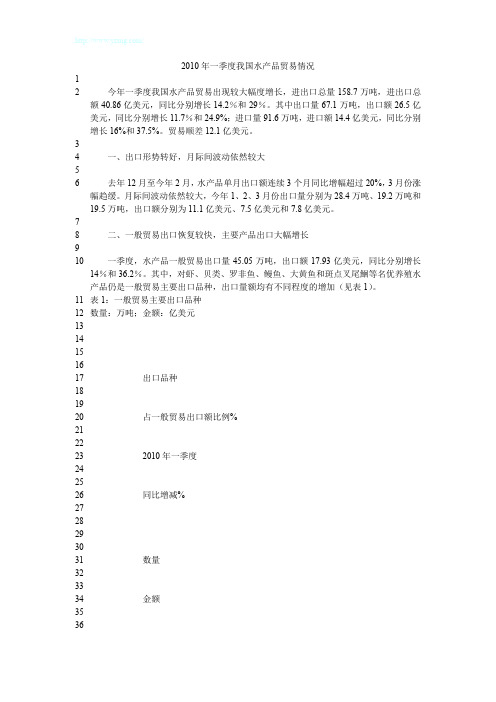
2010年一季度我国水产品贸易情况12今年一季度我国水产品贸易出现较大幅度增长,进出口总量158.7万吨,进出口总额40.86亿美元,同比分别增长14.2%和29%。
其中出口量67.1万吨,出口额26.5亿美元,同比分别增长11.7%和24.9%;进口量91.6万吨,进口额14.4亿美元,同比分别增长16%和37.5%。
贸易顺差12.1亿美元。
34一、出口形势转好,月际间波动依然较大56去年12月至今年2月,水产品单月出口额连续3个月同比增幅超过20%,3月份涨幅趋缓。
月际间波动依然较大,今年1、2、3月份出口量分别为28.4万吨、19.2万吨和19.5万吨,出口额分别为11.1亿美元、7.5亿美元和7.8亿美元。
78二、一般贸易出口恢复较快,主要产品出口大幅增长910一季度,水产品一般贸易出口量45.05万吨,出口额17.93亿美元,同比分别增长14%和36.2%。
其中,对虾、贝类、罗非鱼、鳗鱼、大黄鱼和斑点叉尾鮰等名优养殖水产品仍是一般贸易主要出口品种,出口量额均有不同程度的增加(见表1)。
11表1:一般贸易主要出口品种12数量:万吨;金额:亿美元1314151617出口品种181920占一般贸易出口额比例%2122232010年一季度242526同比增减%2728293031数量323334金额353637数量383940金额4142434445对虾46474814.61 495051 3.86 525354 2.62 55565727.3 58596043.4 6162636465贝类66676812.44 697071 5.43 727374 2.23 75767716.9 78798032.28182838485罗非鱼8687889.20 899091 5.94 929394 1.65 95969726.9 989910011.6 101102103104105鳗鱼1061071088.87 109110111 1.02 112113114 1.59 11511611735.3 11811912065.1 121122123124125大黄鱼126127128 4.04129130131 1.831321331340.725135136137124.5138139140225.9141142143144145斑点叉尾鮰1461471480.981491501510.441521531540.17615515615785.215815916090161162163164165合计16616716850.1416917017118.521721731749175176177178179180181182183184185186三、加工贸易转型步伐加快,进料加工贸易比重进一步增加187188一季度,水产品来进料加工贸易出口量22.09万吨,出口额8.53亿美元,同比分别增长7.2%和6.2%,出口额占水产品出口总额的32.2%,比上年同期减少7个百分点。
深圳市2010年国民经济和社会发展统计公报
深圳市2010年国民经济和社会发展统计公报文章属性•【制定机关】•【公布日期】2011.04.25•【字号】•【施行日期】2011.04.25•【效力等级】地方规范性文件•【时效性】现行有效•【主题分类】机关工作正文深圳市2010年国民经济和社会发展统计公报(深圳市统计局2011年4月25日)2010年,面对十分复杂的国内外经济环境,全市人民在市委市政府的正确领导下,坚持以科学发展观统领经济社会发展全局,认真贯彻落实党中央、国务院和省委省政府各项宏观调控政策措施,加快推进发展方式转变和结构调整,努力提高发展质量和效益,实现了国民经济又好又快发展,各项社会事业取得新发展。
一、综合初步核算,全年本地生产总值9510.91亿元,比上年(下同)增长12.0%。
其中,第一产业增加值6.00亿元,下降14.3%;第二产业增加值4523.36亿元,增长14.1%;第三产业增加值4981.55亿元,增长9.9%。
三次产业结构为0.1∶47.5∶52.4。
现代产业中,现代服务业增加值3362.86亿元,增长10.0%。
在第三产业中,批发和零售业增长15.4%,住宿和餐饮业增长9.3%,房地产业下降5.4%。
民营经济增加值2510.56亿元,增长11.8%。
图1:2006-2010年本地生产总值及增长速度(略)表1:2010年分区本地生产总值单位:亿元四大支柱产业中,金融业增加值1279.27亿元,增长10.6%;物流产业增加值926.30亿元,增长15.0%;文化产业增加值637.23亿元,增长22.9%;高新技术产业增加值3058.85亿元,增长17.1%。
战略性新兴产业中,生物产业增加值141.10亿元,增长23.9%;互联网产业增加值(全口径)1160.98亿元,增长16.7%;新能源产业增加值182.38亿元,增长29.1%。
全年完成地方财政一般预算收入1106.82亿元,增长25.7%。
其中各项税收收入991.98亿元,增长20.5%。
腾讯公布2010年第一季度兼全年财务报告
未来,我们将通过提高基本社区功能和推出满足用户多样化需求的SNS应用,持续提升SNS平台的用户价值。另外,我们正在加大力度将“QQ空间”拓展至无线平台,进一步扩大其覆盖和使用范围。就“QQ秀”而言,本季度包月用户数有所增长,是由于我们推行免费体验及增加免费项目吸引新用户,并将其中部分用户转化为付费用户所致。用户黏性也因个性化功能改进和推出包年套餐而增加。
网络广告业务
2010年第一季度,我们的网络广告业务受不利的季节性因素影响,因为广告活动通常在中国春节假期期间减少。季度内,我们持续发展跨平台以及用户定位广告解决方案,以彰显我们在市场上差异化特色。展望未来,我们将提升我们作为主流及具影响力的媒体形象、加强销售组织架构和利用我们的平台实力进一步改进我们的广告产品以实现长期增长。
2010年第二季度和第三季度,我们将借2010上海世博会和世界杯加大内容投入以及广告和推广活动,以提升我们的媒体影响力和行业地位。作为此策略的一部分,我们已向中国网络电视台购入播放权以向用户诚度和黏性提升的推动,“QQ会员”用户数稳步增长,主要因为捆绑了更多增值服务以及线上和线下生活特权所致。由于SNS应用日益流行,“QQ空间”的活跃账户数比上一季度增长10.4%至第一季度末的4.280亿。
财报显示,腾讯第一季度总收入为人民币42.261亿元(6.191亿美元),比上一季度增长14.6%,比去年同期增长68.7%。公司权益持有人应占盈利为人民币17.832亿元(2.612亿美元),比上一季度增长18.3%,比去年同期增长72.2%。
2010年第一季度业绩摘要:
总收入为人民币42.261亿元(6.191亿美元),比上一季度增长14.6%,比去年同期增长68.7%。
网络游戏业务受益于有利的季节性因素,主要几款中型休闲游戏和MMOG推出资料片并在假期做推广。“QQ游戏”也受益于游戏内推广,最高同时在线账户数增至680万。
2010年第一季度地价监测报告
2010年第一季度全国主要城市地价监测分析发布日期:2010-4-19 16:10:49 浏览次数:2805根据中国城市地价动态监测系统的最新统计快报,2010年第一季度,全国地价总体水平继续上涨,但受调控政策收紧和对后市预期不明朗的影响,涨幅明显收窄;居住地价增长率仍为各用途地价增长率之首;三大重点区域中,珠三角地区地价涨幅最高,体现了经济发达地区对整体经济形势和市场变化的敏感反应;个别二、三线城市同比、环比涨幅明显突出,应予以关注。
具体情况和分析如下:一、2010年一季度,全国地价态势简况(一)全国地价总体水平环比继续上升,但幅度明显收窄。
2010年第一季度,全国105个主要监测城市地价总体水平为2715元/平方米,商业、居住、工业分别为4822元/平方米、3938元/平方米和607元/平方米;环比增长率分别为2.34%、2.34%、2.97%、1.62%;同比增长率分别为8.14%、8.54%、11.86%、3.74%。
本季度,全国地价总体涨幅较上季度趋缓,但工业地价涨幅高于上一季度;与2009年第一季度相比,由于翘尾因素的影响,涨幅显著,但仍低于2007年的峰值水平。
无论是环比还是同比,居住地价涨幅均大于商业和工业。
36个重点监测城市地价总体水平变化趋势与全国保持一致,且各项指标均高于全国水平。
综合、商业、居住、工业地价水平分别为3671元/平方米、6003元/平方米、5286元/平方米和738元/平方米;环比增长率分别为2.97%、2.85%、3.31%、2.59%;同比增长率分别为9.91%、9.43%、13.61%、5.53%。
图1 2007年以来36个重点城市综合地价增长率曲线图(%)(二)三大重点区域中,珠江三角洲地区综合及各用途地价环比、同比增长率均为最高。
2010年第一季度,三大重点区域综合地价水平均高于全国总体水平。
其中,长江三角洲地区综合地价水平最高,为4202元/平方米;珠江三角洲地区次之,为3646元/平方米;环渤海地区最低,为2966元/平方米。
2010 年度业绩及2011 年一季度业绩情况简析--深
深交所多层次资本市场上市公司2010年年度业绩及2011年一季度业绩情况简析截至2011年4月30日,深交所1270家上市公司如期披露了2010年年报或年报数据,其中主板公司485家,中小板公司576家,创业板公司209家。
统计数据显示,深交所上市公司2010全年实现营业收入36,817.06亿元,同比增长34.78%;实现归属于上市公司股东的净利润2,486.34亿元,同比增长38.08%。
尽管2010年宏观经济形势存在诸多不确定因素,深交所各板块上市公司业绩仍然实现稳步增长。
一、深交所上市公司2010年总体业绩情况1、总体业绩增长明显2010年,深交所各板块上市公司业绩保持平稳增长势头。
主板485家公司共计实现营业收入26,678.62亿,同比增长35.20%;实现净利润1,508.13亿元,同比增长42.10%。
中小板576家上市公司平均实现营业收入16.12亿元,同比增长33.29%;平均实现净利润1.44亿元,同比增长32.53%。
超过90%的中小板公司实现营业收入增长;近80%的中小板公司实现营业收入、净利润双增长。
创业板上市公司2010年实现平均营业收入4.09亿元,同比增长38.02%,92%的创业板公司实现营业收入同比增长;平均净利润为0.71亿元,较上年增长31.2%,85%的创业板公司实现净利润同比增长。
2010年,深交所上市公司整体盈利能力较2009年度大幅提高,同时亏损面进一步缩小。
2、业绩增长源于主营,非经常性损益占比下降2010年,主板公司扣除非经常性损益后的净利润同比增加56.86%,超出净利润增幅14.76个百分点;非经常性损益占当期净利润比例为13.06%,同比下降8.22个百分点。
披露年报的中小板公司扣除非经常性损益后的平均净利润为1.35亿元,非经常性损益占净利润比例为6.25%,同比减少2个百分点。
创业板公司主业突出,利润总额中九成以上来源于主营业务;投资收益、营业外收支净额及公允价值变动损益等非经常性项目占当期利润总额比例分别仅为0.2%、8.7%与0.7%。
- 1、下载文档前请自行甄别文档内容的完整性,平台不提供额外的编辑、内容补充、找答案等附加服务。
- 2、"仅部分预览"的文档,不可在线预览部分如存在完整性等问题,可反馈申请退款(可完整预览的文档不适用该条件!)。
- 3、如文档侵犯您的权益,请联系客服反馈,我们会尽快为您处理(人工客服工作时间:9:00-18:30)。
深圳华强实业股份有限公司2010年第一季度季度报告全文§1 重要提示1.1 本公司董事会、监事会及董事、监事、高级管理人员保证本报告所载资料不存在任何虚假记载、误导性陈述或者重大遗漏,并对其内容的真实性、准确性和完整性负个别及连带责任。
1.2除下列董事外,其他董事亲自出席了审议本次季报的董事会会议未亲自出席董事姓名未亲自出席董事职务未亲自出席会议原因被委托人姓名方德厚董事因公出差周红斌1.3 公司第一季度财务报告未经会计师事务所审计。
1.4 公司董事长胡新安先生、主管会计工作负责人周红斌女士、财务部负责人邓少军先生声明:保证季度报告中财务报告的真实、完整。
§2 公司基本情况2.1 主要会计数据及财务指标单位:元本报告期末上年度期末增减变动(%)总资产(元)2,822,863,960.252,749,102,691.76 2.68%归属于上市公司股东的所有者权益(元)1,696,626,105.411,660,149,420.95 2.20%股本(股)666,949,797.00666,949,797.00 0.00%归属于上市公司股东的每股净资产(元/股) 2.54 2.49 2.01%本报告期上年同期增减变动(%)营业总收入(元)96,186,019.72521,361,965.88 -81.55%归属于上市公司股东的净利润(元)30,126,502.113,647,682.57 725.91%经营活动产生的现金流量净额(元)-590,922,730.07103,483,649.34 -671.03%每股经营活动产生的现金流量净额(元/股)-0.890.16 -656.25%基本每股收益(元/股)0.050.01 400.00%稀释每股收益(元/股)0.050.01 400.00%加权平均净资产收益率(%) 1.79%0.25% 1.54%扣除非经常性损益后的加权平均净资产收益1.71%-2.94% 4.65%率(%)非经常性损益项目年初至报告期期末金额计入当期损益的政府补助,但与公司正常经营业务密切相关,符合国家政策规定、按照一定标准2,100,000.00定额或定量持续享受的政府补助除外计入当期损益的对非金融企业收取的资金占用费398,250.00除同公司正常经营业务相关的有效套期保值业务外,持有交易性金融资产、交易性金融负债产生-891,000.00的公允价值变动损益,以及处置交易性金融资产、交易性金融负债和可供出售金融资产取得的投资收益除上述各项之外的其他营业外收入和支出50,740.00少数股东权益影响额-332,636.75所得税影响额163,688.30合计1,489,041.55对重要非经常性损益项目的说明无2.2 报告期末股东总人数及前十名无限售条件股东持股情况表单位:股报告期末股东总数(户)35,871前十名无限售条件流通股股东持股情况股东名称(全称)期末持有无限售条件流通股的数量种类俞海熊2,009,374 人民币普通股周遵文1,505,585 人民币普通股韩秀珍1,345,400 人民币普通股朱美华1,223,930 人民币普通股叶桥基1,069,794 人民币普通股蔡林森1,055,598 人民币普通股唐万贵1,018,700 人民币普通股俞炜1,012,200 人民币普通股李来杰950,700 人民币普通股卓汉松847,039 人民币普通股§3 重要事项3.1 公司主要会计报表项目、财务指标大幅度变动的情况及原因√适用□不适用1、货币资金较年初减少85%,主要是控股子公司深圳华强房地产开发有限公司项目建设支付货币资金;2、应收账款较年初增加31%,主要是控股子公司深圳华强房地产开发有限公司的酒店分公司住房餐饮收入挂帐金额增加;3、其他应收款较年初减少69%,主要是控股子公司深圳华强房地产开发有限公司年初的地价保证金转入存货;4、存货增加758%,主要是控股子公司深圳华强房地产开发有限公司地产项目地价等支出转入;5、应付职工薪酬较年初减少34%,主要是因为子公司发放上年计提的薪酬引起;6、公允价值变动收益较上年同期减少121%。
原因是上年同期交易性金融资产增值较大,本年同期略有调整;7、投资损失较上年同期减少91%,原因是上期联营企业亏损较严重,本年好转,亏损大幅减少;8、所得税费用较上年同期减少80%,主要是由于公司本部重组处置子公司形成亏损抵减应纳税所得额;9、营业收入、营业成本、营业税金及附加较上年同期分别减少 82%、93%、87%,主要原因是合并范围不同,上期包含东莞华强三洋电子等重组处置的公司,本期由于完成重组,不再包含这些子公司,另外控股子公司深圳华强房地产开发有限公司上年同期房产销售收入、成本和税金较多而本期因基本销售完毕相应收入成本和税金减少;10、销售费用、管理费用、财务费用较上年同期分别减少42%、47%、53%,净利润、归属母公司所有者净利润分别增加75%和726%,主要原因是合并范围不同;11、销售商品、提供劳务收到的现金、收到的税费返还、支付给职工以及为职工支付的现金、支付的各项税费较上年同期分别减少84%、97%、58%、80%,主要原因是合并范围不同;12、购买商品、接受劳务服务支付的现金较上年增加72%,经营活动产生的现金流量净额较上年同期减少671%,主要是控股子公司深圳华强房地产开发有限公司地产项目支出较上年增加;13、收回投资所收到的现金、取得投资收益所收到的现金为公司本部处置长期投资股权收入,上年同期无此收入;14、取得借款所收到的现金较上年同期减少89%,偿还债务所支付的现金较上年同期减少100%,系上年同期有较多银行借贷及还款,本期较少。
3.2 重大事项进展情况及其影响和解决方案的分析说明□适用√不适用3.3 公司、股东及实际控制人承诺事项履行情况√适用□不适用承诺事项承诺人承诺内容履行情况股改承诺华强集团2006年深圳华强股改时,华强集团承诺其持有的非流通股股份自获得上市流通权之日起,十二个月内不上市交易或者转让;在上述承诺期满后三十个月内不上市交易。
该承诺锁定之股份已转入下一项承诺由华强集团继续履行。
股份限售承诺华强集团华强集团关于本次重组新增的股份及原在深圳华强拥有权益的股份作出股份锁定的承诺 :自深圳华强本次非公开发行股份结束之日起三十六个月内,本公司不转让所拥有权益的深圳华强股份(包括本公司目前持有的深圳华强全部股份和本公司在深圳华强本次非公开发行中认购的全部股份)。
在上述限售期限届满后,上述股份的转让按中国证券监督管理委员会和深圳证券交易所的有关规定办理。
本公司及华强集团已于2009年11月24日办理完毕原有及新增股份的锁定手续,锁定期限为36个月,自2009年11月25日至2012年11月25日。
该承诺正在履行之中。
收购报告书或权益变动报告书中所作承诺不适用不适用不适用重大资产重组时所做承诺 华强集团 关于利润补偿的承诺:华强集团于2009年3月26日出具《承诺函》,就深圳华强本次重组采用收益法或假设开发法评估的相关资产所涉及的盈利补偿事项进行了约定,具体为:在本次重组完成后(含当年)的3年内,如果拟注入资产中采用收益法和假设开发法评估的资产,包括华强发展持有的华强世界70%股权、直接和间接持有的华强网络95.5%股权以及“华强广场”1~6层商业裙楼、“华强广场”酒店、地下商业和地下停车场(该等股权及资产以下统称“相关资产”)每年实际合计盈利数没有达到本次重大资产重组评估报告及评估说明中所预计的当年合计收益数(预计2009年、2010年和2011年相关资产的合计收益数分别为14,614万元、17,502万元和18,720万元),则华强集团将按照本次重大资产重组评估报告及评估说明中预计的相关资产的合计收益数与实际合计盈利数之间的差额对深圳华强进行补偿,但出现以下情况除外:若华强发展进行内部业务调整,导致相关资产对应的某一公司(资产)的实际盈利数未能达到预计数,但同时也导致华强发展及其下属另一公司(资产)的实际盈利数相应增加(增加数不少于前一公司(资产)减少数),且该增减变化总体上并不减少华强发展的合并净利润数。
该承诺正在履行之中。
华强集团 关于保持上市公司独立性的承诺:保持深圳华强人员独立、资产独立完整、财务独立、机构独立、业务独立。
该承诺正在履行之中。
华强集团 关于规范关联交易的承诺:本次交易完成后,本公司将严格按照《公司法》等法律法规以及上市公司的公司章程的有关规定行使股东权利或董事权利。
本次交易完成后,本公司和上市公司之间将尽量减少关联交易。
在确有必要且无法规避的关联交易中,保证严格遵循市场规则,本着平等互利、等价有偿的一般商业原则,公平合理地进行关联交易,依法履行信息披露义务,保证不通过与上市公司的关联交易取得任何不正当的利益或使上市公司承担任何不正当的义务。
该承诺正在履行之中。
华强集团 关于避免同业竞争的承诺:在本公司仍直接或间接对上市公司拥有控制权或重大影响的情况下,本公司及本公司的全资子公司、控股子公司或本公司拥有实际控制权或重大影响的该承诺正在履行之中。
其他公司将不会从事任何与上市公司目前或未来所从事的业务发生或可能发生竞争的业务。
如本公司及本公司的全资子公司、控股子公司或本公司拥有实际控制权或重大影响的其他公司现有经营活动可能在将来与上市公司发生同业竞争或与上市公司发生利益冲突,本公司将放弃或将促使本公司之全资子公司、控股子公司或本公司拥有实际控制权或重大影响的其他公司放弃可能发生同业竞争的业务,或将本公司之全资子公司、控股子公司或本公司拥有实际控制权或重大影响的其他公司以公平、公允的市场价格,在适当时机全部注入上市公司。
华强集团股份 工会委员会关于规范运作的承诺:本工会委员会将严格遵守《中华人民共和国工会法》和《社会团体登记管理条例》和中国证券监督管理委员会的监管要求,不涉及与工会的设立和活动宗旨不一致、可能会对工会正常经营活动产生不利影响的行为,也不直接或间接持有上市公司股份。
该承诺正在履行之中。
发行时所作承诺不适用 不适用 不适用其他承诺(包括追加承诺)不适用 不适用 不适用3.4 预测年初至下一报告期期末的累计净利润可能为亏损或者与上年同期相比发生大幅度变动的警示及原因说明√适用□不适用业绩预告情况扭亏年初至下一报告期期末上年同期增减变动(%)累计净利润的预计数(万元)约5,200.00-4,003.90 -- -基本每股收益(元/股)约0.08-0.13 -- -业绩预告的说明2009年公司进行了重大资产重组并已实施完毕,将亏损严重的视频产品的生产和销售业务剥离,同时置入电子专业市场与商业地产等资产,合并范围相应发生重大变化。