激光诱导击穿光谱谱峰元素的自动识别
激光诱导击穿光谱定量分析玉石中的Mg,Fe和Ca

激光诱导击穿光谱定量分析玉石中的Mg,Fe和Ca马芳丽;董前民;梁培;吴燕雄【摘要】基于对样品进行的激光诱导击穿光谱和 X射线荧光光谱分析测试建立了天然玉石中主要元素 Mg , Ca和微量元素 Fe的定标曲线。
实验采用纳秒级的Nd∶YAG激光器(波长:1064 nm)为光源,在延迟时间为3μs,激光脉冲累积数量为110,单个脉冲能量为100 mJ,脉冲重复频率为10 Hz的实验条件下,采用激光诱导击穿光谱技术装置对天然南阳独山玉石样品中的元素进行等离子体激发测试,得到波长在300~1000 nm的等离子光谱图。
通过将得到的光谱图中特征峰与美国国家标准与技术研究院数据库进行对比,发现测试样品中含有 Mg,Fe和Ca等元素,以X射线荧光光谱分析技术对四种南阳独山玉标准样品中测量出的Mg,Fe和Ca元素氧化物含量作为标准数据,选取含量比较高的Al元素作为内标元素,采用内标法对玉石光谱图中 Mg,Fe和Ca元素特征峰值进行线性拟合,从而得出 Mg,Fe和Ca三种元素的定标曲线,求出待测样品中这3种元素氧化物的含量,结果表明这三种元素氧化物的含量与中国珠宝宝石收藏鉴赏全集资料中所给出的元素氧化物含量的百分比范围 MgO (0.28%~1.73%),Fe2 O3(0~0.8%),CaO (18%~20%)相符合,相比于常用的方法,激光诱导击穿光谱技术可以快速地对待测样品进行检测,样品预处理简单且对样品损害较小。
进一步验证了激光诱导击穿光谱技术对于玉石应用的可行性。
%Based on laser induced breakdown spectroscopy and X-ray fluorescence spectroscopy,The calibration curve of the main elements Mg,Cr and trace element Fe in the Jade samples is obtained based on experimental results.In the experiment, LIBS experiment conditions were 3μs delay,110 accumulated laser pulse,100 mJ·pulse-1 ,10 Hz pulse repetition frequency, plasma in Nanyang jade was induced using nono-second Nd∶YAG (wavelength:1 064 nm)laser as the excitation source in the atmosphere envtronment of the laboratory.The spectral lines in the 300~1 000 nm wavelength range have been identified with the laser-induced breakdown spectroscopy.Through comparing the characteristic spectrum with the National Institute of stand-ards and Technology Research Institute (NIST)database,the element of Mg,Ca and Fe are found in the Jade ing the X-ray fluorescence spectra analyzed the metal elements Mg,Cr and Fe in Nanyang standard jade and obtained the content of elemental oxides,taking the content as standard data and selecting the high content element Al as internal standard element. According to LIBS calibration curve,we can calculate the content of 3 elements in the measured sample.The result shows that the concentration of elements locate in their corresponding standards range,for example,go(0.28%~1.73%),and Fe2 O3 (0~0.8%),CaO (18%~20%).Because of its unique features,like the absence of sample preparation,the ability to perform real-time,and in situ analysis as well as the quasi non-destruction and micro-analysis character of the measurements,so as to verify the feasibility of LIBS application in j ade.【期刊名称】《光谱学与光谱分析》【年(卷),期】2016(036)010【总页数】4页(P3337-3340)【关键词】激光诱导击穿光谱;X射线荧光光谱;玉石;内标法【作者】马芳丽;董前民;梁培;吴燕雄【作者单位】中国计量学院光学与电子科技学院,浙江杭州 310018;中国计量学院光学与电子科技学院,浙江杭州 310018;中国计量学院光学与电子科技学院,浙江杭州 310018;中国计量学院光学与电子科技学院,浙江杭州 310018【正文语种】中文【中图分类】O657.3玉石作为一种天然品, 不仅可以作为首饰、摆饰及装饰, 而且还可以用于养生健体。
基于激光诱导击穿光谱的大米Cr元素检测

基于激光诱导击穿光谱的大米Cr元素检测
张瀚宇;张晓强;张伟;邱荣
【期刊名称】《原子与分子物理学报》
【年(卷),期】2023(40)4
【摘要】激光诱导击穿光谱(LIBS)是一种元素快速分析的光学检测技术.在工业化发展进程中,重金属污染时刻威胁着大米等粮食作物生产地的安全性.以四川地区常见的Cr元素污染为例,采用双脉冲LIBS技术对市面上购买的五种地区大米中的Cr 元素进行定量分析,并与电感耦合等离子体质谱法(ICP-MS)检测结果进行对比.结果显示LIBS测量误差满足相对误差标准,证明了LIBS方法具有对元素进行快速定量分析的能力,是检测大米重金属元素含量的一种有效手段.
【总页数】6页(P104-109)
【作者】张瀚宇;张晓强;张伟;邱荣
【作者单位】西南科技大学数理学院极端条件物质特性联合实验室
【正文语种】中文
【中图分类】O434.13
【相关文献】
1.基于激光诱导击穿光谱技术对钢中Mn和Cr元素的定量分析
2.土壤中Cr元素激光诱导击穿光谱快速检测
3.土壤中Cr元素激光诱导击穿光谱快速检测
4.铝合金中元素Cr和Cu的双脉冲激光诱导击穿光谱检测
5.激光诱导击穿光谱技术用于大气气溶胶中Cr元素的检测
因版权原因,仅展示原文概要,查看原文内容请购买。
激光诱导击穿光谱技术及其在药学中的应用

激光诱导击穿光谱技术及其在药学中的应用摘要:激光诱导击穿光谱法是一种基于原子发射光谱和激光等离子体发射光谱的元素分析方法。
自LIBS问世以来,就被公认为是一种前景广阔的技术。
LIBS实验方法简单,在微小区域分析可弥补传统元素分析方法的不足,除了用于传统的实验室分析外,LIBS还是一种为数不多的可手持、便携式的元素分析技术。
由于无需复杂的前处理过程,LIBS技术简便、快速,非常适合大批量样品的快速、现场或在线检测,正在为分析领域带来众多的创新应用。
关键词:激光诱导等离子体;激光诱导击穿光谱;元素分析;定性;定量引言:激光诱导击穿光谱技术(LIBS)基于原子发射光谱和激光等离子体发射光谱,是一种正在发展中的对样品中元素成分进行快速、现场定性定量检测的分析技术。
本文介绍了LIBS的由来、基本原理、实验装置和实验方法特点,综述了LIBS在药学方面的应用。
分析得出LIBS技术应用方便快捷,能快速辨识药品真伪且应用前景广泛,有利于药品市场的质量监管,在药物分析中将获得更为广泛的应用。
1激光诱导击穿光谱技术的概述激光诱导击穿光谱技术(laserinductedbreakdownspectroscopy,LIBS)是一种原子发射光谱技术,适用于所有物质(气态、液态、固态),具有快速、微损、样品准备简单和多元素同时探测等优点,广泛地应用于爆炸物检测、文化遗产、生物医学分析、土壤重金属检测、地质分析、食品安全等领域。
利用LIBS技术和化学计量学方法结合可实现待测样品的分类识别。
2在药学领域的应用2.1化学药品LIBS技术在药物分析领域的应用已获得成功,非常适合用于药品生产质量控制、过程分析和监控。
由于在气体和液体样品测量中涉及相对复杂的辅助装置,较低的采集效率、容易导致的样品溅射污染等缺点,LIBS更适合用于固态包括粉末状压制成片剂后的样品分析。
以下介绍LIBS用于片剂和包衣分析的一些代表性的研究。
LIBS可用于多组分片剂的实时分析,以特征的元素原子发射谱线(如药物中磷和润滑剂中镁)进行定量分析,实现组分相近药物的快速区分。
激光诱导击穿光谱技术及应用研究进展

激光诱导击穿光谱技术及应用研究进展侯冠宇;王平;佟存柱【摘要】激光诱导击穿光谱(LIBS)技术是一种基于原子发射光谱学的元素定性、定量检测手段.本文介绍了LIBS技术的原理、应用方式、检测元素种类及检测极限;综述了该项技术在固体、液体、气体组分检测方面的技术发展,以及在环境检测、食品安全、生物医药、材料、军事、太空领域的应用进展.最后,提出了高功率、高稳定的激光光源和准确的定量分析方法是LIBS技术目前所面临的问题和挑战.【期刊名称】《中国光学》【年(卷),期】2013(006)004【总页数】11页(P490-500)【关键词】激光诱导击穿光谱;激光产生等离子体;元素分析;检测限【作者】侯冠宇;王平;佟存柱【作者单位】南京林业大学化学工程学院,江苏南京210037;南京林业大学化学工程学院,江苏南京210037;中国科学院长春光学精密机械与物理研究所发光学及应用国家重点实验室,吉林长春130033【正文语种】中文【中图分类】O433.54;O657.319激光诱导击穿光谱(Laser-Induced Breakdown Spectroscopy,简称LIBS)技术是利用激光照射被测物体表面产生等离子体[1-2],通过检测等离子体光谱而获取物质成分和浓度的分析技术。
相比于传统的光谱分析方法,如原子吸收光谱分析、电感耦合等离子体-原子发射光谱、电感耦合等离子体-质谱分析,LIBS技术具有快速(数秒钟就可以得出结果)、灵敏(检测限达到10-6~10-12)、多元素、远距离在线同时检测等优点而被广泛关注,是一种极具应用潜力的分析检测技术。
这项技术伴随着激光的发展而产生,上个世纪60年代初,F. Brech等人[3]在会议文摘中首次提出将激光作为原子发射光谱激发源的想法。
1963年,Debras-Guedon等人[4]将LIBS技术应用于光谱表面分析,随后Maker等人[5]于1964年将LIBS应用于气体分析,同一年,Runge等人[6]将LIBS技术应用于金属探测,随后LIBS技术开始被各国科学家广泛研究。
激光诱导击穿光谱法(LIBS)鉴别油漆样品
北京富尔邦科技发展有限责任公司【专业铸造信任服务赢得合作】激光诱导击穿光谱法(LIBS)鉴别油漆样品简介犯罪现场可以为调查所发生的事情提供有价值的信息。
尽管DNA分析盛行,但痕量证据可以为破案奠定坚实的基础。
痕量证据包括玻璃、头发、纤维、油漆和聚合物等物品。
痕量证据可以帮助建立人、物和地点之间的联系。
这里提到的案例将着眼于确定从嫌疑人的车辆中找到的油漆的元素特征是否与从犯罪现场找到的油漆样品进行区分的能力。
研究人员从护栏、交通标志和嫌疑人的汽车上提取了蓝色油漆样本。
可以使用光学显微镜、扫描电子显微镜/能量色散x射线光谱(SEM/EDS)、XRF 或XRD来比较油漆样品。
光学显微镜用于视觉比较,但不是决定性的。
SEM/EDS 可以区分不同的油漆样品,但油漆是不导电的,所以需要进行样品制备。
X射线荧光光谱(XRF)或X射线衍射光谱(XRD)可以分析单层油漆,多层油漆样品可能存在问题,且其元素覆盖范围有限。
激光诱导击穿光谱(LIBS)为样品中的每一个元素提供了快速微区分析。
LIBS光谱数据丰富,提供了独特的类指纹数据,用于提供良好的识别能力。
另外,LIBS比XRF具有分析多层油漆样品的能力。
深度分析是很重要的,因为许多汽车OEM涂层(如BASF)通常由4层组成,包括电泳层、中涂层、色漆层和清漆层。
最近,LIBS深度分析报告指出,彩色油漆和白色油漆的分辨率分别为99.6%和85.6%。
北京富尔邦科技发展有限责任公司【专业铸造信任服务赢得合作】工作参数Applied Spectra的J200 LIBS仪器266nm Nd:YAG激光(ns)使用Applied Spectra Axiom软件进行控制使用氦气或氩气吹扫的样品室三个蓝色油漆样品样品1:可疑车辆样品2:防护栏样品3:交通标志图1 3个样品正面及背面照片利用Applied Spectra数据分析软件对LIBS数据进行分析并转换成图像样品分析在本案例研究中,我们从嫌疑人的车上取得一个油漆样本,并与案发当时从一北京富尔邦科技发展有限责任公司【专业铸造信任服务赢得合作】条护栏及一个交通标志上获取的符合嫌疑人车辆颜色的油漆样本进行比较。
激光诱导击穿光谱技术快速探测煤灰中的重金属锌

激光诱导击穿光谱技术快速探测煤灰中的重金属锌周冯斌;刘玉柱;丁宇;尹文怡;祝若松;张启航;金峰;章炎麟【摘要】煤灰的成分指的是煤中矿物质的完全燃烧,产生各种金属和非金属氧化物和盐,这是使用煤时的重要参数.煤被广泛用于生产和人民生活,作为重要的能源物质.大量来自燃煤燃烧的煤尘(煤灰)被释放到大气中并与大气中的各种物质相互作用而形成雾霾.煤灰中的金属氧化物和空气中的小液滴之间发生一系列物理化学反应,这导致了雾霾的形成.在实验中,采用激光诱导击穿光谱(LIBS)分析煤灰中的元素.实验样品由某钢铁公司提供,分为七个样品,并标上序号.样品分别加入蒸馏水和0.1‰,0.2‰,0.2%,0.4%,0.8%,1%硫酸锌溶液,分别用1~7号标记.为了获得更好的LIBS信号,样品被研磨为粉末状,并使用蒸馏水使硫酸锌与煤灰充分混合.通过使用压片机将煤灰压制成10 mm直径和10 mm厚的煤灰块.为获得准确的元素结果,X射线荧光光谱也被用作参考,并且原始样品不含锌元素.由于光谱分析和波长漂移现象的不确定性,因此实验中,分别选择了铁,钙,钛和铝四种高纯单质.在相同的实验条件下,将四条测量的元素谱线与NIST原子光谱数据库中相应的谱图比较.实验中的所有光谱根据波长差或偏移进行校正.此时,纯单质的元素谱线可以与样品的光谱对齐.当元素谱中的特征线与样品中的谱线对齐时,样品就可以被识别和确认.由于铝元素与目标元素具有相似的化学和物理性质,铝元素是煤灰和地壳中的主要元素之一,具有中等的光谱强度.因此将铝元素作为内标元素,运用内标校准方法来确定样品中锌的浓度.模拟含锌大气气溶胶是通过向煤灰中添加含锌元素来实现的.还有一些其他的金属元素,包括铁,钙,锰,钛和铝也被用来加入煤灰中,用以模拟大气气溶胶.两种方法的相对差异分别为1.78%,3.39%,5.17%,0.20%.造成差异的原因可能是由于光谱仪缺乏分辨率或背景噪声的影响,这是可能导致测量误差的原因之一.由于实验室条件的限制,无法确定基底是否会影响实验结果,这将在未来的实验中得到进一步的证实.实验拟合曲线测得煤灰中锌的线性相关系数为0.99572,这表明可以通过粗略估算锌的激光强度来估计煤灰中的锌含量的实现.实验结果证明LIBS技术可用于煤灰中金属元素的快速检测,为基于锌含量的大气环境检测提供了一种新方法.在建立元素的校准曲线后,LIBS技术将来可以用来进行更快速,更准确的定量分析.【期刊名称】《光谱学与光谱分析》【年(卷),期】2019(039)006【总页数】6页(P1980-1985)【关键词】激光诱导击穿光谱;煤灰;重金属;锌;气溶胶;定量分析【作者】周冯斌;刘玉柱;丁宇;尹文怡;祝若松;张启航;金峰;章炎麟【作者单位】江苏省大气海洋光电探测重点实验室(南京信息工程大学),江苏南京210044;江苏省大气环境与装备技术协同创新中心,江苏南京 210044;江苏省大气海洋光电探测重点实验室(南京信息工程大学),江苏南京 210044;江苏省大气环境与装备技术协同创新中心,江苏南京 210044;江苏省大气海洋光电探测重点实验室(南京信息工程大学),江苏南京 210044;江苏省大气环境与装备技术协同创新中心,江苏南京 210044;江苏省大气海洋光电探测重点实验室(南京信息工程大学),江苏南京 210044;江苏省大气环境与装备技术协同创新中心,江苏南京 210044;江苏省大气海洋光电探测重点实验室(南京信息工程大学),江苏南京 210044;江苏省大气环境与装备技术协同创新中心,江苏南京 210044;江苏省大气海洋光电探测重点实验室(南京信息工程大学),江苏南京 210044;江苏省大气环境与装备技术协同创新中心,江苏南京 210044;Advanced Technology Core,Baylor College of Medicine,Houston,TX 77030,USA;江苏省大气海洋光电探测重点实验室(南京信息工程大学),江苏南京 210044;江苏省大气环境与装备技术协同创新中心,江苏南京 210044【正文语种】中文【中图分类】O433.4IntroductionThe composition of coal ash refers to complete combustion of the minerals in the coal, producing a variety of metals and non-metallic oxides and salts, which is an important parameter when using coal. Since the Second Industrial Revolution, coal has been widely used in the production and people’s life, as an important energy substance. A l arge amount of coal dust (coal ash) from coal combustion was released into the atmosphere and interacted with various substances in the atmosphere to form haze[1].There is plenty of heavy metal-zinc in the haze. Even if zinc is one of the indispensable trace elements in human life, it will also do great harm to the human body when exceeding a certain dose[2]. The absorption of iron in human body could be inhibited because of excessive zinc, resulting in the involvement of iron in the hematopoietic, system; there by intractable iron deficiency anemia appears. In the case of high levels of zinc in human body, it is difficult to cure anemia even with iron preparations [3]. Similarly, the atmosphere with excessive zinc will be dissolved in water, which could cause great damage to the aquatic animals and plants[4]. In addition, thecorrosion to outdoor buildings and accelerations of the aging of materials will be aroused because of a large amount of zinc present in haze[5-6]. Conventional detection of zinc includes inductively coupled plasma atomic emission spectrometry (ICP-AES) and inductively coupled plasma mass spectrometry (ICP-MS)[7-8]. However, these conventional methods are cumbersome, and the sample needs to be pre-processed and cost too much. Laser Induced Breakdown Spectroscopy (LIBS) is a novel elemental detection method that uses high-energy laser pulses to act on a sample to be measured, collected with a spectrometer. The atomic and ion spectra in the plasma are obtained to achieve material characterization and quantitative analysis[9-10]. LIBS technology has the advantages such as simple operation, short detection time, multi-element detection and so on, which enable rapid detection of the sample components [11].In this paper, a sample of coal ash obtained from a steel company was tested based on LIBS technology. The elements were analyzed, and also the spectra of these elements were obtained. To simulate haze containing zinc, the zinc compounds were added to the coal ash. In order to verify the accuracy of LIBS technology, test samples were compared with the ordinary coal ash, which did not contain zinc. After the quantitative analysis of zinc in coal ash, a calibration curve can be obtained as a reference line for zinc detection in the future. LIBS technology provides a new method for the detection and analysis of coal ash afterwards.1 Experimental setupThe schematics of the LIBS experiment are shown in Figure 1. Thespectrometer was provided by Avantes, and its grating is from 200 to 850 nm. The fi xed delayed time is 36.8 μs. The Q-switched Nd-YAG laser was used in the experiment, which is operated at a fundamental wavelength of 1 064 nm, and the maximum energy is 600 mJ in a single laser pulse, and the pulse energy for the employed laser beam in the current measurement is around 100 mJ per pulse with 10 ns duration at a frequency of 5 Hz.The laser beam is focused on the surface of the samples by a lens with a focal length of 300 mm to form a focal spot of about 100 μm in diameter. The resulting laser plasma spectral signal is coupled to an optical fiber through a quartz lens with a focal length of 50 mm and then it is transmitted to a spectrometer for spectral splitting and detection. To increase the stability and reduce the standard deviation of the spectral intensities, 10 measured spectra were averaged. The spectrometer and wavelength shift were calibrated via the pure metal samples.Fig.1 Experimental Device2 Sample preparationThe experimental samples were provided from a steel company, which was divided into seven parts. Distilled water and 0.1‰, 0.2‰, 0.2%, 0.4%, 0.8%, 1% zinc sulfate solution were added into samples, which were labeled with number 1~7 respectively. After mixing well, these samples were dried. In order to obtain a better LIBS signal, the sample was powdered. The water in the solution is used to thoroughly mix zinc with coal ash. In the experiment, the coal ash was pressed into 10 mm diameter and 10 mm thick coal ash blocks by using a tabletting machine. In order to getaccurate elemental results, X-ray fluorescence spectroscopy were also employed for reference, and the original sample did not contain zinc.3 Results and discussion3.1 LIBS elemental analysis of ordinary coal ashFigure 2—Figure 4 show the LIBS spectra of coal ash. It can be seen from the figures that the experiment has detected the characteristic spectra of Ca, Fe, K, Mn, Ti and Al were indicated in Figure 2. Undetected elemental sulfur is because the characteristic line of elemental sulfur is mainly in the infrared band, which is beyond the spectral range of this experiment. Fig.2 The LIBS spectrum of coal ash in 300~475 nmFig.3 The LIBS spectrum of coal ash in 475~600 nmFig.4 The LIBS Spectrum of coal ash in 600~800 nmDue to the uncertainty of spectral analysis and wavelength shift phenomenon, qualitative analysis of element was inaccurate. To solve this problem, four kinds of high-purity elements including iron, calcium, titanium and aluminum were separately selected. Under the same experimental conditions, four measured elemental spectral lines were compared with the corresponding spectra in the NIST atomic spectral database[12]. All the spectra in the experiment were corrected according to the wavelength difference or shift. At this point, the elemental spectrum of pure elements can be aligned with the samples’ spectrum. The samples then can be identified and confirmed when the characteristic line in the elemental spectrum is aligned with the spectrum in the samples. Figure S1—S4 show the comparative spectra of normal coal ash, pure Al,Ca, Mn and Fe, respectively. Al has characteristic peaks at 396.137, 394.403, 309.452 and 308.395 nm, which can be aligned with the characteristic peaks of the sample. Ca has characteristic peaks at 430.349 and 445.48 nm. Fe has characteristic peaks at 519.394, 527.157, 610.281, 612.263 and 616.223 nm.Ti has characteristic peaks at 453.713, 498.398, 500.095, 501.452, 506.537, 517.366, 519.394 and 521.083 nm.3.2 Element Analysis of LIBS Containing Zinc in Coal AshThe experimental results show that there is no zinc in the coal ash. In the second experiment, industrial zinc-containing atmospheric haze was simulated by adding zinc sulfate to the coal ash. To verify the accuracy of the LIBS measurement, the spectrum of coal ash was compared with the spectrum of the ash containing 1% zinc sulfate, which are shown in Fig.5 and Fig.6.To accurately identify zinc in the spectrum of the coal ash immersed in zinc solution, pure zinc was conducted to obtain the spectra to calibrate the spectrum of zinc in coal ash, which is shown in figure 5. Eight spectral lines of zinc were observed (328.441, 330.548, 334.758, 468.06, 472.562, 481.053, 589.08, 636.289 nm).Fig.5 The spectrum of pure zinc3.3 Quantitative Analysis of Zinc in Coal AshFigure 6 shows the spectra in the 300 to 495 nm bands of normal coal ash, coal ash in a 1% zinc solution and pure zinc. By comparing these three spectra, four lines (330.548, 334.758, 473.526 and 481.053 nm) in the sample spectrum can be easily identified. The spectrums of zincare alsoconfirmed in the literature[13]. As can be seen from Figure 6 characteristic spectrum line with the highest sensitivity is 481.053 nm. After comparative analysis of the experimental data, it was found that the characteristic line of zinc (ZnⅠ: 481.053 nm) is the least affected by the other elements in the experiment. And that’s why we chose this peak to calculate the content of zinc.Figure S5 shows the relative intensities of the two zinc lines, and the relative intensity increases with the concentration of zinc. For quantitative analysis, the internal standard calibration method was used to determine the concentration of zinc in the samples.The estimated detection limit for LIBS technique is about 0.2‰. According to the experimenta l results, when coal ash is 0.2‰ zinc solution, it can be detected. Due to experimental conditions and some instrumental reasons, when the concentration of zinc in the coal ash is as low as 0.1‰, the zinc emission intensity is very low, almost consistent with the noise.The quantitative analysis formula of LIBS is Lomakin-Scheibe formula[14] I=acb(1)where I is the observed intensity of the spectral line, a is the experiment constant, c is the concentration of the objective element, b is the self-absorption coefficient. At the same time due to the content of zinc is low, the self-absorption phenomenon is not obvious, so its influence is ignored, so the self-absorption coefficient can be ignored, b=1.I=ac(2)The element of Al was chosen as the internal standard for the experiment because Al has similar chemical and physical property with target element, and Al is one of the major elements in coal ash and the crust, and has moderate spectral intensities. So the above equation becomes∑(IZn/IAl)=aZncZn/aAlcAl(3)In Figure 7, the calibration curve was fitted by fitting the data with the concentration ratio of Zn/Al as an independent variable and ∑(IZn/IAl) as a dependent variable. And the concentration of Zn/Al in coal ash was chosen as abscissa and the laser intensity of spectrogram as ordinate, then the calibration curve of zinc was fitted. As can be seen from Figure 7, the linear correlation coefficient (R2) of the curve is 0.995 72, which means that the intensity of zinc in the LIBS spectrum is proportional to the concentration of the corresponding zinc solution.Table 1 Comparison of standard and LIBS resultsConcentration ofexperimentalconfiguration/%LIBSmeasurementresults/%Relativeerror/% 10.0010.181.788.007.733.394.004.215.172.001.990.20To test the accuracy of the calibration curve, the calculated value was obtained from the curve and compared with the standard value, and the results can be seen from Table 1. The exact values of zinc contentare 10%, 8%, 4%, 2% and that measured values by LIBS are 10.178%, 7.729%,4.207%, 1.996%. The relative differences between the two methods are 1.78%, 3.39%,5.17%, 0.20%, but the results are still within the margin oferror. The reason for the difference may be the lack of resolution of the spectrometer or the impact of background noise, which could lead to the measurement error. Because of the limitations of laboratory conditions, we can’t be sure whether the influence of matrix will affect the experiment results, and which will be further confirmed by future experiments. Therefore, it can be considered that the zinc concentration in the coal ash could be determined by the quantitative analysis of the zinc line by the LIBS technique.Fig.6 The spectrum of ordinary coal ash, zinc-containing coal ash and Pure zinc4 ConclusionIn this experiment, the elements of aluminum, iron, sodium, potassium, kalium, and calcium were found by elemental analysis of coal ash. Aluminum, iron,manganese and calcium can be identified accurately in the experiment. By adding zinc element to the coal ash to simulate the atmospheric haze with zinc content and analyzing its content, a number of characteristic spectra of zinc and coal ash were obtained, and the linear correlation between zinc and coal ash was obtained. The coefficient was 0.995 72, indicating that the content of zinc in the coal ash can be indirectly measured by the intensity of the characteristic peak of the spectrum. And the relative error from the exact value was within the error range. The experiments showed that the LIBS technology can be used for rapid detection of the composition and content of the elements in coal ash discharged by the enterprise. After establishing the calibration curve of theelements, the LIBS technique can be used to conduct a rapid and accurate quantitative analysis in the future. Furthermore, due to the high efficiency and real-time character of LIBS, this technique can also be applied to food safety, soil testing and other fields. Specific research will be further developed in the future.Fig.7 Calibration curve of zincReferences【相关文献】[1] Ma Jianzhong, Xu Xiaobin, Zhao Chunsheng, et al. Advances in Atmospheric Science,2012, 29(2): 1006.[2] Zhang Enlou, Liu Enfeng, Shen Ji, et al. Journal of Environmental Sciences, 2012,24(7): 1189.[3] Fekiacova Z, Cornua S, Pichat S. Science of the Total Environment, 2015, 51(1): 96.[4] Liu Mingda, Li Yue, Zhang Wei, et al. Procedia Environmental Sciences, 2013,18(2013): 283.[5] Beata Klimek. Bulletin of Environmental Contamination and Toxicology, 2012, 88(4): 617.[6] Peng Meng, Zhu Kun, Chen Lianhong, et al. Physical Testing and Chemical AnalysisPart B: Chemical Analgsis, 2012, 48(9): 1039.[7] Yang Yuewei, Zhang Yuxia, Yang Xiaohong, et al. Physical Testing and Chemical Analysis Part B: Chemical Analysis, 2016, 52(4): 427.[8] Choi JaeJun, Choi Soojin, Jack J Yoh. Applied Spectroscopy, 2016, 70(9): 1411.[9] Wang Li, Xu Li, Xu Weiqing, et al. Spectroscopy and Spectral Analysis, 2018, 38(1): 314.[10] Uzma G, Junaid M, Khalid Alamgir, et al. Spectroscopy and Spectral Analysis, 2017,37(10): 3266.[11] Farooq W A, Tawfik W, Alahmed Z A, et al. Journal of Russian Laser Research, 2014,35(3): 252.[12] NIST Atomic Spectra Database,https:///PhysRefData/ASD/lines_form.html.[13] Johansson I, Contreras R H. Ark. Fys, 1968, 37: 513.[14] Lomakin B A. Zeitschrift fur Anorganische und Allgemeine Chemie, 1930, 187(75).。
激光诱导击穿光谱元素谱线自动识别方法研究
基金项 目:国家 自然科 学基 金项 目(0 0 O 8 ,国家重 大科技专 项 ( o 8 xo 5 7 0 9 X04 0 ,中 国科学 院 知识 创新 工程 重大 项 目 6981 ) 2 0 z 7 2 ,2 0 Z 7 2 )
(z ̄l w 6 1 和安徽 省科技计划项 目(8 H3 18 ) kc y 0— ) 0 0 3 b 5 1资助
Fi 1 Ex rm e ald v c g. pe i nt e ie
2 相 似性测度 与光谱模拟
相 似性 测度 的表示形式很 多,可 以归结为两矢 量问的距
确定峰“ ” 从 N S 1, IT库中查询到峰“” 1 可能为 F 34 0 9 e I: 4 . 9
n K I :3 4 0 5 n l m, I 4 . 0 l ,Ti T I:3 3 9 n ,Al 4 . 3n ] I:3 3 9 5 4 . 3
光器 , 脉宽为 6n , 冲重复频率为 1 2 , 冲能量 5 s 脉 - 0Hz 脉 o mJ ;光谱 仪 ( en pi 2 0 +) Oca o t sHR 0 0 测量 波长 范 围:3 0 c 0 ~ 5 0nn 0 r,分辨率 0 1nn . I,两个 聚焦镜均为石英透镜 ,样 品台
光谱学 与光谱分析
2 1
由步进 电机控制其转动 , 首先通过计算机控制光 谱仪使其 向 激光器发送 兀 L信号令 激 光器 出光 , 光经 过全反镜 垂直 激
入射到聚焦镜 , 再经聚焦镜聚焦作用 到样 品上 , 产生 的激光
式 。当考虑到谱线叠 加和 LB I S光谱 的连 续背景 辐射 时 , 谱
谱线库 中强度 比较大 的谱线 的方法对谱线进 行归属识别 ; 亓
libs激光诱导击穿光谱
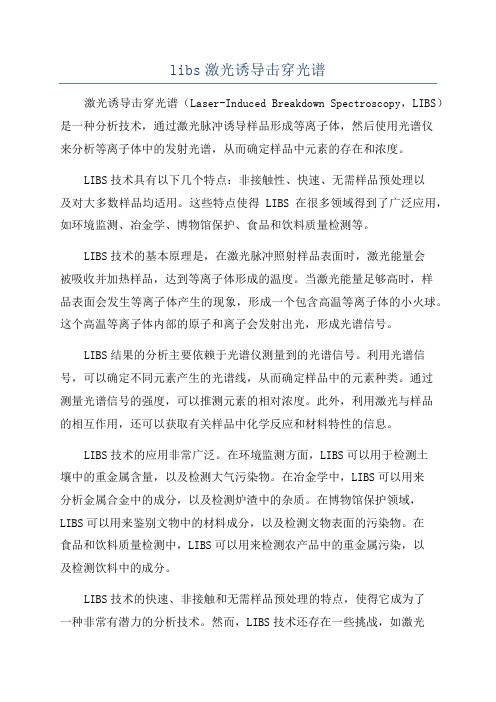
libs激光诱导击穿光谱激光诱导击穿光谱(Laser-Induced Breakdown Spectroscopy,LIBS)是一种分析技术,通过激光脉冲诱导样品形成等离子体,然后使用光谱仪来分析等离子体中的发射光谱,从而确定样品中元素的存在和浓度。
LIBS技术具有以下几个特点:非接触性、快速、无需样品预处理以及对大多数样品均适用。
这些特点使得LIBS在很多领域得到了广泛应用,如环境监测、冶金学、博物馆保护、食品和饮料质量检测等。
LIBS技术的基本原理是,在激光脉冲照射样品表面时,激光能量会被吸收并加热样品,达到等离子体形成的温度。
当激光能量足够高时,样品表面会发生等离子体产生的现象,形成一个包含高温等离子体的小火球。
这个高温等离子体内部的原子和离子会发射出光,形成光谱信号。
LIBS结果的分析主要依赖于光谱仪测量到的光谱信号。
利用光谱信号,可以确定不同元素产生的光谱线,从而确定样品中的元素种类。
通过测量光谱信号的强度,可以推测元素的相对浓度。
此外,利用激光与样品的相互作用,还可以获取有关样品中化学反应和材料特性的信息。
LIBS技术的应用非常广泛。
在环境监测方面,LIBS可以用于检测土壤中的重金属含量,以及检测大气污染物。
在冶金学中,LIBS可以用来分析金属合金中的成分,以及检测炉渣中的杂质。
在博物馆保护领域,LIBS可以用来鉴别文物中的材料成分,以及检测文物表面的污染物。
在食品和饮料质量检测中,LIBS可以用来检测农产品中的重金属污染,以及检测饮料中的成分。
LIBS技术的快速、非接触和无需样品预处理的特点,使得它成为了一种非常有潜力的分析技术。
然而,LIBS技术还存在一些挑战,如激光能量的均匀性、等离子体温度的测量和校正、光谱数据处理等。
因此,在进一步推广和应用LIBS技术时,需要进一步改进仪器设计和数据分析算法,以提高其分析精度和稳定性。
总之,LIBS技术是一种非常有潜力和应用广泛的分析技术,可以用来快速、准确地分析样品中的元素成分和浓度。
- 1、下载文档前请自行甄别文档内容的完整性,平台不提供额外的编辑、内容补充、找答案等附加服务。
- 2、"仅部分预览"的文档,不可在线预览部分如存在完整性等问题,可反馈申请退款(可完整预览的文档不适用该条件!)。
- 3、如文档侵犯您的权益,请联系客服反馈,我们会尽快为您处理(人工客服工作时间:9:00-18:30)。
其次依据相关定量实验对主要研究内容进行了有效验证。论文的主要工作如下:1.由于与激光能量、门宽、延时和实验环境等因素的影响,在LIBS中不可避免的会产生连续背景。
考虑到连续背景和光谱中极小值点具有一定的关联,提出了一种基于样条插值的LIBS光谱连续背景的检测与校正方法。该方法对光谱中合适的极小值点进行插值计算能够合理的估计出光谱中的连续背景并校正。
通过信背比的计算以及定量实验的结果分析对该方法进行了有效的验证。结果表明:传统方法获得了(10.09,25.63)范围的信背比,插值法能够得到26.96的信背比。
并且通过对光谱背景校正后的定量实验的分析结果中,传统方法得到的相关性在(0.9134,0.9790)范围内,插值法获得了0.9985的相关性。2.针对在LIBS光谱的采集过程中,由于元素谱线的特性以及实验设备和环境的影响而产生的谱线之间的重叠干扰,提出了一种基于误差补偿的方法对重叠谱峰进行校正。
通过对光谱中Cu-Fe重叠谱峰的校正以及Cu元素的定量实验充分验证了该方法的有效性。结果表明:与传统方法相比,基于误差补偿的重叠峰校正方法能够有效提高0.86%-1.82%的相关性,减小18.12%-32.64%的拟合误差。
分别利用NIST标准数据库建立的模拟光谱和茶叶样品LIBS光谱数据进行了实验研究。结果表明:传统的相关性分析方法获得了79%的准确识别率,本文所述的谱峰识别方法能够得88%的准确识别率,验证了该方法在LIBS谱峰元素识别上的有效性。
激光诱导击穿光谱谱峰元素的自动识别
激光诱导击穿光谱技术(Laser-induced breakdown spectroscopy,LIBS)是一种以高能量激光脉冲作用在样品上,使样品产生等离子体而获得原子发射光谱的新型光谱分析技术。该方法能够从物理学和光谱学上对样品的物质成分以及含量进行有效分析。
由于LIBS光谱技术具备多元素同时检测与分析、无损(或微损)检测等优点,在各个领域都得到了广泛的应用。原始采集的激光诱导击穿光谱通常含有大量的元素特征谱峰,对于这些谱峰的准确识别是进行元素检测与分析的前提和基础。
3.研究了激光诱导击穿光谱中大量的元素特征谱峰,并对这些谱峰对应的元素进行了识别。该方法首先对实验光谱进行拟合来获得光谱中的特征谱峰,提取拟合谱峰的中心波长、光强、半高宽和谱峰质心作为谱峰特征参数向量;并将待识别光谱的谱峰特征参数向量与标准谱线数据库中的元素谱线进行相似性分析,从而实现谱峰元素的自动识别。