国际知名咨询公司的图表大全(模板)PPT课件
贝恩《贝恩咨询PowerPoint模板及图表库》15- 2页

Recycling
• First level bullet
Text
-Second level dash Third level arrow
• First level bullet
-Second level dash Third level arrow
Text Text • First level bullet
Segmented circular arrows
Segment 4
Segment 1
Segment 3
Segment 2
BOS Bain-Template (revised)
16
This information is confidential and was prepared by Bain & Company solely for the use of our client; it is not to be relied on by any 3rd party without Bain's prior written consent.
• First level bullet
- Second level dash
Third level arrow
• First level bullet
-Second level dash
Third level arrow
• First level bullet
- Second level dash
Triangle
Text
Text
Text
Text
BOS Bain-Template (revised)
18
This information is confidential and was prepared by Bain & Company solely for the use of our client; it is not to be relied on by any 3rd party without Bain's prior written consent.
咨询公司ppt大全

ThemeGallery is a Design Digital Content & Contents mall developed by Guild Design Inc.
ThemeGallery is a Design Digital Content & Contents mall developed by Guild Design Inc.
Design Digital Content & Contents mall developed by Guild Design Inc.
Guild Design is one
of aligned company with Microsoft Ltd, and we develop and provide the design templates for Office 97, 2000, and XP.
• Add your title in here
ThemeGallery is a Design Digital Content & Contents mall developed by Guild Design Inc.
Diagram
Title
Add your text
ThemeGallery is a
ThemeGallery is a Design Digital Content & Contents mall developed by Guild Design Inc.
02.Title • Add your text in here • Add your text in here • Add your text in here
text1
Subtitle
管理咨询公司图表示意图PPT模板

Add your title in here - Your text in here - Your text in here
Add your title in here - Your text in here - Your text in here
LOGO 2ppt ppt模板下载
Diagram
ThemeGallery is a Design Digital Content & Contents mall developed by Guild Design Inc.
ThemeGallery is a Design Digital Content & Contents mall developed by Guild Design Inc.
ThemeGallery is a Design Digital Content & Contents mall developed by Guild Design Inc.
by Guild Design Inc.
ThemeGallery is a Design Digital Content & Contents mall developed by Guild Design Inc.
ThemeGallery is a Design Digital Content & Contents mall developed by Guild Design Inc.
by Guild Design Inc.
LOGO 2ppt ppt模板下载
Progress Diagram
Add your text in here Add your text in here
Your text in here
《咨询公司模板》课件

案例一:市场调研报告PPT
市场调研报告 PPT模板介绍
市场调研报告 PPT模板应用案 例
市场调研报告 PPT模板制作技 巧
市场调研报告 PPT模板下载和 使用方法
案例二:商业计划书PPT
商业计划书 PPT模板:适 用于初创企业、 中小企业的商 业计划书制作
内容结构:包 括公司介绍、 市场分析、产 品介绍、商业 模式、营销策 略、财务预测
演示:在 演示时, 注意节奏 和语气, 确保观众 能够理解 内容
YOUR LOGO
THANK YOU
汇报人: 汇报时间:20X-XX-XX
结尾页内容编写
总结:总结本次PPT的主要内容和观点 感谢:感谢听众的聆听和参与 联系方式:提供咨询公司的联系方式,以便听众进一步了解或咨询 结束语:结束语,如“谢谢大家”,“期待下次再见”等
咨询公司PPT模板美化技巧
字体选择与排版
字体选择:选 择清晰易读的 字体,如Arial、
Calibri等
添加标题
结束语:感谢观看,期待合 作
成功案例:展示公司的成功 案例和客户评价
添加标题
添加标题
添加标题 目录:列出所有章节和内容
添加标题
团队介绍:介绍公司的核心 团队和专家
添加标题
联系方式:提供公司的联系 方式和地址
模板适用场景
企业战略规划 市场调研分析 项目管理
团队协作 客户关系管理 财务分析与预测
YOUR LOGO
咨询公司模板 PPT课件
汇报人:
,
汇报时间:20X-XX-XX
咨询公司模板概 述
咨询公司PPT模 板结构
咨询公司PPT模 板内容编写
咨询公司PPT模 板美化技巧
《咨询公司简介》PPT课件
• Part II. Do You Have What It Takes? (Please skip if you already have the answer)
• Part III: Getting Prepared
9
精选PPT LOGO
10
精选PPT LOGO
咨询公司
1
精选PPT LOGO
Contents
ThemeGallery is a Design Digital Content & Contents mall developed by Guild Design Inc.
▪ Click to add Text ▪ Click to add Text ▪ Click to add Text ▪ Click to add Text ▪ Click to add Text
5
精选PPT LOGO
部分咨询公司的业务领域
6
精选PPT LOGO
世界上最著名的咨询公司简介
• 1,McKinsey & Company 麦肯锡公司
该公司已在大中华地区(北京、上海、香港和台北)设立了四家分公司, 其业务主要是为中国大陆、香港和台湾的著名公司和机构提供管理咨询服务
•2,A.T. Kearney科尔尼公司
出原因,制定切实可行的改善方案; ❖• 指导改善方案的实施; ❖• 传授经营管理的理论与科学方法,培训企业各
级管理干部,从根本上提高企业的素质
3
精选PPT LOGO
Hot Tip:咨询公司就是点子公司 吗?
❖ 什么是咨询公司 (可以和上页一起看)
❖ 咨询公司是指以脑力劳动为主的服务型公司,它根据委托者 的意向和要求,以自己的专门知识和经验向委托者提供建议,或 者提供具体服务,并由此而向委托者收取咨询费。
世界知名管理咨询公司模板(很值得下载)PPT课件
Operating Margin Growth in Excess of Competitive Peers
compound annual growth rate over five years
[Source: IBM, CEOs are expanding the innovation horizon: important implications for CIOs]
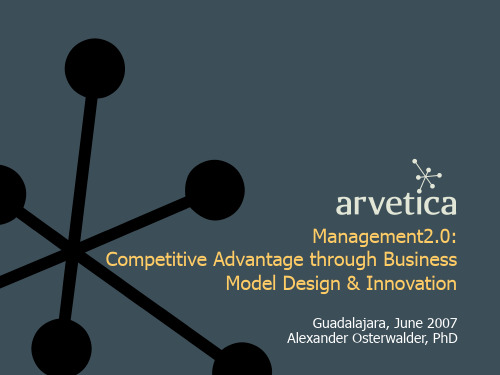
Management2.0: Competitive Advantage through Business
Model Design & Innovation
Guadalajara, June 2007 Alexander Osterwalder, PhD
change is the process by which the future invades our
where do YOU see the largest opportunities to improve strategic management today?
your expectations for today?
what is innovation?
tell me about the most important innovations in your company
risus ut egestas pulvinar, lectus ante feugiat quam, sit amet congue odio lacus ac ipsum. Aliquam suscipit, est ut volutpat vulputate, nulla felis
Text Text pulvinar libero, non ornare libero ipsum tristique tortor. Fusce sed lorem vitae justo feugiat malesuada. Donec aliquet. Vivamus semper eros nec diam. Vivamus sem arcu, imperdiet nec, congue ac, scelerisque vel, nulla. Donec et mauris. Integer a nulla vulputate pede consequat euismod. Praesent molestie urna nec leo. Proin eros. Maecenas ac sem nec dui sodales tempus. Maecenas suscipit egestas velit. Suspendisse vel tortor. Proin imperdiet, sem nec aliquet ultrices, nunc est egestas eros, non hendrerit magna eros eget augue. Maecenas sed leo vitae leo faucibus vulputate. Proin dignissim eros at augue.
国际知名咨询公司的图表大全
US Business Group
Agenda
General rules Bar and column graphs Line and combination graphs Area graphst and bubble graphs Presenter/timing Presenter/timing Presenter/timing Presenter/timing Presenter/timing Presenter/timing
32
CAGR
25
1998-2002
68%
The CAGR block should be placed to the right of the graph. Font size should be close to that the graph’s data labels
16
7 4
In general, use whole numbers unless you have a specific reason for including decimals
Cumulative number of Rhodes Scholars, 1900-1980
Harvard vs. Yale
120 100 80 60 40 20 4 0 1900 1920 1940 1960 1980 2 16 7 8 20 25 50 32 Yale Harvard 99
Do not add unit symbols (e.g., $ or M) to the axis labels (except for %). Set the intervals to the largest reasonable value possible
顶级咨询公司配色指南
顶级咨询公司配色指南怎么让自己看起来像是一个Consultant?要想做一张看上去很fancy的PPT,其实有很多需要注意的地方,比如说要学会搭建Storyline、学会合理的PPT布局、找到最合适的视觉化方式…这些都不是短时间就能学会的事情。
但是,找到最合适的配色还是容易的,尤其是跟着顶级咨询公司学配色,就简单多了。
接下来,我们就一起来看看顶级咨询公司的PPT配色!今天我们从11家顶级咨询公司的PPT和研报中选取了一些非常有审美代表性的“slide作品”。
一起来欣赏吧~一、McKinsey麦肯锡公司(McKinsey & Company)是一所由芝加哥大学会计系教授詹姆斯·麦肯锡创立于芝加哥的管理咨询公司,营运重点是为企业或政府的高层干部献策、针对庞杂的经营问题给予适当的解决方案,有“顾问界的高盛”之称。
麦肯锡的PPT以蓝色为主色调,整体看起来很干净又不失专业。
麦肯锡的PPT非常有自己的风格:标准化的颜色、字体、布局和页眉页脚。
在真正的麦肯锡风格下,PPT的内容也很扎实,罗列了很多分析和数据,同时视觉化的处理也很恰当,时间线、价值链、气泡图、直方图、成熟度模型、瀑布图和ROE分析都一目了然。
二、Boston Consulting Group1963年,在哈佛商学院毕业的布鲁斯·亨德森创立了波士顿咨询公司(Boston Consulting Group,缩写:BCG)。
BCG 为一家管理咨询公司,在全世界50国中设有超过90家分公司。
涉及的行业非常广泛,涵盖消费品、工业品、能源、医疗保健、高科技、媒体及电信、金融服务及保险等行业。
BCG的主色调是其标志性绿色,同时利用深浅不一的绿色来区分不同的区域。
BCG的PPT基本都会在第3-4页的位置放一个摘要,这可以帮助观众在很早的时候就清晰知道演讲的结构和内容。
同时,每一页PPT的标题都非常清晰,都在围绕主题回答关键问题。
此外,PPT中用到了大量不同的形状格式、表格和图形来展示数据和传达想法,有的时候会缺少留白不够美观。
麦肯锡咨询公司成功和失败ppt课件
•
公司变革
• 竞争的失利使麦肯锡的高层领导者认识到,公司原有的经营模式已经不能适 应咨询业的发展趋势和竞争要求,公司战略和组织结构的调整已经势在必行 。麦肯锡首先对在纽约的分支机构进行了改革,试点成功后再将改革方案在 全公司范围内迅速推广。并很快发展起各自的客户基础。 同时,公司更加重视管理职能型专家。在管理职能方面,战略制订、组织规 划和政策执行等都需要灵活多样的知识和经验。经过一系列的改革与调整, 麦肯锡公司终于于20世纪80年代初走出低谷,重新开始复兴和繁荣。
•
对中国咨询企业的启示
首先是思想观念的转变。先进的管理方法 不是万能的,只有合适的管理方法才是最 好的。 其次,要有完善的管理制度和管理流程。 审视企业的每一项职能管理,加强企业的 基础管理工作比引进一项流行的管理方法 更重要。 再次,要有充足的人力资源准备。
•
公司变革 势在必行
试点改革 迅速推广
试点改革 迅速推广
重新开始 的繁荣
学习机制
为了进一步促进知识和信息在组织内的充分流通,麦肯锡公司还打破了以往 建立在客户规模和重要性基础上的内部科层组织体系,取而代之的是以知识 贡献率为衡量标准的评价体系。这样组织内的每一个部门和每一个成员都受 到知识贡献的压力,而不是仅仅将工作重点放在发展客户方面。
发展历程
十年危机
3
添加文本
4
公司变革
学习机制
5
6
知识管理
公司概况
麦肯锡采取“公司一体”的合作伙伴关系制度,在全 球44个国家有80多个分公司,共拥有7000多名咨询 顾问。麦肯锡大中华分公司包括北京、香港、上海与 台北四家分公司, 共有40多位董事和250多位咨询顾 问。在过去十年中,麦肯锡在大中华区完成了800多 个项目,涉及公司整体与业务单元战略、企业金融、 营销/销售与渠道、组织架构、制造/采购/供应链、技 术、产品研发等领域。 麦肯锡的经验是:关键是找那些企业的领导们,他们 能够认识到公司必须不断变革以适应环境变化,并且 愿意接受外部的建议,这些建议在帮助他们决定作何 种变革和怎样变革方面大有裨益。国外许多行业的公 司很早就知道,他们不可能在所有他们涉及的领域都 处于世界先进水平,因此没有必要拥有那些在偶然情 况下才会用到的专家。
世界顶尖咨询公司的PPT风格
xx年xx月xx日
目录
• 背景介绍 • 公司概览 • ppt风格特点分析 • 公司案例展示 • ppt制作技巧分享 • 总结与展望
01
背景介绍
什么是世界顶尖咨询公司
• 世界顶尖咨询公司是指全球范围内在管理咨询领域具有显著影响力和权威性的公司。这些公司通常以提供战略规划、组 织变革、运营优化等咨询服务为主业,帮助客户提升业绩、解决问题和应对挑战。
特的风格
选择简洁的文字
使用合适的图表
使用简洁、清晰的文字,可以使演示文稿更 易于阅读和理解。
使用图表可以帮助更好地表达数据和观点, 增强演示文稿的说服力。
统一色彩和风格
排版整洁、清晰
使用统一、协调的色彩和风格可以使演示文 稿更具有整体感和专业性。
通过排版可以使演示文稿更加整洁、清晰, 提高观众的阅读体验。
为什么这些公司是顶尖的
世界顶尖咨询公司之所以能够在管理咨询领域独 树一帜,主要原因在于它们在以下几个方面表现 突
品牌声誉和口碑:这些公司在业界拥有极高的知 名度和声誉,其品牌价值和服务质量得到了广泛 认可
专业能力和经验:这些公司拥有众多经验丰富、 专业精湛的咨询顾问,他们具备跨行业、跨领域 的专业知识和实践经验,能够为客户提供高质量 的咨询服务。
06
总结与展望
对公司ppt风格的总结
简洁大方
世界顶尖咨询公司的ppt风格通常都十分简洁、专业,避 免使用过多的图形和动画效果,强调清晰明了的表达。
数据驱动
这些公司的ppt通常以数据为支持,通过数据分析来支持 他们的观点和建议。
图表直观
使用图表是这些公司ppt的常见特点,如柱状图、折线图 和饼图等,这些图表直观地展示了数据和趋势。
- 1、下载文档前请自行甄别文档内容的完整性,平台不提供额外的编辑、内容补充、找答案等附加服务。
- 2、"仅部分预览"的文档,不可在线预览部分如存在完整性等问题,可反馈申请退款(可完整预览的文档不适用该条件!)。
- 3、如文档侵犯您的权益,请联系客服反馈,我们会尽快为您处理(人工客服工作时间:9:00-18:30)。
10
7
5
4
0 1998
1999
2000
32 25
2001
2002E
CAGR 1998-2002
68%
The CAGR block should be placed to the right of the graph. Font size should be close to that the graph’s data labels
In general, include all relevant information while keeping the graph as simple as possible
Cumulative number of Rhodes Scholars, 1900-1980
Harvard vs. Yale
Title is bold, with the time period appearing after a comma. Always write out the year in full. The optional subtitle provides additional info on the data and is not bold, italics, 2 points smaller than the title. Line spacing is 1
Make sure that the graph is resized with the same aspect ratio (vertical/horizontal proportions)
If the text becomes distorted, undo immediately!
Use the corner object boxes only when resizing graphs! It is also advisable to hold down the <shift> key when doing so
When the data refers to projected or estimated figures, add “E” to the year label
Remember to adjust the document title tracker when you create a new document. It should match the name of the PowerPoint file
Do not add unit
120
symbols (e.g., $
or M) to the axis
100
labels (except for
%).
80
Set the intervals
60
to the largest
reasonable value
40
possible
20
0
All numbers in the graph (data and axis labels) should be the same size. Text labels may be smaller if necessary
In general, do not use borders on bars, columns, pie pieces, et cetera
Be careful when resizing graphs!
If resizing graphs in the main PowerPoint application, make sure to use only the corner object boxes (see diagram)
35
30
25
20
15
10
5
4
0 1995
7 1996
32 25 16
1997
1998E
1999E
The safest way to change the size or position of graph elements is to do so within the native graph application itself
Yale Harvard
42 1900
78 1920
16 20
50 25
1940
1960
99 32
1980
If a legend is needed, place it to the right of the graph or within the plot area. Do not add a border and set the font to roughly the same size as the data labels
In general, use whole numbers unless you have a specific reason for including decimals
Axis titles are optional and should not be used if the information is given elsewhere or is self-evident
Templates –a
General rules Bar and column graphs Line and combination graphs Area graphs Pie graphs Scatter plot and bubble graphs
Participation in Harley Davidson conventions, 1998-2002
Thousands of people
35
When used, axis
30
tick marks should
be placed on the
25
outside of the axis
20
16
Presenter/timing Presenter/timing Presenter/timing Presenter/timing Presenter/timing Presenter/timing
Create graphs using the native PowerPoint chart software, rather than pasting graphs from Excel