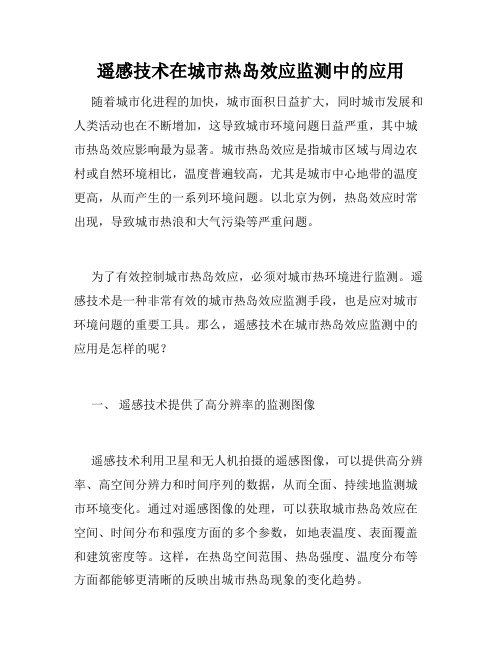
城市热岛效应卫星遥感分析
利用HJ-1B星热红外遥感图像研究城市热岛效应
利用HJ-1B星热红外遥感图像研究城市热岛效应随着城市化进程的加速,城市热岛效应成为日益引起人们关注的热点问题之一。
城市热岛效应通常表现为城市区域高于周围农村地区的温度,与此相关的环境问题也伴随而来。
因此,研究城市热岛效应对城市规划及环境保护具有重要的实际意义。
热红外遥感技术通过红外辐射测量被观测物体的表面温度来推断地表及其覆盖物的热状态,因此被广泛应用于城市热岛效应的研究中。
我国的HJ系列卫星拥有优越的热红外遥感能力,其中HJ-1B星通过搭载的三光谱扫描成像仪(IRS)可获得高分辨率的热红外遥感图像,为研究城市热岛效应提供了重要的数据来源。
本文选取了2017年7月上海市的HJ-1B星热红外遥感图像为研究样本,深入分析了城市热岛的地域分布规律以及与城市发展密切相关的空间特征。
首先,本文利用地理信息系统(GIS)软件将热红外遥感图像进行图像处理和分类,确定了上海市中心城区、郊区、农村以及水域等典型地物类型,并进一步计算出了每类地物的表面温度和温度统计特征。
其次,通过计算每类地物表面温度的平均值、标准差和梯度等统计参数,建立了城市热岛效应的空间分布模型,并探究了城市热岛效应和城市化进程、气候因素等因素之间的关系。
本文的实验结果表明,上海市中心城区表现出更为明显的热岛效应,平均表面温度高于周围农村区域约1-2摄氏度,且温度梯度较大。
此外,本文还发现城市规划的不合理性和城市化进程加剧了城市热岛效应的形成和蔓延。
最后,针对上海市的实际情况,本文提出了相应的环境保护建议,包括加强对城市绿化和水资源保护的重视,优化城市规划设计,减少建筑热损失等。
总之,利用HJ-1B星热红外遥感图像能够有效地研究城市热岛效应,探讨城市化进程和环境问题之间的相互影响。
通过本文的研究,为城市规划及环境保护提出了一些有益的建议。
除了以上所述的研究,利用HJ-1B星热红外遥感图像还可以深入探讨城市热岛效应和城市内部的人口和经济活动之间的关系。
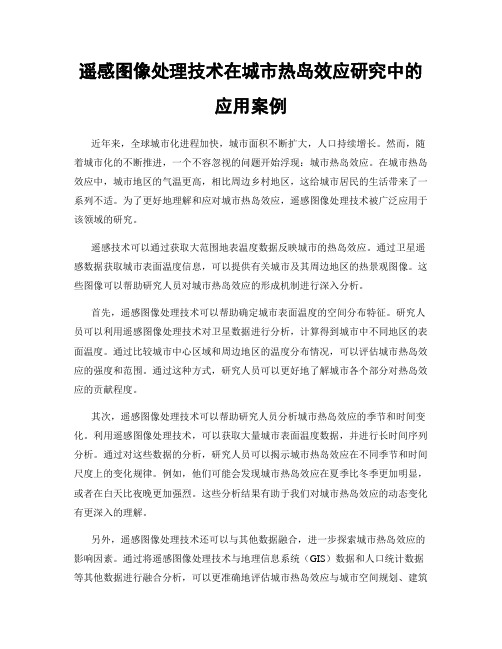
沈阳城区热岛效应遥感信息提取与分析

沈阳城区热岛效应遥感信息提取与分析摘要:城市热岛效应是城市气温高于四周郊区的温差现象,能对环境生态系统和人类活动产生重大影响。
近年来以遥感、地理信息系统和全球定位系统(3s)为代表的空间信息技术,因其具有传统方法所不可比拟的宏观性、多波段性及多时相性等优点,而被广泛应用于城市热岛的研究,并成为环境科学的一个新热点。
本文利用遥感监测技术对不同年代沈阳城区热岛的空间分布特征进行分析。
选用1989年、2002年、2006年、2007年4个年份的美国陆地卫星数据,主要利用erdas软件实现图像处理、建模、计算和分析。
研究结果表明,1989年到2007年沈阳市植被覆盖有所上升,与之相对应的地区地表温度较低。
热岛现象多分布在植被覆盖较少地区,其中沈阳市大东区、沈河区、皇姑区、和平区和铁西区均存在不同程度的热岛效应。
由此可针对不同地区提出相应的热岛效应缓解策略。
关键词:遥感技术;城市热岛效应;地表亮温;植被覆盖指数(ndvi)abstract: urban heat island effect is a temperature phenomena that city temperature is higher than surrounding suburbs temperature. it can seriously affect environmental and ecological systems and human activities. in recent years, spatial information technology represented by remote sensing, geographic information system and global positioning system(called 3s).itis widely used on the study of urban heat island and becoming a new hot spot of environmental science, because it is broader and has more multi-band and temporal nature than traditional methods. satellite images from landsat system for four dates in 1989, 2002, 2006 and 2007 were used to analyze the spatial distribution characteristics over shenyang city. the image datas were mainly processed by software of erdas imagine in this study.the results show that the vegetation cover increasing in shenyang 1989 to 2007, corresponding to the region the surface temperature is lower. heat island phenomenon scattered in the areas with less vegetation cover. dadong district, shenhe district, huanggu district, heping district and the district of west in shenyang have different degrees of heat island effect. therefore we can propose appropriate tactics to help relieve heat island effect for different regions. keywords: remote sensing technology; urban heat island effect; surface brightness temperature; ndvi中图分类号:tp7 献标识码:文章编号:2095-2104(2013)1-0020-02由于城市化的速度加快,城市建筑群密集、柏油路和水泥路面比郊区的土壤、植被具有更大的热容量和吸热率,使得城区储存了较多的热量,并向四周和大气中幅射,造成了同一时间城区气温普遍高于周围的郊区气温,高温的城区处于低温的郊区包围之中,如同汪洋大海中的岛屿,人们把这种现象称之为城市热岛效应[1]。
遥感技术在城市热岛效应研究中的应用
遥感技术在城市热岛效应研究中的应用随着城市化进程的加速,城市热岛效应愈发严重。
城市热岛效应指的是城市区域温度高于周边非城市区域的现象。
这种现象会导致能量和水分的消耗,使城市环境质量恶化,造成一系列的气候、环境和健康问题。
为了有效地解决城市热岛效应问题,研究人员一直在探索更好地方式和方法。
在这个过程中,遥感技术得到广泛应用,成为了城市热岛效应研究中的重要工具。
一、遥感技术的基本原理遥感技术指的是通过对地球表面进行遥感观测,获取地面信息的一种技术。
它利用定量遥感图像处理方法和地面参考数据,在大范围尺度上对地球表面的形态、结构、属性和变化进行定量测量和分析,从而获取地面信息。
遥感技术的基本原理是:通过不同波段的光电信息,获取地球表面不同特征的信息。
不同波段的光电信息反映了地表上不同的物质组成和状态,包括地表覆盖类型、地形高度、植被状况、水文地质条件、气象环境条件等要素。
利用这些信息,可以进行逐时、逐日、逐季和逐年的遥感监测和分析,帮助我们更好地理解和管理地球表面。
二、遥感技术在城市热岛效应研究中的应用1. 地表温度反演地表温度是城市热岛效应的重要指标。
利用遥感技术可以获取大范围地表温度分布,并进一步探究城市热岛效应的形成和发展规律。
研究者可以通过遥感技术获取高分辨率的热红外图像,结合气象数据分析地表温度的时空变化规律,高精度地捕捉城市热岛效应的热源和空间分布规律。
2. 建筑物热效应分析由于建筑物的高度、密度等因素,会对周围区域的微气候产生影响。
因此,建筑物热效应分析是城市热岛效应研究中的重要内容。
通过遥感技术获取高精度的建筑物高度和密度等信息,并结合地表温度、植被等多种要素,可以全面解析建筑物的热效应,为城市热岛效应的研究提供更加丰富的数据支持。
3. 植被覆盖分析植被覆盖与城市热岛效应密切相关。
通过遥感技术获取高精度的植被分布数据,可以更好地分析植被对城市热岛效应的影响。
研究表明,城市中绿化覆盖率高的区域明显低于周边非城市区域的温度,有效缓解了城市热岛效应的发展。
如何使用遥感数据进行热岛效应分析
如何使用遥感数据进行热岛效应分析遥感数据在当今社会发挥着越来越重要的作用,尤其在城市规划和环境保护方面,可以提供大量的热岛效应分析所需的信息。
热岛效应是指城市的热量积累和辐射不平衡现象,导致城市气温明显高于周边农田和郊区的现象。
本文将介绍如何使用遥感数据进行热岛效应分析的方法和步骤。
首先,进行热岛效应分析需要获取城市及周边地区的热红外遥感影像。
热红外影像可以直观地显示出地表的温度分布情况,是研究热岛效应的重要数据源。
通过使用无人机、卫星或其他遥感平台获取全面、高分辨率的热红外影像,可以提供详细的地表温度信息,进而分析城市热岛效应的空间分布和演变趋势。
其次,对获取的热红外影像进行预处理是热岛效应分析的关键一步。
预处理包括影像校正、大气校正和地表辐射亮温计算等。
影像校正是为了消除影像之间的几何和辐射差异,使得不同时间、不同影像的地表温度具有可比性。
大气校正是为了消除大气层对热红外辐射的吸收和散射影响,得到地表辐射亮温。
地表辐射亮温是地物表面辐射的一种物理量,它与地表温度之间存在一定的对应关系。
然后,进行热岛效应分析的核心内容是地表温度提取和分析。
地表温度提取可以通过遥感影像的数字图像处理和空间分析技术实现。
常用的方法包括阈值分割、光谱指数和机器学习等。
阈值分割是基于图像亮度分布的方法,通过设置适当的阈值将热红外影像分为不同的温度区域。
光谱指数是利用热红外波段和其他波段的比值关系来推测地表温度。
机器学习是一种将已知地表温度和遥感影像特征建立映射关系的统计模型方法。
最后,对提取的地表温度进行空间分析和统计分析,揭示城市热岛效应的特征和机理。
空间分析包括热岛效应的空间分布、规模和影响范围等。
统计分析包括热岛效应的时空变化趋势、关联因素和影响因素等。
通过空间分析和统计分析,可以深入了解城市热岛效应的形成机制和影响因素,为城市规划和环境保护提供科学依据。
综上所述,使用遥感数据进行热岛效应分析需要获取热红外影像,进行预处理,提取地表温度并进行分析。
西安市城市热岛效应卫星遥感分析

监 督 分 类 法 对 西 安 市 影 像 进 行 土 地 利 用 / 盖 变 化 分 类 ;在 此 基 础 上 对 西 安 市 城 市 热 岛 的 空 间 分 覆 布 特 征 及 城 市 热 岛 与 土 地 利 用 / 盖 变 化 的关 系 进 行 研 究 。 果 表 明 : 安 市 城 区地 表 温度 明 显 比 覆 结 西 郊 区地 表 温 度 高 ,由市 中心 向外 呈 现地 表 温 度 逐 渐 降 低 的趋 势 。城 市 地 表 温 度 与 土地 利用 类 型 密 切 相关 ,不 同地 表 覆 盖 类 型 的地 表 温 度 差 异 显 著 ,城 市 用 地 和 裸 地 是 城 市 热 岛强 度 的 主要 贡 献 因 素 ,水 体 和 林 地 具 有 较 好 的 降 温 作 用 。 关 键 词 :L n st T a da M ;城 市 热 岛 ;土 地 利 用 / 盖 变 化 ;亮 度 温 度 E 覆
一 0 0 7 0 8 8 + 3 2, . 3 5 D . () 1
4 结 果 与 分 析
4 1 西安 市城 市热 岛空 间分布 特征 .
由图 1可 以看 出 ,西安市 城 区亮 度 温度 明显
其 次 把辐 射亮 度值转 化为亮 度 温度
T—K2 (n ( l + 1 ) / I / )。 () 2
3 亮 温 反 演 及 土 地 利 用 / 盖 的 关 系 研 究 覆 3 1 亮 温反 演 .
计算得 到 西安市 夏 季城 区亮 温分 布结果 ( 见
图 1。 )
TM/ T E M 的 热 红 外 波 段 接 收 的 是 与地 表
如何使用遥感数据进行热岛效应分析
如何使用遥感数据进行热岛效应分析热岛效应(Urban Heat Island, UHI)是指城市地区比周围农田或森林等自然环境温度更高的现象。
随着城市化进程的加速,热岛效应正逐渐成为影响城市气候与生态环境的重要问题。
为了深入了解和分析热岛效应,遥感数据成为一种非常有效的工具。
遥感数据是利用卫星、飞机等遥感平台获取的地球表面以及大气层的数据,其中包括热红外遥感数据。
热红外遥感数据可以通过测量地表温度来反映热岛效应的分布和强度。
因此,利用热红外遥感数据进行热岛效应分析具有重要的意义。
首先,我们可以利用遥感数据获取城市地区的热红外信息。
通过遥感仪器,我们可以获取城市地区不同位置的地表温度数据。
这些数据可以反映出城市内部不同区域的热环境差异。
例如,可以通过测量高楼大厦和绿地的地表温度,对比它们之间的差异,从而揭示城市的热岛效应分布。
其次,我们可以利用遥感数据对热岛效应进行空间分析。
遥感数据可以提供大范围地表温度数据,通过对这些数据进行空间分析,可以直观地看出城市中心和城市边缘的温度差异。
此外,还可以利用遥感数据构建城市地区的温度分布图,揭示热岛效应的空间特征和分布规律。
此外,遥感数据还可以提供时间序列的热岛效应变化信息。
通过不同时间获取的遥感数据,我们可以观察到热岛效应在不同季节、不同时段的变化情况。
例如,可以通过对比白天和夜晚的地表温度,分析城市的日变化和季节变化。
这些变化信息对深入研究热岛效应的形成机理、影响因素以及城市规划与设计具有重要的参考意义。
另外,结合地理信息系统(Geographic Information System, GIS)技术,我们还可以将遥感数据与其他环境数据进行叠加分析,深入研究热岛效应的影响因素。
例如,可以将遥感获取的地表温度数据与城市的土地利用数据相结合,探讨不同土地利用类型对热岛效应的影响。
还可以将遥感数据与气象数据相结合,分析气象条件对热岛效应的影响。
这种综合分析可以更加全面地了解热岛效应的形成和演变机制。
遥感技术在城市热岛效应监测中的应用
遥感技术在城市热岛效应监测中的应用随着城市化进程的加快,城市面积日益扩大,同时城市发展和人类活动也在不断增加,这导致城市环境问题日益严重,其中城市热岛效应影响最为显著。
城市热岛效应是指城市区域与周边农村或自然环境相比,温度普遍较高,尤其是城市中心地带的温度更高,从而产生的一系列环境问题。
以北京为例,热岛效应时常出现,导致城市热浪和大气污染等严重问题。
为了有效控制城市热岛效应,必须对城市热环境进行监测。
遥感技术是一种非常有效的城市热岛效应监测手段,也是应对城市环境问题的重要工具。
那么,遥感技术在城市热岛效应监测中的应用是怎样的呢?一、遥感技术提供了高分辨率的监测图像遥感技术利用卫星和无人机拍摄的遥感图像,可以提供高分辨率、高空间分辨力和时间序列的数据,从而全面、持续地监测城市环境变化。
通过对遥感图像的处理,可以获取城市热岛效应在空间、时间分布和强度方面的多个参数,如地表温度、表面覆盖和建筑密度等。
这样,在热岛空间范围、热岛强度、温度分布等方面都能够更清晰的反映出城市热岛现象的变化趋势。
二、遥感技术可以监测城市地表温度城市地表温度是反映城市热岛效应最为重要的参数之一,也是遥感监测的重要内容。
卫星和无人机遥感技术能够获取城市地表温度信息,通过不同模型对地表温度进行分析,同时还可以检测出不同地区地表温度的变化情况。
这样,就可以及时监测城市热岛效应的变化趋势和程度,为政府和专家提供科学诊断和分析,制定科学合理的控制措施,进一步保护城市生态环境。
三、遥感技术有助于监测城市绿化覆盖率绿化是缓解城市热岛效应的重要手段,越来越多的城市正在大力发展城市绿化工程,因此对城市绿化覆盖率的监测越来越重视。
利用遥感技术可以高效监测城市绿化覆盖率,在大规模区域的监测中更加优势突出。
不同的遥感数据源(比如Landsat、GF等)都有各自的算法,并配合不同采光几何角度和时空分辨率的处理方法,可以获取不同精度与空间尺度下的城市绿化覆盖度数据。
遥感图像处理技术在城市热岛效应研究中的应用案例
遥感图像处理技术在城市热岛效应研究中的应用案例近年来,全球城市化进程加快,城市面积不断扩大,人口持续增长。
然而,随着城市化的不断推进,一个不容忽视的问题开始浮现:城市热岛效应。
在城市热岛效应中,城市地区的气温更高,相比周边乡村地区,这给城市居民的生活带来了一系列不适。
为了更好地理解和应对城市热岛效应,遥感图像处理技术被广泛应用于该领域的研究。
遥感技术可以通过获取大范围地表温度数据反映城市的热岛效应。
通过卫星遥感数据获取城市表面温度信息,可以提供有关城市及其周边地区的热景观图像。
这些图像可以帮助研究人员对城市热岛效应的形成机制进行深入分析。
首先,遥感图像处理技术可以帮助确定城市表面温度的空间分布特征。
研究人员可以利用遥感图像处理技术对卫星数据进行分析,计算得到城市中不同地区的表面温度。
通过比较城市中心区域和周边地区的温度分布情况,可以评估城市热岛效应的强度和范围。
通过这种方式,研究人员可以更好地了解城市各个部分对热岛效应的贡献程度。
其次,遥感图像处理技术可以帮助研究人员分析城市热岛效应的季节和时间变化。
利用遥感图像处理技术,可以获取大量城市表面温度数据,并进行长时间序列分析。
通过对这些数据的分析,研究人员可以揭示城市热岛效应在不同季节和时间尺度上的变化规律。
例如,他们可能会发现城市热岛效应在夏季比冬季更加明显,或者在白天比夜晚更加强烈。
这些分析结果有助于我们对城市热岛效应的动态变化有更深入的理解。
另外,遥感图像处理技术还可以与其他数据融合,进一步探索城市热岛效应的影响因素。
通过将遥感图像处理技术与地理信息系统(GIS)数据和人口统计数据等其他数据进行融合分析,可以更准确地评估城市热岛效应与城市空间规划、建筑类型和人口密度等因素的关联性。
这样一来,我们可以更好地理解城市热岛效应的形成机制,并提出有效的应对策略。
除了以上的应用案例,遥感图像处理技术还可以在城市热岛效应研究中发挥更多的作用。
例如,可以利用高分辨率遥感图像,对城市建筑物和植被类型进行分类,进一步探究它们与城市热岛效应之间的关系。
- 1、下载文档前请自行甄别文档内容的完整性,平台不提供额外的编辑、内容补充、找答案等附加服务。
- 2、"仅部分预览"的文档,不可在线预览部分如存在完整性等问题,可反馈申请退款(可完整预览的文档不适用该条件!)。
- 3、如文档侵犯您的权益,请联系客服反馈,我们会尽快为您处理(人工客服工作时间:9:00-18:30)。
An Assessment of Urban Heat Island Effect using RemoteSensing DataWANG Guiling1, JIANG Weimei2, WEI Ming31. Institute of Meteorology, PLAUST, Nanjing 211101, Jiangsu, China;2. Department of Atmospheric Sciences, Nanjing University, Nanjing 210093, Jiangsu, China;3. Sino-American Cooperative Remote Sensing Center, NUIST, Nanjing 210044, Jiangsu, China Abstract: Characteristics of urban heat island (UHI) effect and its cause are investigated by using MODIS data in April 2004. Surface parameters from the MODIS data have surface temperature (ts),albedo(α), and normalized difference vegetation index (NDVI). Their heterogeneities over urban and rural area are analyzed based on land cover classification, and their relations are also presented in order to explain the UHI effect. The results show that there exists obvious the UHI effect. Ts over urban areas are by 10.83 % higher than those over rural area,and NDVI and α over urban area are by 62 % and 18.75 % less than those over rural area, respectively. Surface temperature has significantly negative correlation with NDVI and their correlation coefficient is-0.73. Correlation between NDVI and albedo is determined by the spectrum of light. Difference in vegetation cover is the primary cause of the UHI effect.Keywords: remote sensing; MODIS; urban heat island; surface temperature; NDVI; albedo IntroductionUrban development usually gives rise to a dramatic change of the Earth’s surface, as natural vegetation is removed and replaced by non-evaporating and non-transpiring surfaces such as metal, asphalt, and concrete. This alteration inevitably results in the redistribution of incoming solar radiation, and induces the urban-rural contrast in surface radiance and air temperatures. The difference in ambient air temperature between an urban area and its surrounding rural area is known as the effect of UHI. It is a meteorological phenomenon developing with the growth of urbanized areas, are increasingly affecting citizen’s lives and health. The study will help us to better understand the UHI aspects and its causes, providing an important addition to conventional methods of monitoring the urban environment. It is important to urban expand and layout in order to lessen the UHI.Studies on UHI phenomenon using satellite remote sensing data have been conducted for more than ten years. The methods are included the following types. Firstly, UHI actuality and its dynamic change are analyzed using long term meteorological record over urban andsuburban area. Secondly, the causes of UHI characteristics are explained by the remote sensing or aerial photos. Thirdly, the numerical model is used to simulate the UHI effect. Fourthly, some stations are set to measure UHI. The recent increasing availability of remote sensing technique is an efficient way to survey UHI periodically for long time. Roth (1989) and Gallo (1993) used remote sensing techniques to compare the UHI effect to vegetation index [1,2].Owen(1998) used fractional vegetation cover and surface moisture availability to study the impact of urbanization in and around State College, PA [3]. Streutker (2003) analyzed the growth of UHI and successfully quantified the UHI of Houston, TX taken 12 years apart [4]. All the above studies used National Oceanic and Atmospheric Administration (NOAA) AVHRR data. The 1.1 km spatial resolution of these data was found suitable for the surface temperature mapping over urban area and used to study the surface UHI. UHI has been also studied with more fine resolution satellite data such as Landsat TM, SPOT in many cities such as the Zhujiang Delta in China, Lόdź in Poland, Granada in Spain over the past few years. But such remote sensing data have low temporal resolution and a shorter data record [5-8].MODIS is a key instrument aboard the Terra (EOS AM) and Aqua (EOS PM) satellites. Terra MODIS and Aqua MODIS are viewing the entire Earth's surface every 1 to 2 days, acquiring data in 36 spectral bands. These data will improve our understanding of global dynamics and processes occurring on the land, in the oceans, and in the lower atmosphere. MODIS is playing a vital role in the development of validated, global, interactive Earth system models able to predict global change accurately enough to assist policy makers in making sound decisions concerning the protection of our environment. Most recent researches were about the regional or global scale climatic and environmental changes and seldom on the UHI using MODIS data [9-13].Surface temperatures derived from satellite are believed to correspond more closely with the canopy layer heat island, although a precise transfer function between the surface temperature and the near ground air temperature is not yet available. Satellite information is the only source for determing of the surface temperature (ts) at macro level over a region. In this study, we use the MODIS and other supplementary data to study the characteristics of the UHI and its causes.Longitude/ 0EFig.1 Land cover classification from MODIS in 2004 and locations of automatic weather stationMODIS data are pretreated firstly by the method of overlapped mobile window in Geo-statistics to eliminate abnormal values due to cloud [14,15]. MODIS land surface temperature products are compared with monthly mean ts from seven Automatic Weather Stations (AWSs) to validate them. Then, the parameters in three broadbands (0.3 - 0.7 μm, 0.7 - 5.0 μm, and 0.3 - 5.0 μm) are used to compute the surface albedos in the broadbands with BRDF model. Finally, the difference and correlation analysis of ts, NDVI and albedos between the urban and rural area are performed depending on land use pattern. The urban heat island in the study area is synthetically analyzed by comparing the distribution of ts, NDVI and albedos over urban areas and non-urban areas.1 Study areaThe study area considered in this paper encompasses an area of 83 × 83 km2 centered at coordinates 118.8ºE, 32.0ºN (Nanjing, China). This area includes Nanjing urban area and its suburban counties. Most of the terrain heights are very low in the region and mountainsare distributed mainly in the east and southwest areas.The study area is very heterogeneous, comprising of water, cropland, and forest as well as urban and built-up. Fig. 1 shows the land cover classification map in study area (2004) and the locations of seven AWSs. From Fig. 1 it is easily seen that the Yangtze River runs across the urban zone, and the Xuanwu Lake and the Purple Mountains locate in the central part of the area, with large green cover of semi-natural forest. A transect crossing the centre of the area (AB) is chosen from west to east.2 Data set description2.1 Satellite remote sensing dataSatellite remote sensing has potential utility for this landscape scale characteristic analysis because of the global continuity of observation. Here we choose MODIS satellite data. A series of high-level land surface products have been generated by the MODIS land science team, which are all operational and can be downloaded from the following web site: /pub/imswelcome/.Tab.1 Selected MODIS products of 2004 and their spatial and temporal resolutionsThe selected products are listed in Tab.1. ESDT is the short name for Earth science data type. DOY means Julian day of the year. Temporally, these data cover April 2004 (spring season). We have included MODIS data from the period March 21th (DOY 81) to May 8th (DOY 121). The time period covers 40 days (five 8-day periods and three 16-day periods). The 96-day land cover product included here does not specifically overlap with the spring season. The product “MOD11A2” in the MODIS Land Discipline is defined as the “land surface temperature (LST)” over the gl obal land surface every 8 days with 1 km-resolution. Other products used include the land cover product “MOD12Q1” and NDVI product“MOD13A2”.The accuracy specification for MODIS LST is 1K at 1 km resolution under the clear sky conditions. It can be validated by field measurements over flat uniform land surfaces. The accuracy specification for land-surface emissivity retrieved from MODIS data is 0.02 forbands 29, 31 and 32, and 0.05 for bands 20,22, and 23. The MOD13A2 are standard products designed to be fully operational at launch. The MOD12Q1 product provides a suite of land covers with the primary classification in the IGBP (International Geosphere Biosphere Programme) scheme. Each of these classification schemes is accompanied by the assessments of its quality or confidence. More information about the MODIS products can be found from the web site /data.All data are in HDF (Hierarchical Data Format) format and are provided in ISG (an Integerized Sinusoidal Grid) projection. While the projection becomes increasingly sheared with distance from the Greenwich meridian, the data are converted to Lambert conformal projection and the format from original HDF to a flat binary format by the MODIS Reprojection Tool (MRT v2.4 Beta).。