英语四级图表作文专题讲解
英语四级的写作部分常见题型
英语四级的写作部分常见题型一、图表作文图表作文是四级写作中常见的题型之一,要求根据所给的图表信息,进行描述和分析。
下面是一种常见的图表作文格式:1. 引言句:描述图表主题,可以简单介绍图表的来源和背景。
2. 主体段落:根据图表的变化趋势和数据特点进行详细描述,可以使用时间顺序或对比方式。
3. 结论段:总结图表信息和数据趋势,可以提出个人观点或预测未来发展。
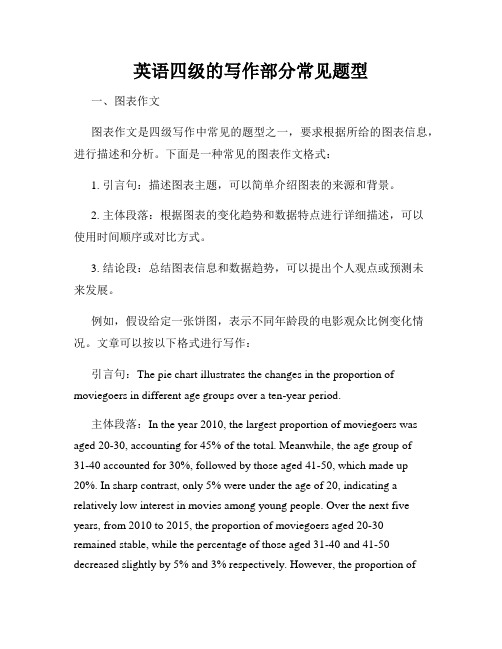
例如,假设给定一张饼图,表示不同年龄段的电影观众比例变化情况。
文章可以按以下格式进行写作:引言句:The pie chart illustrates the changes in the proportion of moviegoers in different age groups over a ten-year period.主体段落:In the year 2010, the largest proportion of moviegoers was aged 20-30, accounting for 45% of the total. Meanwhile, the age group of31-40 accounted for 30%, followed by those aged 41-50, which made up 20%. In sharp contrast, only 5% were under the age of 20, indicating a relatively low interest in movies among young people. Over the next five years, from 2010 to 2015, the proportion of moviegoers aged 20-30 remained stable, while the percentage of those aged 31-40 and 41-50 decreased slightly by 5% and 3% respectively. However, the proportion ofmoviegoers under the age of 20 witnessed a significant rise, reaching 15%. This trend continued until 2020, with the percentages standing at 40% forthe 20-30 age group, 25% for the 31-40 age group, 15% for the 41-50 age group, and 20% for the under 20 age group.结论段:From the analysis above, it can be concluded that the proportion of moviegoers in different age groups has undergone significant changes over the past ten years. Younger people are now showing more interest in movies compared to the past, while the middle-aged population is gradually losing interest. This trend is likely to continue in the future as the younger generation grows up and becomes the main consumer group of the film industry.二、观点对比观点对比是另一种常见的四级写作题型,要求阐述不同的观点,并对其进行分析和比较。
英语专业四级写作备考四-图表作文
易犯错误&解决方法
盲目地把图表中所有数据都描写出来,不管是否和主题有 关。
解决方法:可以在描写和引用数字前,先把这些数据要反 映的问题用一句话写出来。这样就把数据看成是一种用来 说明问题的具体数据材料 (statistical evidence) 。选用的数 据必须和论述有关。
例2
Rising Divorce Rates in China
12%
58%
30%
1992
1
2
3
上图1、2 、3分别表示: 1:Graduates who continue to study 2:Graduates who take jobs irrelevant to their majors 3:Graduates who hold jobs in their majors
1. The rapid growth of divorce rates from 1987 to 1992 results from two obvious facts. The new marriage law simplifies the procedures of divorce. Besides, the improvement of women social status makes divorce a common thing.
2023最新整理收集 do something
Writing a Composition According
to Tables and Graphs
By Lara
Table of Contents
图表作文和一般作文的区别 看懂图表要领(1) 看懂图表要领(2) 图一、图二分析
易犯错误&解决方法 常用数字表达法 Basic Writing Structure etc. More Exercises
四级作文之图表作文

•
Obviously computers are becoming more and more popular. There are several reasons for this. First, computers facilitate us in more aspects of life. Also, the fast development of the Internet enlarges our demands for using computers. We can easily contact friends in remote places through the Internet. Besides, the prices of computers are getting lower and lower, which enables more students to purchase them.
• 3. It has gone up/ grown/ fallen/ dropped considerably/ remained the same in recent years. • 4. As shown in the graph, ____ rose abruptly/ gradually… • 5. As has been stated… • 6. The chart/ bar/ pie/ figure shows/ summarizes/ presents a striking/ remarkable/ difference among/ between…
专四图表作文模板

专四图表作文模板英文回答:The chart illustrates the changes in the number of students attending university in three different countries over a period of ten years, from 2010 to 2020. As can be seen from the graph, the number of students in China has significantly increased, while the number of students inthe United States and the United Kingdom has remained relatively stable.In 2010, the number of students in China was around 25 million, which was significantly lower than the number of students in the United States and the United Kingdom, which were around 30 million and 20 million respectively. However, over the next ten years, the number of students in China increased rapidly, reaching over 40 million in 2020. In contrast, the number of students in the United States and the United Kingdom only increased slightly, with the United States reaching around 32 million and the United Kingdomreaching around 22 million in 2020.There are several reasons for this trend. Firstly,China has experienced rapid economic growth over the past decade, which has led to an increase in the number of families who can afford to send their children to university. Secondly, the Chinese government has invested heavily in education, with the aim of producing more highly skilled graduates who can contribute to the country's economic development. Finally, the popularity of online education has also contributed to the increase in the number of students in China.中文回答:这张图表展示了三个不同国家在2010年至2020年期间大学生人数的变化情况。
四级英语写作应用文写作(图表-漫画)公开课获奖课件百校联赛一等奖课件

2) 描述详细数据变化
•
increase/decrease by...
•
increase from ... to...
•
increase steadily from...
•
There was a marked increase
in ...
•
There has been a rapid
increase in ...
hand, ...On the other hand, ...
•
The rapid growth of ... owes much to...
•
lie in
• (2) In recent years, the time students using computers has increased greatly. (2023.6 CET-4)
• 第二段分析引起变化旳原因,主题句一般表达引起这种变化旳 原因有几点.例如:
•
(1) There are many factors that have stimulated this huge
place in ...
•
From the above table it can be seen that...
•
As it is shown in the table,...
•
According to the graph, ...
•
It is clear from the table that ...
increased 4%.
•
总之,挑选有说服力旳数据,主要是首尾两端数字或其增减值.
3. 强调数据间旳关系,突出变化
• 发觉数据旳变化规律,引用了经典数据,还须进一 步强调突出这种变化,使论证更有力.以 "Student Use of Computer"为例,有学生写到:But in 2023, students spent nearly 20 hours per week on the computer. This number was ten times that of 1990 and five times that of 1995. 像这么用倍数或百分 比更能阐明问题,给人留下深刻印象.
四级考试图表作文写作技巧

饼状图
特点
用于展示整体中各部分的占比关系。
重点
关注各部分占比大小和变化,以及占比与整体的关系。
分析
比较不同时间段或不同群体之间的占比差异,探究占 比变化的原因和影响。
表格
特点
用于展示多维度数据,包括数值和文字信息。
重点
关注数据的全面性和细节,注意数据的准确 性和可信度。
分析
对表格中的数据进行分类、筛选、计算和对 比,挖掘数据背后的信息和意义。
03
特点
用于比较不同类别之间的 数找 出最大值、最小值和变化 趋势。
分析
比较不同时间段或不同群 体之间的数据,探究数据 背后的原因和影响。
折线图
特点
01
用于展示数据随时间变化的趋势。
重点
02
关注数据变化的规律和趋势,以及峰值和谷值出现的时间点。
分析
03
探究数据变化的内在原因,预测未来趋势,并给出相应建议。
05 实例分析
优秀范文展示
文章结构清晰
优秀范文通常具有明确的文章结 构,包括开头、主体和结尾,层 次分明,逻辑性强。
语言准确流畅
范文的语言表达准确,语法和拼 写错误较少,同时流畅自然,易 于阅读。
图表描述细致
范文能够准确描述图表中的信息, 对数据和趋势进行恰当的分析和 解释。
学生常见错误分析
文章结构混乱
描述图表内容
01
按照题目要求,准确描述图表中的数据和信息,注意使用合 适的单位和表述方式。
02
突出图表中的关键信息和趋势,并解释其含义和影响。
03
可以适当进行图表数据的分析和比较,以支持文章观点。
总结与启示
总结图表所反映的问题或趋势,以及 可能的原因和影响。
英语四级作文分项讲解-图表作文.docx

大学英语四级写作专项精讲常用的句型开头Recently, the problem of •…has aroused people's concern・最近,…问题已引起人们的关注.Nowadays, ________ has become a problem we have to face.如今,已成为我们不得不面对的问题了.It is commonly believed that... / It is a common belief that...人们一般认为…Many people insist that.・•很多人坚持认为…With the development of science and tech no logy, more and more people believe that...随着科技的发展,越来越多的人认为…A lot of people seem to think that...很多人似乎认为…引出不同观点:Peopled views on.・・ vary from person to person. Some hold that.…・ However,others believe that... •人们对…的观点因人而异•有些人认为..…然而其他人却认为.・.People may have different opinions on...人们对…可能会有不同的见解.Attitudes towards ____ vary from person to person.人们对待….的态度因人而异.There are different opinions among people as to...关于.…人们的观点大不相同.Different people hold different attitudes toward ____ .对..…人们的态度各不相同.结尾Taking all these factors into consideration, we naturally come to the conclusion that...把所有这些因素加以考虑,我们自然会得11!结论…Taking into account all these factors, we may reasonably come to the conclusion that… 考虑所有这些因素,我们可能会得ns合理的结论…Hence/Therefore, we'd better come to the conclusion that...因此,我们最好得出这样的结论…There is no doubt that ____ has its drawbacks as well as merits.毫无疑问,.....有优点也有缺点.All in all, we cannot live without... But at the same time we must try to find out new ways to cope with the problems that would arise.总之,我们没有…是无法生活的•但同时,我们必须寻求新的解决办法来对付可能出现的新问题.提出建议:It is high time that we put an end to the (trend).该是我们停止这一趋势的时候了.It is time to take the advice of •…and to put special emphasis on the improvement of... 该是采纳…的建议,并对…的进展给予特殊重视的时候了.There is no doubt that enough concern must be paid to the problem of …毫无疑问,对…问题应予以足够的重视.Obviously, If we want to do something..., it is essential that...显然,如果我们想做某事,很重要的是…Only in this way can we...只有这样,我们才能…It must be realized that...我们必须意识到…预示后果:Obviously, if we don't control the problem, the chances are that... will lead us in dange匚很明显,如果我们不能控制这一问题,很有可能我们会陷入危险.No doubt, unless we take effective measures, it is very likely that…毫无疑问,除非我们采取有效措施,很可能会…It is urgent that immediate measures should be taken to stop the situation.很紧迫的是,应立即采取措施阻止这一事态的发展.论证:From my point of view, it is more reasonable to support the first opinion rather than the second ・在我看來,支持第一种观点比支持第二种观点更有道理.I cannot entirely agree with the idea that...我无法完全同意这一观点•…Personally, I am standing on the side of ...就个人而言,我站在…的一边.I sincerely believe that...我真诚地相信…In my opinion, it is more advisable to do ... than to do....在我个人看來,做…比做…更明智.Fin ally, to speak frankly, there is also a more practical reason why ・.・给出原因:This phenomenon exists for a number of reasons. First,.…Second, ... Third, •…这一现象的存在是有许多原因的.首先,…第二,…第三,…Why did... ? For one thing... For another.... Perhaps the primary reason is...为什么会…?一个原因是…令一个原因是… 或许其主要原因是.…I quite agree with the statement that... the reasons are chiefly as follows.我十分赞同这一论述,即…,其主要原因如下:列出解决办法:Here are some suggestions for handling...这是如何处理某事的一些建议.The best way to solve the troubles is...解决这些麻烦的最好办法是…People have figured out many ways to solve this problem.人们己找出许多办法来解决这个问题.批判错误观点和做法:As far as something is concerned, ....就某事而言,…It was obvious that._ 很显然,•…It may be true that..., but it doesn^t mean that…可能…是对的,但这并不意味着…It is natural to believe that... , but we shouldn^ ignore that...认为….是很白然的,但我们不应忽视.…There is no evidence to suggest that… 没有证据表明…阐释图表:As is shown in the graph...如图所示...The graph shows/suggests/indicates/illustrates that... 图表显示…As can be seen from the table,...从表格中可以看出…From the chart, we know that...从这张表中,我们可知…All these data clearly prove the fact that...所有这些数据明显证明这一事实,即…The increase of .... In the city has reached to 20% ....... 在这个城市的增长已达到20%.In 1985, the number remained the same. 1985 年,这个数字保持不变.There was a gradual decline in 1989. 1989 年,出现了逐渐下降的情况.五、各类作文结构四级作文主要涉及两个方面:一是与学生学习、生活相关的话题;二是与人们生活息息相关以及有关社会发展变化的热点话题。
2023年英语四级图表作文的类型及参考范文

您目前旳位置: 首页 > 英语四级 > 英语四级作文 > 英语四级作文综合辅导 > 正文英语四级图表作文旳类型及参照范文图表作文也是四(六)级考试中常见, 并且被认为是一种较难旳作文形式。
图表作文就是把非文字信息(一般为多种图表表达旳数字信息等)转换成文字信息旳一种作文。
它规定我们用文字来描述非文字性旳图表或对图表显示旳关系作解释阐明。
下面我们先来看一看图表作文旳类型。
第一节图表作文旳类型图表作文可分为两大类: 表作文和图作文。
表作文表格(Table)可以使大量数据系统化, 便于阅读、比较。
表格常由标题(Title)、表头(Boxhead)(表格旳第一行)、侧目(Stub)(表格左边旳第一列)和主体(Body)部分(表格旳其他部分)等部分构成。
如下表:用表格体现旳信息详细精确, 并且表格中旳各项均按一定规律排列。
阅读表格时要注意找出表格中各个项目旳互相关系, 表格中各个项目旳变化规律。
例如, 上面旳表格中旳数字阐明, 和1978年相比, 1983年大学入学旳人数在增长, 而小学旳入学人数在减少。
弄清晰这些变化规律也就读懂了表格旳内容。
图作文图作文又可分为三种: 圆形图作文、曲线图作文和条状图作文。
(1) 圆形图作文圆形图(Pie chart)也称为饼状图或圆面分割图。
圆形图由于比较形象和直观, 各部分空间大小差异轻易辨别, 因此常用来表达总量和各分量之间旳比例关系。
整个圆表达总量, 楔形块表达分量。
有时圆形图尚有数值表, 两者结合可把各分量表达得更精确、清晰。
例如:Thi.i..pi.char.o.th.averag.weekl.expenditur.o..famil.i.Grea.Britain.A.ca.b.se.fr o.th.chart.th.mai.expenditur.o.a.averag.Britis.famil.i.spen.o.food.whic.account. fo.25.o.it.tota.expenditure.Th.nex.tw.significan.expendin.item.ar.transpor.an.ho using.whic.ar.15.an.12.respectively.I.w.tak.int.accoun.clothin.an.footwear.whic. make.u.10%.th.fou.essential.o.life.tha.is.food.transport.housing.an.clothin.an.f ootwear.amoun.t.62.o.th.tota.expenditure.(2) 曲线图作文曲线图(Line graph)也称为线性图或坐标图。
- 1、下载文档前请自行甄别文档内容的完整性,平台不提供额外的编辑、内容补充、找答案等附加服务。
- 2、"仅部分预览"的文档,不可在线预览部分如存在完整性等问题,可反馈申请退款(可完整预览的文档不适用该条件!)。
- 3、如文档侵犯您的权益,请联系客服反馈,我们会尽快为您处理(人工客服工作时间:9:00-18:30)。
四级作文专题讲解(二)图表类作文一、图表作文的篇章结构写图表作文时,常采用三段式。
第一段:图表内容:描述图表+概述图表(特点)+数据支持(常取极端值)第二段:分析产生的原因第三段:展望未来,提出方法或建议二、图表作文常用表达法概述图表1. 正如图表中显示的As is indicated/ revealed/ showed in the (above) graph, ......Eg: 正如图表中显示的,中国人的饮食结构已经发生了明显的变化。
As is indicated in the above graph, dramatic changes have taken place in the diet of Chinese.2. 根据表格中给出的数据According to the figures given in the table, ......根据表格中给出的数据,网上购物正变得越来越流行。
According to the figures given in the table, online shopping is gaining more popularity/ is increasingly popular.3. 从统计数据我们可以看出It can be seen from the statistics that...从统计数据我们可以看出,世界人口正在持续稳定的大幅度增长。
It can be seen from the statistics that the world's population is growing steadily at a tremondous rate.具体描述图表数据1. From xx to xx, there is a rapid/dramatic/abrupt rise/ increase in ......从1997年到2002年,在计算机的使用方面有了快速/巨大/急剧的增加。
From 1997 to 2002, there is a rapid/dramatic/abrupt rise/increase in the use of the computers.2. During xx, xx has declined/ decreased/ fell/ dropped markedly.在过去的10年里,计算机的价格明显下降了。
During the past decade, the price of computers has declined/ decreased/ fell/ dropped markedly.3. By comparison with/ Compared withxx, this figure has increased from xx to xx. 与2年前相比,这一数字已经从不到150万增加到了将近340万。
By comparison with 2 years ago, this figure has increased from less than 1.5 million to nearly 3.4 million.表示数据上升:increase, rise, ascend, soar, climb up to xx下降: decrease, fall, drop, descend, decline, reduce波动: fluctuate, rise and fall占: occupy, take up, account for而: while, whereas , on the other hand相比: by contrast, on the contrary, compared with最高点: the highest, the top, the summit, the peak最低点: the bottom趋势: tendency, trend, inclination达到顶峰: mount to表示变化程度的词rapid/rapidly 迅速的,飞快的,险峻的dramatic/dramatically 戏剧性的,生动的significant/significantly 有意义的,重大的,重要的sharp/sharply 明显的,急剧的steady/steadily 稳固的,坚定不移的gradual/gradually 渐进的,逐渐的slight/slightly 轻微的、略微地stable/stably 稳定的三、图表作文训练练习一:Directions: For this part, you are allowed 30 minutes to write a composition on the topic Car Accidents Declining in Walton City. You should write at least 150 words following the ourline given below in Chinese:1. 描述图表中反映的车祸发生率的变化。
2. 分析该市车祸发生率下降的原因。
3. 你对该市今年车祸发生率走势的预测。
As is indicated in the above graph, the rate of car accidents in Walton City rises and falls with the change of months.From January to March, the number of car accidents rises from 22 to 32, and then drops to 26 in the next three months. After that, it climbs up again to 39, increasing by 50%. However, from then on, the curve descends all the way to the lowest point, 16 to be exact.练习二:Directions: For this part, you are allowed 30 minutes to write a composition on the topic How People Spend Their Holidays. You should write at least 120 words, and base your composition on the table and the outline given below:1、根据上表,简要描述1990年、1995年、2000年某城市人们度假方式的情况及其变化;2、请说明发生这些变化的原因;3、得出结论。
As is clearly shown in the table that there was a dramatic change in the way people spent their holidays between 1990 and 2000. Especially, in 1990, 63% of people spent their holidays at home, while the figure decreased considerably to 24% in 2000.图表类写作模版(1)模版1According to the chart / graph / diagram / table, we clearly learn that _________. As early as _________,___________. Then,_________. Last,__________. In contrast, by _________,__________.There are many reasons accounting for _________. Firstly,_________.Secondly,__________. Finally,_________. As a result,_________.As far as I am concerned,_________. For one thing,__________. Foranother,________. In brief, I hold that__________.(2)模版2What is shown in the chart / graph / diagram / table above indicates that in recent years, more and more people pay attention to _________. The number of those who _________ has increased ________, and furthermore,____________.There are two factors responsible for the changes. In the first place,_________. Moreover,__________. Yet, it is noticeable that __________.From the analysis, we can safely draw the conclusion that__________. It is possible that in the future, the tendency will__________.(3)模版3As is shown in the chart / graph / diagram / table above, __________ has charged drastically in the past _________. While ___________,now the percentageof__________ is __________. Meanwhile, the number of _________ has soared up to ________.There are mainly two possible reasons contributing to the rapid changes. The first is that _________. Secondly,__________.In my point of view, the changes have a great influence on _________. At the same time,_______. To sum up ,_________.2014年统考真题写作参考范文(描述图表)Shown in the bar chart is the unemployment rate in 2010 concerning different education levels. (概述图表)As indicated in the chart, the higher degree one gets,the less likely he loses his job, (数据描述)Only 1.9% doctors lost their jobs in 2010 while in sharp contrast, people with less than a high school diploma saw the highest unemployment rate, which mounted to as high as 14.9%.(取极点数据进行对比)(原因解释)The chart reveals explicitly how important and valuable education is. With evolution of our society, the significance of physical labor reduces as machines and even robots are increasingly applied in production. Thus, those who have less intellectual abilities to contribute are out of favor. By contrast, those who possess the knowledge of science, technology as well as management, etc. are less likely to be laid off because their work cannot be easily replaced at present.Though education is becoming more costly, think about the job market, and you will reach the conclusion that the high expenses of education is absolutely worth it.(点题)。