大学英语四级考试图表作文
四级英语图表作文
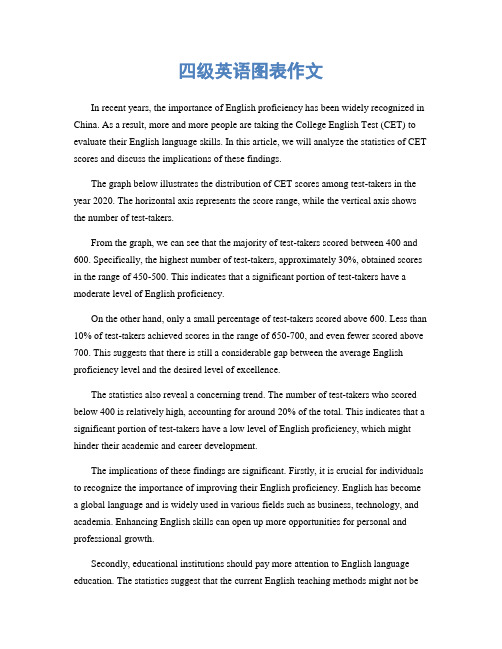
四级英语图表作文In recent years, the importance of English proficiency has been widely recognized in China. As a result, more and more people are taking the College English Test (CET) to evaluate their English language skills. In this article, we will analyze the statistics of CET scores and discuss the implications of these findings.The graph below illustrates the distribution of CET scores among test-takers in the year 2020. The horizontal axis represents the score range, while the vertical axis shows the number of test-takers.From the graph, we can see that the majority of test-takers scored between 400 and 600. Specifically, the highest number of test-takers, approximately 30%, obtained scores in the range of 450-500. This indicates that a significant portion of test-takers have a moderate level of English proficiency.On the other hand, only a small percentage of test-takers scored above 600. Less than 10% of test-takers achieved scores in the range of 650-700, and even fewer scored above 700. This suggests that there is still a considerable gap between the average English proficiency level and the desired level of excellence.The statistics also reveal a concerning trend. The number of test-takers who scored below 400 is relatively high, accounting for around 20% of the total. This indicates that a significant portion of test-takers have a low level of English proficiency, which might hinder their academic and career development.The implications of these findings are significant. Firstly, it is crucial for individuals to recognize the importance of improving their English proficiency. English has become a global language and is widely used in various fields such as business, technology, and academia. Enhancing English skills can open up more opportunities for personal and professional growth.Secondly, educational institutions should pay more attention to English language education. The statistics suggest that the current English teaching methods might not beeffective enough in improving students' language skills. Therefore, it is necessary to explore innovative teaching approaches, such as interactive language learning platforms and immersive language programs, to help students achieve better results in the CET.Furthermore, the government should invest more resources in promoting English education. English proficiency is closely related to a country's competitiveness in the global economy. By providing more funding and support to English language programs, the government can contribute to the overall improvement of English proficiency in the country.In conclusion, the statistics of CET scores in 2020 indicate that while a significant portion of test-takers have a moderate level of English proficiency, there is still room for improvement. It is crucial for individuals, educational institutions, and the government to work together in promoting English language education and enhancing English proficiency. Only by doing so can we meet the challenges of globalization and seize the opportunities it brings.。
历年四六级图画型作文
历年四六级图画型作文英文回答:A Picture is Worth a Thousand Words: Reflecting on Past CET-4 and CET-6 Picture Composition Prompts.Picture composition, a staple of the College English Test Band 4 (CET-4) and College English Test Band 6 (CET-6), invites test-takers to delve into the depths of their creativity and analytical thinking. The prompts, often rich in visual detail and open to multiple interpretations, demand a keen eye for observation and a nuanced understanding of the social, cultural, and political contexts that shape our world.Over the years, CET-4 and CET-6 picture composition prompts have showcased a diverse range of themes, from the poignant to the profound. In the 2000s, prompts focused on globalization and its impact on various aspects of life.For instance, one prompt depicted a group of peopleinteracting with technology in a futuristic setting, encouraging students to ponder the potential benefits and pitfalls of technological advancements.As the 2010s dawned, environmental concerns gained prominence in picture composition prompts. One prompt featured an image of a polluted river, challenging students to explore the consequences of human activities on the natural world. Another prompt depicted a group of individuals engaged in a beach cleanup, inspiring students to reflect on the importance of environmental stewardship.In recent years, picture composition prompts have continued to evolve, reflecting the ever-changing global landscape. Prompts have touched upon mental health, social justice, and the impact of social media on our lives. One particularly notable prompt featured an image of a young person surrounded by various electronic devices, inviting students to examine the interplay between technology and well-being.中文回答:一图千言,历年四六级图画作文回顾。
英语四级图表类作文万能模板【优秀3篇】

英语四级图表类作文万能模板【优秀3篇】(经典版)编制人:__________________审核人:__________________审批人:__________________编制单位:__________________编制时间:____年____月____日序言下载提示:该文档是本店铺精心编制而成的,希望大家下载后,能够帮助大家解决实际问题。
文档下载后可定制修改,请根据实际需要进行调整和使用,谢谢!并且,本店铺为大家提供各种类型的经典范文,如总结报告、合同协议、规章制度、条据文书、策划方案、心得体会、演讲致辞、教学资料、作文大全、其他范文等等,想了解不同范文格式和写法,敬请关注!Download tips: This document is carefully compiled by this editor. I hope that after you download it, it can help you solve practical problems. The document can be customized and modified after downloading, please adjust and use it according to actual needs, thank you!Moreover, our store provides various types of classic sample essays, such as summary reports, contract agreements, rules and regulations, doctrinal documents, planning plans, insights, speeches, teaching materials, complete essays, and other sample essays. If you want to learn about different sample formats and writing methods, please pay attention!英语四级图表类作文万能模板【优秀3篇】英语四级考试中作文是拉分差距较大的题型,如何让自己的作文更出彩?除了考前多练笔,根据模板进行仿写也是非常实用的方法,下面是本店铺整理的英语四级图表类作文万能模板【优秀3篇】,在大家参照的同时,也可以分享一下本店铺给您最好的朋友。
大学英语四级图表作文写作

01
Introduction
What is a chart essay
A chart essay is a type of writing task that requires students to analyze and interpret data presented in a chart, graph, or table
Form is a type of chart that uses tables or grids to present structured data It is often used to show detailed information about each data point, including numerical values and additional descriptors
03
Example: A line chart can be used to show the changes in temperature over a day, or the changes in a company's quarterly revenue over the years
Bar chart
Use chart language
When describing charts, chart language such as bar charts, line charts, pie charts, etc. should be used to clearly convey information.
• Improve communication skills: Writing clear and peer assessments about charts helps students improve their ability to communicate complex ideas and information effectively
大学英语四级图表作文

Graph Composition Pattern ( II )
说明图表概况 The graphs show us (1) ________________ ______________________________________. There are many reasons explaining this situation. As for me,I consider the followings 理由一 the important ones. Firstly, (2)____________ 理由二 ____________. Secondly, (3)______________ 理由三 _____________. In addition, (4)____________ ______________. Above all, we now know about the problem and we should try to find some ways to solve it.
Sample writing
F r o m t h e d i a g r a m i t c a n b e s a f el y concluded that Florida had developed much more rapidly than the U.S. as a whole. Thus, job opportunities were more plentiful and people specialized in manufacturing , hightechnology and other fields were more certain to achieve success in their careers in Florida than in any other state in the United States.
英语图表作文精选10篇

英语图表作文精选10篇四级英语作文图表类篇一图片模板:It seems to me that the cartoon / drawing issending a message about ____________(图画内容),which reveals ____________(稍作评价).In myperspective of view, ____________ (表明个人观点)。
Apparently, ____________(将个人观点和图片内容相结合,得出观点。
)For one thing, ____________(从社会角度论证).For another thing, ____________(从个人角度说明).For example, ____________(自己、朋友或他人,只要自己知道或听过的例子).Last but not least, ____________(从反面角度谈论).Asa result, the drawer of the illustration is urging us to _____________(建议或措施).Only inthis way can we ____________(展望结果).In conclusion / To my understanding, ____________(再次表明观点或态度).We should____________(进一步说明个人的观点).图表模板:According to the bar chart / pie chart / line graph displays the changes in the numberof____________(图表整体趋势).There was an increase in ____________(图表细节).At the point of ____________, ____________reaches its peak value of ____________(数据或变化).What has caused these changes? There are mainly three reasons.Firstly, ____________ (原因一).Secondly, ____________(原因二).The number of ____________ increased overthe period.____________ rose by _________ from ________ to ________________.Andthere were____________.Finally, ____________(最后一个原因).In conclusion / We can safely draw the conclusion that ____________(结论).Therefore, ____________(进一步谈论更多个人想法).英语四级图表类作文篇二In the morning, the clear sky, father-in-law of the sun was inlaid with a golden halo. A group of happy little magpies chirped in the branches, as if holding a singing contest, very lively!Noon is the hottest time of the day. The sun gave out a blazing light, as if to roast the earth. There was no one in the street. Everyone hid in the house to blow the air conditioner, for fear that they would be cooked outside. At this time, the little magpie on the tree also became quiet, they all hide in the deep leaves of the nap. Only the indefatigable cicada was still shouting “hot, hot.。
英语四级作文写作模板(图表类)

英语四级作文写作模板(图表类)英语四级作文写作模板(图表类)模版一As is shown in the chart / graph / diagram / table above, __________ has charged drastically in the past _________. While ___________,now the percentage of __________ is __________. Meanwhile, the number of _________ has soared up to ________.There are mainly two possible reasons contributing to the rapid changes. The first is that _________. Secondly,__________.In my point of view, the changes have a great influence on _________. At the same time,_______. To sum up ,_________.图表所示,__________急剧充电在过去的_________。
虽然___________,现在的百分比__________是__________。
同时,已经飙升了________,_________。
主要有两个原因可能造成的快速变化。
第一是_________。
其次,__________。
在我的`角度来看,在_________的变化有很大的影响。
在同一时间,_______。
综上所述,_________。
模版二What is shown in the chart / graph / diagram / table above indicates that in recent years, more and more people pay attention to _________. The number of those who _________ has increased ________, and furthermore,____________.There are two factors responsible for the changes. In the first place,_________.Moreover,__________. Yet, it is noticeable that __________. From the analysis, we can safely draw the conclusion that__________. It is possible that in the future, the tendency will__________.在上面图表所示,表示,近年来,越来越多的人注重_________。
图表类英语四级作文
图表类英语四级作文Title: The Impact of Social Media on Teenagers: A Graph Analysis。
Introduction:In recent years, the influence of social media on teenagers has become a topic of concern and debate. Withthe proliferation of social networking platforms, adolescents are spending increasing amounts of time online. This essay aims to explore the impact of social media on teenagers, using graphs to illustrate trends and statistics.Graph 1: Time Spent on Social Media Platforms by Teenagers。
The first graph depicts the average daily time spent by teenagers on various social media platforms over the past decade. From 2010 to 2020, there has been a steady increase in the time spent on social media, with peaks observed in2015 and 2019. This trend suggests a growing reliance on social media among teenagers for social interaction, entertainment, and information consumption.Graph 2: Effects of Social Media on Mental Health。
- 1、下载文档前请自行甄别文档内容的完整性,平台不提供额外的编辑、内容补充、找答案等附加服务。
- 2、"仅部分预览"的文档,不可在线预览部分如存在完整性等问题,可反馈申请退款(可完整预览的文档不适用该条件!)。
- 3、如文档侵犯您的权益,请联系客服反馈,我们会尽快为您处理(人工客服工作时间:9:00-18:30)。
大学英语四级考试图表作文1、图形种类及概述法:饼图:pie chart 直方图或柱形图:bar chart / histogram表格图:table 趋势曲线图:line chart / curve diagram泛指一份数据图表:a data graph/chart/diagram/illustration/table2、图表中的数据(Data )具体表达法数据(Data )在某一个时间段固定不变:fixed in time在一系列的时间段中转变:changes over time3. 持续变化的data 在不同情况下:增加:increase / raise / rise / go up 减少:shrink/decrease / drop / fall …波动:fluctuate / undulate / wave 稳定:remain stable / stabilize / level off 4. 最常用的两种表达法:动词+副词形式(Verb+Adverb form)形容词+名词形式(Adjective+Noun form )5. 图表常用动词:show 、describe 、illustrate 、can be seen from、clear 、apparent 、reveal 、represent 、demonstrate6. 图表常用名词:figure 、statistic 、number 、percentage 、proportion7、表示数据变化的单词或者词组rapid/rapidly 迅速的,飞快的, dramatic/dramatically 戏剧性的,significant/significantly 有意义的,重大的,stable/stably 稳定的sharp/sharply 锐利的,明显的,急剧的 steep/steeply 急剧升降的steady/steadily 稳固的,坚定不移的 slight/slightly 轻微的、略微地gradual/gradually 渐进的,逐渐的 slow/slowly 缓慢的,不活跃的8、其它在描述中的常用到的词significant changes 图中一些较大变化, noticeable trend 明显趋势during the same period 在同一时期, distribute 分布,区别 in contrast 相反,大不相同, market forces 市场规率forecast n. 先见,预见v. 预测 measure n.方法,措施 v. 估量,调节9. 图表写作套句精选1 the table shows the changes in the number of……over the periodfrom……to…… 该表格描述了在……年之……年间……数量的变化。
2 the bar chart illustrates that…… 该柱状图展示了……3.the graph provides some interesting data regarding…该图为我们提供了有关…有趣数据4.the diagram shows (that )…… 该图向我们展示了……5.the pie graph depicts (that )…… 该圆形图揭示了……6 .this is a cure graph which describes the trend of…这个曲线图描述了…的趋势7.the figures/statistics show (that )…… 数据(字)表明……8 .the tree diagram reveals how…… 该树型图向我们揭示了如何……9.the data/statistics show (that )…… 该数据(字)可以这样理解……10 .the data/statistics/figures lead us to the conclusion that……这些数据资料令我们得出结论……11.as is shown/demonstrated in the diagram/table…… 如图所示……12.as can be seen from the graph,the two curves show the fluctuation of… 如图所示,两条曲线描述了……的波动情况。
13 .according to the chart/figures…… 根据这些表(数字)……14.as can be seen from the diagram,great changes have taken place in…… 从图中可以看出,……发生了巨大变化。
15.from the table we can see clearly that…or it is clear from the chart that 从图表我们可以很清楚(明显)看到……16 .this is a graph which illustrates…… 这个图表向我们展示了……17 .this table shows the changing proportion of a & b from……to…… 该表格描述了……年到……年间a 与b 的比例关系。
18.the graph,presented in a pie chart, shows the general trend in…… 该图以圆形图形式描述了……总的趋势。
19 .this is a column chart showing…… 这是个柱型图,描述了……20 .over the period from…to…the…remained level. 在……至……期间……基本不变。
21. ...(year )witnessed/saw a sharp rise in…… ……年……急剧上升22 .in the year between……and…… 在……年到……期间……23).in the 3 years spanning from 1995 through 1998… 1995年至1998三年里……24). the difference between a and b lies in…… a 与b 之间的差别在于……25).the number of……remained steady/stable from (month/year)……月(年)至……月(年)……的数量基本不变。
26).the number sharply went up to…… 数字急剧上升至……27).the percentage of……stayed the same between……and…………至……期间……的比率维持不变。
28. the figures peaked at…in(month/year)……的数目在……月(年)达到顶点为……29 .the percentage remained steady at…… 比率维持在……30 .the percentage of…is sightly larger than that of… …的比例比…的比例略高31 .the re is not a great deal of difference between…and ……与……的区别不大。
32.the graphs show a threefold increase in the number of…该图表表明…的数目增长了三倍33 . …decreased year by year while…increased steadily.…逐年减少,而…逐步上升。
34.the situation reached a peak(a high point at) of[%].……的情况(局势)到达顶(高)点,为……百分点。
35. the figures/situation bottomed out in…… 数字(情况)在……达到底部。
36.the figures reached the bottom/a low point 数字(情况)达到底部(低谷)。
37. a is ……times as much/many as b. a 是b 的……倍。
38. a increased by…… a 增长了…… ( a increased to…… a 增到……41 .th ere is an upward trend in the number of…… ……数字呈上升趋势。
42.a considerable increase/decrease occurred from…to… …到…发生急剧上升。
43 .from……to……, the rate of decrease slow down. 从……到……,下降速率减慢。
44)from this year on,there was a gradual declining reduction in the……,reac hing a figure of…… 从这年起,……逐渐下降至……45).be similar to…… 与……相似47).there are a lot similarities/differences between……and…………与……之间有许多相似(不同)之处48). a has something in common with b a 于b 有共同之处。
Sample:car market of China. Based upon the data of the chart, one can see that the percentage of domestic cars , while the sales percentage of cars make in Japan . 2008, the percentage of cars made in China a it went up to nearly 33%. The percentage of cars made in Japan 35%, while it in 2009.civil products foreign ones. It’s reported that, approximately 55% of families in Chinese big cities are fond of cars made in China. support our native industries. Last but not the least, the face cannot be ignored that, the cars made in China are increasingly qualified.Samplein communication, body language , voice qualities, and words . Basically, I this estimate. body languagevoice words However, words are much more than 7% in its role. My estimate is that the impact from words is between 15% to 20%, voice from 35% to 40%, and body language from 40% to 50%.I believe the appropriate use of body language is very useful in daily communication. Once I heard someone complaining about something with a smiling face instead of an angry expression. The speaker successfully conveyed what he wanted to convey without causing much discomfort to the listener.As for voice, I also think it is very important. For example, when you are sound asleep in the early morning, your mother knocks at your door repeatedly and shouts at you angrily: "Get up! Hurry up!" You must be very unhappy. But if she knocked at your door, and speaks softly: "Honey! Time to get up" with a rising tone, you might wake up with a better mood. So I think that words, comparatively speaking, are the least important. What is more important is the way you say it.。