经济学原理曼昆Chapter 02
曼昆宏观经济学中文第二章课件

PPT学习交流
1
在本讲,你将会学到:
…最重要的宏观经济统计量的含义和测量方法: • 国内生产总值 (GDP) • 消费者价格指数 (CPI) • 失业率
PPT学习交流
2
国内生产总值: 支出和收入
两个定义:
• 对于国内生产的最终产品和服务的总支出 • 位于国内生产要素获得的总收入
• 我们(教科书)通常使用常价格实际 GDP。
• 这两种测量方法高度相关 • 常价格实际 GDP 更加容易计算
PPT学习交流
43
将增长与波动分开
• 一个序列的趋势是这个序列低-频数的组成部分。 序列偏离其趋势的部分(序列在经济周期范围内 上升和下降的部分)被称为高-频数的组成部分。 去趋是将一个时间序列分解为高-频数部分和低频数部分的和。经济增长理论将注意力放在是什 么决定了经济时间序列中低-频数的运动这一问题 上,而经济周期理论则要研究高-频数运动的原因。
名义 GDP
实际 GDP
GDP 平减指数
通货膨胀率
2006 ¥46,200 ¥46,200 100.0
n.a.
2007 51,400
50,000
102.8
2.8%
2008 58,300
52,000
112.1
9.1%
PPT学习交流
38
理解 GDP 平减指数
GDP平 减 指 数100NGDPt100P1tQ1t P2tQ2t P3tQ3t
PPT学习交流
33
实际GDP 控制了通货膨胀
名义 GDP 的改变可能由于: • 价格变化 • 产品数量变化
实际 GDP 的变化仅仅 由于数量变化, 因为实际 GDP 利用不变的基年价格测算。
曼昆经济学原理Chap02

Descriptive (reporting facts, etc.) Analytical (abstract reasoning)
Harcourt, Inc. items and derived items copyright © 2001 by Harcourt, Inc.
Economic Models
Harcourt, Inc. items and derived items copyright © 2001 by Harcourt, Inc.
Every field of study has its own terminology
机会成本 弹性 供给 Opportunity Elasticity Supply cost 消费者剩余 比较优势 Consumer Comparative Surplus Deadweight advantage 需求 loss??
Harcourt, Inc. items and derived items copyright © 2001 by Harcourt, Inc.
生产可能性边界
The Production Possibilities Frontier
电脑产量 Quantity of Computers Produced 3,000
用分析的方法,客观思考
Involves thinking analytically and objectivelientific method.
Harcourt, Inc. items and derived items copyright © 2001 by Harcourt, Inc.
The Production Possibilities Frontier
经济学原理曼昆Chapter 02
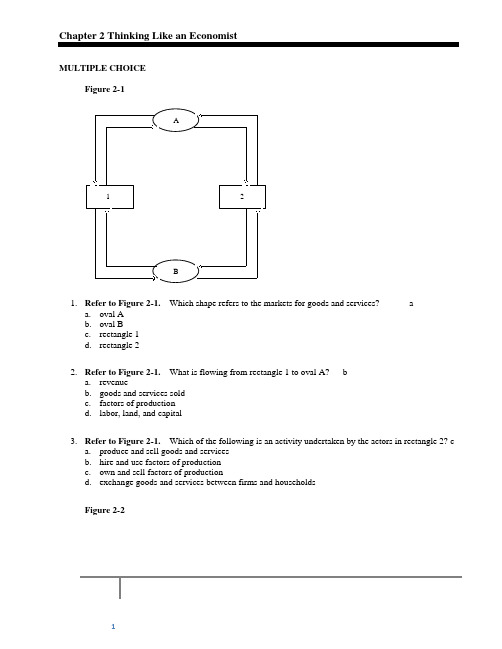
Chapter 2 Thinking Like an EconomistMULTIPLE CHOICEFigure 2-1AB 211. Refer to Figure 2-1.Which shape refers to the markets for goods and services? aa. oval Ab. oval Bc. rectangle 1d. rectangle 22. Refer to Figure 2-1.What is flowing from rectangle 1 to oval A? ba. revenueb. goods and services soldc. factors of productiond. labor, land, and capital3. Refer to Figure 2-1.Which of the following is an activity undertaken by the actors in rectangle 2? ca. produce and sell goods and servicesb. hire and use factors of productionc. own and sell factors of productiond. exchange goods and services between firms and householdsFigure 2-212345678910Consider the production possibilities curve for a country that can produce cars, corn (in bushels), or a combination of the two. 4. Refer to Figure 2-2. If this economy devotes all of its available resources to producing corn, then itwill produce da. 0 bushels of corn and 10 cars.b. 135 bushels of corn and 3 carsc. 160 bushels of corn and 10 cars.d. 160 bushels of corn and 0 cars.5. Refer to Figure 2-2. Which combination of points show production possibilities only achievablewith improvements in technology or increases in resources? da. A, D, and Eb. B and Gc. C and Fd. None of the above is correct.6. Refer to Figure 2-2. If this society moves from point D to point E, da. it gives up 25 bushels of corn to get 3 cars.b. it gives up 135 bushels of corn to get 3 cars.c. it gives up 3 cars to get 135 bushels of corn.d. it gives up 3 cars to get 25 bushels of corn.7. Refer to Figure 2-2. If this society is producing at point C, da. there is unemployment.b. production is efficient.c. growth can only be achieved through an advancement in technology.d. the opportunity cost of producing one more car is approximately 10 bushels of corn.8. Which of the following is a positive, as opposed to a normative, statement? ba. The US Department of Justice should allow a merger between AT&T and T-Mobilebecause it would have little effect on consumers.b. Antitrust laws should be used to prevent further concentration in the wireless telephoneservice market.c. The US Department of Justice sued AT&T to block its merger with T-Mobile.d. The wireless telephone service market is too highly concentrated.9. Which of the following famous people did not major in economics in college? ba. Donald Trumpb. Natalie Portmanc. John Elwayd. Mick Jagger10. Which of the following statements is correct about environmental economists? da. They view economics as a framework for natural resource allocation.b. They work at government agencies as well as universities and advocacy groups.c. They use economic arguments and systems to persuade companies to clean up pollutionand conserve natural resources.d. All of the above are correct.11. In the ordered pair (20, 100), 20 is the aa. x-coordinate.b. y-coordinate.c. scatterplot.d. slope.12. Between the two ordered pairs (20, 100) and (30, 80), the slope is ba. 1/2.b. -1/2.c. 2.d. -2.Figure 2-4snowblowers solds n o w s t o r ms 1020304050607080901234567891013. Refer to Figure 2-4. According to the graph, snowstorms aa. and snowblowers sold are positively correlated.b. and snowblowers sold are negatively correlatedc. and snowblowers sold are uncorrelated.d. are caused by more snowblowers being sold.14. Refer to Figure 2-4.Your friend John created the graph above to illustrate that snowstorms arecaused by more snowblowers being sold. You inform him that his interpretation is incorrect due to aa. omitted variable bias.b. reverse causality.c. slope mismatch.d. shifting versus moving along a curve.15. Refer to Figure 2-4.Which of the following could be an omitted variable in the graph? da. the price of snowblowersb. a change in consumers’ incomesc. a change in the seasonsd. All of the above are correct.PROBLEMFigure 2-1AB 211. Refer to Figure 2-1. What is the name of the model depicted in the figure?The Circular Flow2. Refer to Figure 2-1. What do the ovals represent in the figure?A: Markets for goods and service B: Markets for factors of production 3. Refer to Figure 2-1. What do the rectangles represent in the figure?1:Firms 2:Households4. Refer to Figure 2-1. What do the outer arrows represent in the figure?A to 1:revenue 1 toB :wages,rent, and profit B to 2 income 2 to A :spending 5.Refer to Figure 2-1. What do the inner arrows represent in the figure? A to 2:goods and services bought 2 to B:Labor,land,and capital B to1:Factors of production 1 to A: goods and services sold6. Refer to Figure 2-1. What does the arrow going from oval A to rectangle 2 represent in the figure? A to 2:goods and services bough7. Refer to Figure 2-1. What does the arrow going from oval B to rectangle 2 represent in the figure? B to 2 income 8.Refer to Figure 2-1. What are two elements not included in this figure that could be included in a more complex model? 9. The three main factors of production, or categories of inputs, used by firms to produce goods andservices areFigure 2-212345678910Consider the production possibilities curve for a country that can produce cars, corn (in bushels), or a combination of the two. 10.Refer to Figure 2-2. The bowed outward shape of the production possibilities curve indicates that opportunity cost of corn in terms of cars is 11.Refer to Figure 2-2. Which point(s) on the graph is(are) efficient production possibilities? 12.Refer to Figure 2-2. Which point(s) on the graph show unemployment of resources? 13. Refer to Figure 2-2. Which point(s) on the graph is(are) unattainable given current resources andtechnology?14.Who would be more likely to study the effects of government spending on the unemployment rate, a macroeconomist or a microeconomist? 15.Who would be more likely to study the effects of foreign competition on the accounting industry, a macroeconomist or a microeconomist? 16.Who would be more likely to study the effects of rent control on housing in New York City, a macroeconomist or a microeconomist? 17.Who would be more likely to study the inflation rate in the United States, a macroeconomist or a microeconomist? 18.Is the following a positive or normative statement? The federal minimum wage is lower than many state minimum wages. 19.Is the following a positive or normative statement? The Federal Reserve should set an inflation target and employ policies to meet the target. 20.Is the following a positive or normative statement? The United States government should mandate that every citizen purchases health insurance. 21. Is the following a positive or normative statement? The unemployment rate in Nevada is higher thanthe unemployment rate in New York.10203040506070801234567891022. Refer to Figure 2-3. What are the coordinates of point C?23. Refer to Figure 2-3. How are price and quantity related in this graph?24. Refer to Figure 2-3.What is the slope of the line?25. Refer to Figure 2-3.Is a move from point A to point B considered a shift of the curve or amovement along the curve?。
经济学原理曼昆2-精品文档
本章将探索这些问题的答案: In this chapter, look for the answers to these questions:
经济学家的两种角色是什么?怎样区别它们? What are economists’ two roles? How do they differ? 什么是模型?经济学家怎么使用它们? What are models? How do economists use them? 循环流程图的构成要素有哪些?流程图想要表达什么概念? What are the elements of the Circular-Flow Diagram? What concepts does the diagram illustrate?
macroeconomics? Between positive and normative?
1
作为科学家和作为政策顾问的经济学家
经济学家的两种角色/作用:
1. 2.
作为科学家:他们试图解释世界(explain the world)
作为政策顾问:他们尝试改善(改进)世界(improve it)
25,000
40,000 50,000
250
100 0
2,500
4,000 5,000
生产可能性边界:举例
图中 各点 A
B
产量
电脑 小麦
小麦 (吨 ) 6,000 5,000 4,000 3,000 2,000 1,000 0 0
E D
C
500
400
0
1,000
C
D E
250
100 0
2,500
4,000 5,000
经济学原理 曼昆Chapter_02_34902801

劳动,土地,资本
Wages, rent, and profit工资
of Production 生产要素市场
Income收入
13
、租金与利润
循环流向图
The Circular-Flow Diagram
企业Firms
生产和出售产品和服务Produce and sell goods and services
22
Cars Produced
坐标系中的双变量 Two Variables in the Coordinate System
• 理论预测变量之间的关系Theory predicts a causality relationship between variables
• 从数据中检验变量间的关系test the theory from data
20
Quantity of Computers Produced
4,000
3,000
2,100 2,000
The Production Possibiift in the production
possibilities frontier
生产可能性边界外移
对数据的经验(实证)分析 Empirical Analysis of Data
• How to present single variable data
圆形图Pie Chart 柱形图Bar Graph 时间序列图Time Series Graph
0
700 750 1,000
Quantity21of
假设应尽可能少 Fewer assumptions, the better
8
关于假设和结论 On Assumptions and Conclusions
曼昆哈佛大学经济学原理第二章PPT精品文档37页
Every field of study has its own terminology
Mathematics
integrals axioms
vector spaces
torts
Law
Promissory estoppel
venues
Harcourt, Inc. items and derived items copyright © 2001 by Harcourt, Inc.
Uses two approaches: Descriptive (reporting facts, etc.) Analytical (abstract reasoning)
Harcourt, Inc. items and derived items copyright © 2001 by Harcourt, Inc.
The Scientific Method
Uses abstract models to help explain how a complex, real world operates.
Develops theories, collects, and analyzes data to prove the theories.
Demand
Deadweight loss
Harcourt, Inc. items and derived items copyright © 2001 by Harcourt, Inc.
Economics trains you to. . . .
Think in terms of alternatives. Evaluate the cost of individual and
微观经济学原理(曼昆版课件)第二章PPT课件

• 生产可能性边界的移动
例)电脑行业的技 术进步提高了每个 工人每周可以生产 的电脑数量。
说明了经济的增长
9
第二个模型:生产可能性边界
• 生产可能性边界简化了复杂的经济,以便 强调一些基本但极为重要的思想:稀缺性、 效率、权衡取舍、机会成本和经济增长。
10
像经济学家一样思考
• 经济学研究似乎并不需要任何极高的特殊天赋。与更高 深的哲学或纯科学相比,经济学不是……一门极其容易的 学科吗?一门容易的学科,但这个学科中很少有人能出类 拔萃!这个悖论的解释也许在于杰出的经济学家应该具有 各种天赋的罕见的结合。在某种程度上他应该是数学家、 历史学家、政治家和哲学家。他必须了解符号并用文字表 达出来。他必须根据一般性来深入思考特殊性,并在思绪 奔放的同时触及抽象与具体。他必须根据过去、为着未来 而研究现在。他必须考虑到人性或人的制度的每一部分。 他必须同时保持果断而客观的情绪;像艺术家一样冷漠而 不流俗,但有时又要像政治家一样脚踏实地。这是一个高 标准。但通过实践,你将会越来越习惯于像经济学家一样 思考。
• 经济由从事许多活动——购买、销售、工作、雇佣、 制造等——的千百万人所组成。
• 在此模型中,经济有两类决策者——家庭和企业— —所组成。
• 企业用劳动、土地和资本(建筑物和机器)这些投 入来生产物品和劳务。这些投入就是生产要素。
• 家庭和企业在两类市场上相互交易。在物品与劳务 市场上,家庭是买者,而企业是卖者;在生产要素 市场上,家庭是卖者,而企业是买者。
炼
爱 因 斯
而 已
3
2.1 作为科学家的经济学家
• 科学方法:观察、理论和进一步观察
例)牛顿发现万有引力
• 假设的作用:
假设可以使复杂的世界简单化,而且使解释这个世界变得 更容易。
曼昆微观经济学 第二章共29页PPT资料

Chapter 2
Copyright © 2019 by Harcourt, Inc. All rights reserved. Requests for permission to make copies of any part of the
work should be mailed to: Permissions Department, Harcourt College Publishers, 6277 Sea Harbor Drive, Orlando, Florida 32887-6777.
Observation, Theory and More Observation!
Harcourt, Inc. items and derived items copyright © 2001 by Harcourt, Inc.
The Role of Assumptions
Economists make assumptions in order to make the world easier to understand. The art in scientific thinking is deciding which assumptions to make. Economists use different assumptions to answer different questions.
Factors
Wages, rent, of Production
and profit
Harcourt, Inc. items and derived items copyright © 2001 by Harcourt, Inc.
- 1、下载文档前请自行甄别文档内容的完整性,平台不提供额外的编辑、内容补充、找答案等附加服务。
- 2、"仅部分预览"的文档,不可在线预览部分如存在完整性等问题,可反馈申请退款(可完整预览的文档不适用该条件!)。
- 3、如文档侵犯您的权益,请联系客服反馈,我们会尽快为您处理(人工客服工作时间:9:00-18:30)。
Chapter 2 Thinking Like an EconomistMULTIPLE CHOICEFigure 2-1AB 211. Refer to Figure 2-1.Which shape refers to the markets for goods and services? aa. oval Ab. oval Bc. rectangle 1d. rectangle 22. Refer to Figure 2-1.What is flowing from rectangle 1 to oval A? ba. revenueb. goods and services soldc. factors of productiond. labor, land, and capital3. Refer to Figure 2-1.Which of the following is an activity undertaken by the actors in rectangle 2? ca. produce and sell goods and servicesb. hire and use factors of productionc. own and sell factors of productiond. exchange goods and services between firms and householdsFigure 2-212345678910Consider the production possibilities curve for a country that can produce cars, corn (in bushels), or a combination of the two. 4. Refer to Figure 2-2. If this economy devotes all of its available resources to producing corn, then itwill produce da. 0 bushels of corn and 10 cars.b. 135 bushels of corn and 3 carsc. 160 bushels of corn and 10 cars.d. 160 bushels of corn and 0 cars.5. Refer to Figure 2-2. Which combination of points show production possibilities only achievablewith improvements in technology or increases in resources? da. A, D, and Eb. B and Gc. C and Fd. None of the above is correct.6. Refer to Figure 2-2. If this society moves from point D to point E, da. it gives up 25 bushels of corn to get 3 cars.b. it gives up 135 bushels of corn to get 3 cars.c. it gives up 3 cars to get 135 bushels of corn.d. it gives up 3 cars to get 25 bushels of corn.7. Refer to Figure 2-2. If this society is producing at point C, da. there is unemployment.b. production is efficient.c. growth can only be achieved through an advancement in technology.d. the opportunity cost of producing one more car is approximately 10 bushels of corn.8. Which of the following is a positive, as opposed to a normative, statement? ba. The US Department of Justice should allow a merger between AT&T and T-Mobilebecause it would have little effect on consumers.b. Antitrust laws should be used to prevent further concentration in the wireless telephoneservice market.c. The US Department of Justice sued AT&T to block its merger with T-Mobile.d. The wireless telephone service market is too highly concentrated.9. Which of the following famous people did not major in economics in college? ba. Donald Trumpb. Natalie Portmanc. John Elwayd. Mick Jagger10. Which of the following statements is correct about environmental economists? da. They view economics as a framework for natural resource allocation.b. They work at government agencies as well as universities and advocacy groups.c. They use economic arguments and systems to persuade companies to clean up pollutionand conserve natural resources.d. All of the above are correct.11. In the ordered pair (20, 100), 20 is the aa. x-coordinate.b. y-coordinate.c. scatterplot.d. slope.12. Between the two ordered pairs (20, 100) and (30, 80), the slope is ba. 1/2.b. -1/2.c. 2.d. -2.Figure 2-4snowblowers solds n o w s t o r ms 1020304050607080901234567891013. Refer to Figure 2-4. According to the graph, snowstorms aa. and snowblowers sold are positively correlated.b. and snowblowers sold are negatively correlatedc. and snowblowers sold are uncorrelated.d. are caused by more snowblowers being sold.14. Refer to Figure 2-4.Your friend John created the graph above to illustrate that snowstorms arecaused by more snowblowers being sold. You inform him that his interpretation is incorrect due to aa. omitted variable bias.b. reverse causality.c. slope mismatch.d. shifting versus moving along a curve.15. Refer to Figure 2-4.Which of the following could be an omitted variable in the graph? da. the price of snowblowersb. a change in consumers’ incomesc. a change in the seasonsd. All of the above are correct.PROBLEMFigure 2-1AB 211. Refer to Figure 2-1. What is the name of the model depicted in the figure?The Circular Flow2. Refer to Figure 2-1. What do the ovals represent in the figure?A: Markets for goods and service B: Markets for factors of production 3. Refer to Figure 2-1. What do the rectangles represent in the figure?1:Firms 2:Households4. Refer to Figure 2-1. What do the outer arrows represent in the figure?A to 1:revenue 1 toB :wages,rent, and profit B to 2 income 2 to A :spending 5.Refer to Figure 2-1. What do the inner arrows represent in the figure? A to 2:goods and services bought 2 to B:Labor,land,and capital B to1:Factors of production 1 to A: goods and services sold6. Refer to Figure 2-1. What does the arrow going from oval A to rectangle 2 represent in the figure? A to 2:goods and services bough7. Refer to Figure 2-1. What does the arrow going from oval B to rectangle 2 represent in the figure? B to 2 income 8.Refer to Figure 2-1. What are two elements not included in this figure that could be included in a more complex model? 9. The three main factors of production, or categories of inputs, used by firms to produce goods andservices areFigure 2-212345678910Consider the production possibilities curve for a country that can produce cars, corn (in bushels), or a combination of the two. 10.Refer to Figure 2-2. The bowed outward shape of the production possibilities curve indicates that opportunity cost of corn in terms of cars is 11.Refer to Figure 2-2. Which point(s) on the graph is(are) efficient production possibilities? 12.Refer to Figure 2-2. Which point(s) on the graph show unemployment of resources? 13. Refer to Figure 2-2. Which point(s) on the graph is(are) unattainable given current resources andtechnology?14.Who would be more likely to study the effects of government spending on the unemployment rate, a macroeconomist or a microeconomist? 15.Who would be more likely to study the effects of foreign competition on the accounting industry, a macroeconomist or a microeconomist? 16.Who would be more likely to study the effects of rent control on housing in New York City, a macroeconomist or a microeconomist? 17.Who would be more likely to study the inflation rate in the United States, a macroeconomist or a microeconomist? 18.Is the following a positive or normative statement? The federal minimum wage is lower than many state minimum wages. 19.Is the following a positive or normative statement? The Federal Reserve should set an inflation target and employ policies to meet the target. 20.Is the following a positive or normative statement? The United States government should mandate that every citizen purchases health insurance. 21. Is the following a positive or normative statement? The unemployment rate in Nevada is higher thanthe unemployment rate in New York.10203040506070801234567891022. Refer to Figure 2-3. What are the coordinates of point C?23. Refer to Figure 2-3. How are price and quantity related in this graph?24. Refer to Figure 2-3.What is the slope of the line?25. Refer to Figure 2-3.Is a move from point A to point B considered a shift of the curve or amovement along the curve?。