不确定性数据挖掘外文翻译文献
外文文献翻译网络团购中的不确定性需求细分-中英对照

题目:我国网络团购的发展现状与问题探究一、外文原文标题:Segmenting uncertain demand in group-buying auctions原文:Demand uncertainty is a key factor in a seller’s decision-making process for products sold through online auctions. We explore demand uncertainty in group-buying auctions in terms of the extent of low-valuation demand and high-valuation demand. We focus on the analysis of a monopolistic group-buying retailer that sells products to consumers who express different product valuations. We also examine the performance of a group-buying seller who faces competitive posted-price sellers in a market for the sale of the same products, under similar assumptions about uncertain demand. Based on a Nash equilibrium analysis of bidder strategies for both of these seller-side competition structures, we are able to characterize the groupbuying auction bidders’ dominant strategies. We obtained a number of interesting findings. Group-buying is likely to be more effective in settings where there is larger low-valuation demand than high-valuation demand. The structure of demand matters. This finding has relevance to the marketplace for new cameras, next-generation microprocessors and computers, and other high-valuation goods, which are unlikely to be as effectively sold in group-buying markets. We obtained additional results for the case of continuous demand, and find that there is a basis for the seller to improve revenues via effective group-buying auction price curve design.Keywords: Consumer behavior, bidding strategy, demand uncertainty, economic analysis, electronic markets, group-buying auctions, market mechanism, posted-price mechanism, simulation, uncertainty risk.The development of advanced IT makes it possible to use novel business models to handle business problems in new and innovative ways. With the growth of the Internet, a number of new electronic auction mechanisms have emerged, and auctions are generally known to create higher expected seller revenue than posted-prices whenthe cost of running an auction is minimal or costless (Wang 1993). Some of the new mechanisms we have seen include the online Yankee and Dutch auctions, and the “name-yourown-price” and “buy-it-now” mechanisms. An example is eBay’s Dutch auction for the sale of multiple items of the same description. Another of these new electronic market mechanisms that we have observed is the group-buying auction, a homogeneous multi-unit auction (Mitchell 2002, Li et al. 2004).Internet-based sellers and digital intermediaries have adopted this market mechanism on sites such as () and (). These sites offer transaction-making mechanisms that are different from traditional auctions. In traditional auctions, bidders compete against one another to be the winner.In group-buying auctions, however, bidders have an incentive to aggregate their bids so that the seller or digital intermediary offers a lower price at which they all can buy the desired goods (Horn et al. 2000). McCabe et al. (1991) have explored multi-unit Vickrey auctions in experimental research, however, they did not consider the possibility of stochastic bidder arrival or demand uncertainty.This paper is the first to examine the impacts of demand uncertainty on the performance on online group-buying auctions. Based on a Nash equilibrium analysis of bidder strategies for a monopolist seller and a competitive seller, we are able to characterize the group-buying auction bidders’ symmetric and dominant strategies. We find that group-buying is likely to be more effective in settings where there is larger low-valuation demand than high-valuation demand. Thus, the structure of demand at different level of willingness-to-pay by consumers matters. This has relevance to the marketplace for new cameras, next-generation microprocessors and computers, and other high-valuation goods. We obtained additional results for the case of continuous demand valuations, and found that there is a basis for the seller to improve revenues based on the effective design of the group-buying auction price curve design. THEORYThe model for the group-buying auction mechanism with uncertain bidder arrival that we will develop spans three streams of literature: demand uncertainty, consumer behavior and related mechanism design issues; auction economics and mechanismdesign theory; and current theoretical knowledge about the operation of group-buying auctions from the IS and electronic commerce literature.Demand Uncertainty, Consumer Behavior and Mechanism Design Demand uncertainties typically are composed of consumer demand environment uncertainty (or uncertainty about the aggregate level of consumer demand) and randomness of demand in the marketplace (reflected in brief temporal changes and demand shocks that are not expected to persist). Consumer uncertainty about demand in the marketplace can occur based on the valuation of products, and whether consumers are willing to pay higher or lower prices. It may also occur on the basis of demand levels, especially the number of the consumers in the market. Finally, there are temporal considerations, which involve whether a consumer wishes to buy now, or whether they may be sampling quality and pricing with the intention of buying later. We distinguish between different demand level environments. In addition, it is possible that these consumer demand environments may co-exist, as is often the case when firms make strategies for price discrimination. This prompts a seller to consider setting more than one price level, as we often see in real-world retailing, as well as group-buying auctions.Dana (2001) pointed out that when a monopoly seller faces uncertainty about the consumer demand environment, it usually will not be in his best interest to set uniform prices for all consumers. The author studied a scenario in which there were more buyers associated with high demand and fewer buyers associated with low demand. In the author’s proposed price mechanism, the seller sets a price curve instead of a single price, so as to be able to offer different prices depending on the different demand conditions that appear to obtain in the marketplace. It may be useful in such settings to employ an automated pricesearching mechanism, which is demonstrated to be more robust to the uncertain demand than a uniform price mechanism will, relative to expected profits. Unlike Dana’s (2001) work though, we will study settings in which there are fewer buyers who exhibit demand at higher prices and more buyers who exhibit demand at lower prices. This is a useful way to characterize group-buying, since most participating consumers truly are price-sensitive, and this is what makesgroup-buying auction interesting to them.Nocke and Peitz (2007) have studied rationing as a tool that a monopolist to optimize its sales policy in the presence of uncertain demand. The authors examined three different selling policies that they argue are potentially optimal in their environment: uniform pricing, clearance sales, and introductory offers. A uniform pricing policy involves no seller price discrimination, though consumers are likely to exhibit different levels of willingness-to-pay when they are permitted to express themselves through purchases at different price levels. A current example of uniform pricing policy is iTunes (), which has been offering 99¢per song pricing. The consumer has to deal with very little uncertainty in the process, and this may be a good approach when the seller wants to “train” consumers to develop specific buying habits (as seems to have been the case with the online purchase of digital music in the past few years).Nocke and Peitz (2007) characterized a clearance sales policy as charging a high price initially, but then lowering the price and offering the remaining goods to low value consumers, as is often seen in department store sales policy. Consumers with a high valuation for the sale goods may decide to buy at the high price, since the endogenous probability of rationing by the seller is higher at the lower price. Apropos to this, consumers who buy late at low prices typically find that it is difficult to find the styles, colors and sizes that they want, and they may have more difficulty to coordinate the purchase of matching items (e.g., matching colors and styles of clothing). Introductory offers consist of selling a limited quantity of items at a low price initially in the market, and then raising price. A variant occurs when the seller offers a lower price for the first purchase of goods or services that typically involve multiple purchases by the consumer (e.g., book club memberships and cell phone services). Consumers who place a high valuation on a sale item rationed initially at the lower price may find it optimal to buy the goods at the higher price. Introductory offers may dominate uniform pricing, but are never optimal if the seller uses clearance sales.In uncertain markets, buyers will have private information. Che and Gale (2000) pointed out that when consumers have private information about their budgetconstraints and their valuation of sales items, so a monopolist’s optimal pricing strategy is to offer a menu of lotteries on the likelihood of consumer purchases of its products at different prices. Another approach is intertemporal price discrimination. By offering different prices with different probabilities for the consumer to obtain the good, the monopolist can profitably segment consumers even though valuation segments alone are not profitable.Even when the seller can effectively identify the consumer demand level in the marketplace, due to stochastic factors in the market environment, it still may be difficult for the seller to effectively predict demand. As a result, the seller may try to improve its demand forecast by utilizing market signals that may be observed when sales occur. However, there are likely to be some stochastic differences between the predicted demand by the seller and the realized demand in the marketplace (Kauffman and Mohtadi 2004). Lo and Wu (2003) pointed out that a typical seller faces different types of risks, and among these, a key factor is forecast error, the difference between the forecast and the actual levels of demand. Dirim and Roundy (2002) quantified forecast errors based on a scheme that estimates the variance and correlation of forecast errors and models the evolution of forecasts over time.2.2. Some Properties of Group-Buying Auction MechanismSome of the key characteristics associated with group-buying auction mechanism design are present in the literature. The group-buying auction mechanism is fundamentally different from the typical quantity discount mechanism (Dolan 1987, Weng 1995, Corbett and DeGroote 2000) that is often used in consumer and business-to-business procurement settings.First, group-buying closing prices typically decline monotonically in the total purchase quantities of participating buyers, and not just based on an individual buyer’s purchase quantities. So a group-buying auction does not lead to price discrimination among different buyers and every buyer will be charged the same closing price.Second, in group-buying auctions, imperfect information may have an impact on performance and make the final auction price uncertain. Group-buying is not the same as what happens with corporate shopping clubs or affinity group-based buying though.With these other mechanisms, consumers will be associated with one another in some way, and be able to obtain quantity discounts as a result. Another variant of the quantity discount mechanism occurs o n the Internet with shopping clubs and “power-buying”Web sites. (), Buyer’s Advantage (www.buyersadvan ), and Online Choice () are examples that we have recently observed in the marketplace. With uncertainty about the ultimate number of the bidders who will participate, interested consumers may not know whether they can get the products, or what the closing price will be when they make a bid. This may even occur when they bid the lowest price on the group-buying price curve.Third, in the quantity discount mechanism, to achieve a discount the buyer must order more than the threshold number of items required. In group-buying, the buyer can get the discount by ordering more herself or persuading other bidders to order more, as we saw with the “Tell-a-Friend” link at Lets-Buy for co-buying (and at the active group-donation site, , ).A final consideration in some group-buying auctions is that a buyer may be able to choose her own bidding price, which makes this kind of auction similar to an open outcry auction. In practice, many buyers will only be willing to state a low bid price, unless they can rely on the design of the mechanism to faithfully handle information about their actual reservation price. Group-buying auctions have a key, but paradoxical feature: to reach a lower price and higher sale quantity bucket, the consumer may need to enter the auction at a higher price and lower sales quantity bucket (Chen et al. 2009). 出处:J. Chen, R.J. Kauffman, Y. Liu, X. Song.Segmenting uncertain demand in group-buying auctions[R]. Electronic Commerce Research and Applications 2009,3(001).二、翻译文章标题:网络团购中的不确定性需求细分译文:不确定性需求,是卖家通过网络拍卖形式销售产品的决策过程中的一个关键因素。
大数据外文翻译参考文献综述
大数据外文翻译参考文献综述(文档含中英文对照即英文原文和中文翻译)原文:Data Mining and Data PublishingData mining is the extraction of vast interesting patterns or knowledge from huge amount of data. The initial idea of privacy-preserving data mining PPDM was to extend traditional data mining techniques to work with the data modified to mask sensitive information. The key issues were how to modify the data and how to recover the data mining result from the modified data. Privacy-preserving data mining considers the problem of running data mining algorithms on confidential data that is not supposed to be revealed even to the partyrunning the algorithm. In contrast, privacy-preserving data publishing (PPDP) may not necessarily be tied to a specific data mining task, and the data mining task may be unknown at the time of data publishing. PPDP studies how to transform raw data into a version that is immunized against privacy attacks but that still supports effective data mining tasks. Privacy-preserving for both data mining (PPDM) and data publishing (PPDP) has become increasingly popular because it allows sharing of privacy sensitive data for analysis purposes. One well studied approach is the k-anonymity model [1] which in turn led to other models such as confidence bounding, l-diversity, t-closeness, (α,k)-anonymity, etc. In particular, all known mechanisms try to minimize information loss and such an attempt provides a loophole for attacks. The aim of this paper is to present a survey for most of the common attacks techniques for anonymization-based PPDM & PPDP and explain their effects on Data Privacy.Although data mining is potentially useful, many data holders are reluctant to provide their data for data mining for the fear of violating individual privacy. In recent years, study has been made to ensure that the sensitive information of individuals cannot be identified easily.Anonymity Models, k-anonymization techniques have been the focus of intense research in the last few years. In order to ensure anonymization of data while at the same time minimizing the informationloss resulting from data modifications, everal extending models are proposed, which are discussed as follows.1.k-Anonymityk-anonymity is one of the most classic models, which technique that prevents joining attacks by generalizing and/or suppressing portions of the released microdata so that no individual can be uniquely distinguished from a group of size k. In the k-anonymous tables, a data set is k-anonymous (k ≥ 1) if each record in the data set is in- distinguishable from at least (k . 1) other records within the same data set. The larger the value of k, the better the privacy is protected. k-anonymity can ensure that individuals cannot be uniquely identified by linking attacks.2. Extending ModelsSince k-anonymity does not provide sufficient protection against attribute disclosure. The notion of l-diversity attempts to solve this problem by requiring that each equivalence class has at least l well-represented value for each sensitive attribute. The technology of l-diversity has some advantages than k-anonymity. Because k-anonymity dataset permits strong attacks due to lack of diversity in the sensitive attributes. In this model, an equivalence class is said to have l-diversity if there are at least l well-represented value for the sensitive attribute. Because there are semantic relationships among the attribute values, and different values have very different levels of sensitivity. Afteranonymization, in any equivalence class, the frequency (in fraction) of a sensitive value is no more than α.3. Related Research AreasSeveral polls show that the public has an in- creased sense of privacy loss. Since data mining is often a key component of information systems, homeland security systems, and monitoring and surveillance systems, it gives a wrong impression that data mining is a technique for privacy intrusion. This lack of trust has become an obstacle to the benefit of the technology. For example, the potentially beneficial data mining re- search project, Terrorism Information Awareness (TIA), was terminated by the US Congress due to its controversial procedures of collecting, sharing, and analyzing the trails left by individuals. Motivated by the privacy concerns on data mining tools, a research area called privacy-reserving data mining (PPDM) emerged in 2000. The initial idea of PPDM was to extend traditional data mining techniques to work with the data modified to mask sensitive information. The key issues were how to modify the data and how to recover the data mining result from the modified data. The solutions were often tightly coupled with the data mining algorithms under consideration. In contrast, privacy-preserving data publishing (PPDP) may not necessarily tie to a specific data mining task, and the data mining task is sometimes unknown at the time of data publishing. Furthermore, some PPDP solutions emphasize preserving the datatruthfulness at the record level, but PPDM solutions often do not preserve such property. PPDP Differs from PPDM in Several Major Ways as Follows :1) PPDP focuses on techniques for publishing data, not techniques for data mining. In fact, it is expected that standard data mining techniques are applied on the published data. In contrast, the data holder in PPDM needs to randomize the data in such a way that data mining results can be recovered from the randomized data. To do so, the data holder must understand the data mining tasks and algorithms involved. This level of involvement is not expected of the data holder in PPDP who usually is not an expert in data mining.2) Both randomization and encryption do not preserve the truthfulness of values at the record level; therefore, the released data are basically meaningless to the recipients. In such a case, the data holder in PPDM may consider releasing the data mining results rather than the scrambled data.3) PPDP primarily “anonymizes” the data by hiding the identity of record owners, whereas PPDM seeks to directly hide the sensitive data. Excellent surveys and books in randomization and cryptographic techniques for PPDM can be found in the existing literature. A family of research work called privacy-preserving distributed data mining (PPDDM) aims at performing some data mining task on a set of private databasesowned by different parties. It follows the principle of Secure Multiparty Computation (SMC), and prohibits any data sharing other than the final data mining result. Clifton et al. present a suite of SMC operations, like secure sum, secure set union, secure size of set intersection, and scalar product, that are useful for many data mining tasks. In contrast, PPDP does not perform the actual data mining task, but concerns with how to publish the data so that the anonymous data are useful for data mining. We can say that PPDP protects privacy at the data level while PPDDM protects privacy at the process level. They address different privacy models and data mining scenarios. In the field of statistical disclosure control (SDC), the research works focus on privacy-preserving publishing methods for statistical tables. SDC focuses on three types of disclosures, namely identity disclosure, attribute disclosure, and inferential disclosure. Identity disclosure occurs if an adversary can identify a respondent from the published data. Revealing that an individual is a respondent of a data collection may or may not violate confidentiality requirements. Attribute disclosure occurs when confidential information about a respondent is revealed and can be attributed to the respondent. Attribute disclosure is the primary concern of most statistical agencies in deciding whether to publish tabular data. Inferential disclosure occurs when individual information can be inferred with high confidence from statistical information of the published data.Some other works of SDC focus on the study of the non-interactive query model, in which the data recipients can submit one query to the system. This type of non-interactive query model may not fully address the information needs of data recipients because, in some cases, it is very difficult for a data recipient to accurately construct a query for a data mining task in one shot. Consequently, there are a series of studies on the interactive query model, in which the data recipients, including adversaries, can submit a sequence of queries based on previously received query results. The database server is responsible to keep track of all queries of each user and determine whether or not the currently received query has violated the privacy requirement with respect to all previous queries. One limitation of any interactive privacy-preserving query system is that it can only answer a sublinear number of queries in total; otherwise, an adversary (or a group of corrupted data recipients) will be able to reconstruct all but 1 . o(1) fraction of the original data, which is a very strong violation of privacy. When the maximum number of queries is reached, the query service must be closed to avoid privacy leak. In the case of the non-interactive query model, the adversary can issue only one query and, therefore, the non-interactive query model cannot achieve the same degree of privacy defined by Introduction the interactive model. One may consider that privacy-reserving data publishing is a special case of the non-interactivequery model.This paper presents a survey for most of the common attacks techniques for anonymization-based PPDM & PPDP and explains their effects on Data Privacy. k-anonymity is used for security of respondents identity and decreases linking attack in the case of homogeneity attack a simple k-anonymity model fails and we need a concept which prevent from this attack solution is l-diversity. All tuples are arranged in well represented form and adversary will divert to l places or on l sensitive attributes. l-diversity limits in case of background knowledge attack because no one predicts knowledge level of an adversary. It is observe that using generalization and suppression we also apply these techniques on those attributes which doesn’t need th is extent of privacy and this leads to reduce the precision of publishing table. e-NSTAM (extended Sensitive Tuples Anonymity Method) is applied on sensitive tuples only and reduces information loss, this method also fails in the case of multiple sensitive tuples.Generalization with suppression is also the causes of data lose because suppression emphasize on not releasing values which are not suited for k factor. Future works in this front can include defining a new privacy measure along with l-diversity for multiple sensitive attribute and we will focus to generalize attributes without suppression using other techniques which are used to achieve k-anonymity because suppression leads to reduce the precision ofpublishing table.译文:数据挖掘和数据发布数据挖掘中提取出大量有趣的模式从大量的数据或知识。
外文翻译-不确定性数据挖掘:一种新的研究方向
毕业设计(论文)外文资料翻译系部:计算机科学与技术系专业:计算机科学与技术姓名:学号:外文出处:Proceeding of Workshop on the (用外文写)of Artificial,Hualien,TaiWan,2005不确定性数据挖掘:一种新的研究方向Michael Chau1, Reynold Cheng2, and Ben Kao31:商学院,香港大学,薄扶林,香港2:计算机系,香港理工大学九龙湖校区,香港3:计算机科学系,香港大学,薄扶林,香港摘要由于不精确测量、过时的来源或抽样误差等原因,数据不确定性常常出现在真实世界应用中。
目前,在数据库数据不确定性处理领域中,很多研究结果已经被发表。
我们认为,当不确定性数据被执行数据挖掘时,数据不确定性不得不被考虑在内,才能获得高质量的数据挖掘结果。
我们称之为“不确定性数据挖掘”问题。
在本文中,我们为这个领域可能的研究方向提出一个框架。
同时,我们以UK-means 聚类算法为例来阐明传统K-means算法怎么被改进来处理数据挖掘中的数据不确定性。
1.引言由于测量不精确、抽样误差、过时数据来源或其他等原因,数据往往带有不确定性性质。
特别在需要与物理环境交互的应用中,如:移动定位服务[15]和传感器监测[3]。
例如:在追踪移动目标(如车辆或人)的情境中,数据库是不可能完全追踪到所有目标在所有瞬间的准确位置。
因此,每个目标的位置的变化过程是伴有不确定性的。
为了提供准确地查询和挖掘结果,这些导致数据不确定性的多方面来源不得不被考虑。
在最近几年里,已有在数据库中不确定性数据管理方面的大量研究,如:数据库中不确定性的表现和不确定性数据查询。
然而,很少有研究成果能够解决不确定性数据挖掘的问题。
我们注意到,不确定性使数据值不再具有原子性。
对于使用传统数据挖掘技术,不确定性数据不得不被归纳为原子性数值。
再以追踪移动目标应用为例,一个目标的位置可以通过它最后的记录位置或通过一个预期位置(如果这个目标位置概率分布被考虑到)归纳得到。
经典数据挖掘文献

Based on Apriori algorithm Data mining1.Over the valuable hideaway event in the huge database, and performs to analyze Data Mining outlineAlong with take the computer and the network as representative of information technology's development, more and more enterprises, the official organization, educational institution and the scientific research unit has achieved information digitized processing. The information content unceasing growth in the database ask the data memory, the management and the analysis a higher request.One side, the progress of data collection tool enable the humanity to have the huge data quantity, facing assumed the detonation growth of the data, the people need some new tools which could automate transforms the data into the valuable information and the knowledge. Thus, the data mining becomes a new research hot spot domain.On the other hand, along with the data bank technology rapid development and the data management system universal promotion, the data which the people accumulate also day by day .In the sharp increase data also possibility hide many important informations , people hope to make a higher level analysis of the held information, in order to used these data better.The Data Mining (Data Mining)is a new technology which excavates the concealment, formerly unknown, the latent value knowledge to the decision-making from the mass datas. The data mining is a technology that devotes to the data analysis, the understanding and the revelation data interior implication knowledge, it will become one of future information technology application profitable targets. It is likely to other new technical development course, the data mining technology also must after the concept propose, the concept accepts, the widespread research and the exploration, gradually applies and massive applies stages.The data mining technology and the daily life relations already become more and more close. We must face the pointed advertisement every day, the commercial sector reduce the cost through the data mining technology to enhance the efficiency. The data mining opponent worried the data miningobtains the information is threatens people's privacy for the price. Using the data mining might obtain some population statistics information which is unknown before and hideaway in the customer data.The people grow day by day regarding the data mining technology in certain domain application interest, for example cheat examination, suspect identification as well as latent terrorist forecast.The data mining technology may help the people to withdraw from the database correlation data is interested the knowledge, the rule or the higher level information, and may help the people to analyze them from the varying degree, thus may use in the database effectively the data. Not only the data mining technology might use in describing the past data developing process, further also will be able to forecast the future tendency.The data mining technology classified method are very many, according to the data mining duty, may divide into the connection rule excavation, the data class rule excavation, the cluster rule excavation, the dependent analysis and the dependent model discovered, as well as the concept description, the deviation analyze, the trend analysis and the pattern analysis and so on; According to the database which excavates looked that, may divide into the relations database, the object-oriented database, the space database, the time database, the multimedia databases and the different configuration database and so on; According to technical classification which uses, may divide into the artificial neural networks, the decision tree, the genetic algorithm, the neighborhood principle and may the vision and so on.The data mining process by the determination excavation object, the data preparation, the model establishment, the data mining, the result analysis indicates generally and excavates applies these main stages to be composed. The data mining may describe for these stages repeatedly the process.The data mining needs to process the question, is dische gain has the significance information, induces the useful structure, carries on policy-making as the enterprise the basis. Its application is extremely widespread, so long as this industry has the analysis value and the demanddatabase, all may carry on using the Mining tool has the goal excavating analysis. The common application case occurs much at the retail trade, the manufacturing industry, the financial finance insurance, the communication and the medical service.The data mining technology may help the people to withdraw from the database correlation data centralism is interested the knowledge, the rule or the higher level information, and may help the people to analyze them from the varying degree, thus may use in the database effectively the data. Not only the data mining technology might use in describing the past data developing process, further also will be able to forecast the future tendency. In view of this, we study the data mining to have the significance.But the data mining is only a tool, is not multi-purpose, it may discover some potential users, but why can't tell you, also cannot guarantee these potential users become the reality. The data mining success request to expected solves the question domain to have the profound understanding, understands the data, understood its process, can discover the reasonable explanation to the data mining result.2 The connection ruleThe connection rule is refers to between the mass data mean terms collection the interesting connection or the correlation relation. Along with the data accumulation, many field public figures regarding excavate the connection rule from theirs database more and more to be interested. Records from the massive commercial business discovered the interesting incidence relation, may help many commercial decisions-making the formulation.The connection rule discovery initial form is retail merchant's shopping blue analysis, the shopping blue analysis is through discovered the customer puts in its goods blue the different commodity, namely the different between relation, analyzes customer's purchase custom. Through understood which commodities also are purchased frequently by the customer, the analysis obtains between the commodity connection, this kind of connection discovery may help the retail merchant formulation marketing strategy. Theshopping blue analysis model application is may help manager to design the different store layout. One kind of strategy is: Together purchases frequently the commodity may place near somewhat, in order to further stimulate these commodities to sell together. For example, if the customer purchases the computer also to favor simultaneously purchases the financial control software, if then places the hardware exhibits near to the software, possibly is helpful in increases the two the sale. Another kind of strategy is: Place separately the hardware and the software in the store both sides, this possible to induce to purchase these commodities a customer group to choose other commodities. Certainly, the shopping blue analysis is connected the rule discovery the initial form, quite simple. The connection rule discovered the research and the application in unceasingly are also developing. For example, if some food shop through the shopping basket analysis knew “the majority of customers can simultaneously purchase the bread and the milk in a shopping”, then this food shop has the possibility through the reduction promotion bread simultaneously to enhance the bread and the milk sales volume.For example Again, if some children good store through the shopping basket analysis knew “the majority of customers can simultaneously purchase the powdered milk and the urine piece in a shopping”, then this children good store through lays aside separately the powdered milk and the urine piece in the close far place, the middle laying aside some other commonly used child thing, possibly induces the customer when the purchase powdered milk and the urine piece a group purchases other commodities.Digs the stubborn connection rule in business set mainly to include two steps: (1)Discovers all frequent item of collections because the frequent item of collection is the support is bigger than is equal to the smallest support threshold value an item of collection, therefore is composed by frequent item of collection all items the connection rule support is also bigger than is equal to the smallest support threshold value.(2) Has the strong connection rule tohave the strong connection rule is bigger than in all supports was equal to the smallest support threshold value in the connection rule, discovers all confidences to be bigger than is equal to the smallest confidence threshold value the connection rule. In the above two steps, the key is the first step, its efficiency influence entire excavation algorithm efficiency.3 the Apriori algorithmFrequent item of collection: If an item of collection satisfies the smallest support, namely if the item of collection appearance frequency is bigger than or is equal to min_sup (smallest support threshold value) with business database D in business total product, then calls this item of collection the frequent item of collection (Freqent Itemset), abbreviation frequent collection.The frequent k- item of collection set records is usually L K.The Apriori algorithm also called Breadth First or Level the Wise algorithm, proposed by Rakesh Agrawal and Rnamakrishnan Srekant in 1994, it is the present frequent collection discovery algorithm core.The Apriori algorithm uses one kind of being called as cascade search the iterative method, a frequent k- item of collection uses in searching a frequent (k+1)- item of collection.First, discovers the frequent 1- item of collection the set, this set records makes L1, L1 to use in discovering the frequent 2- item of collection set L2, but L2 uses in discovering L3, continue like this, until cannot find a frequent k- item of collection.Looks for each LK to need to scan a database.The connection rule excavation algorithm decomposition is two sub-questions: (1) Extracts in D to satisfy smallest support min_sup all frequent collections; (2) use frequent collection production satisfies smallest confidence level min_conf all connection rule.The first question is the key of this algorithm, the Apriori algorithm solves this problem based on the frequent collection theory recursion method.。
数据挖掘论文英文版
Jilin Province’s population growth and energy consumption analysisMajor StatisticsStudent No. 0401083710Name Niu FukuanJilin Province’s population growth andenergy consumption analysis[Summary]Since the third technological revolution, the energy has become the lifeline of national economy, while the energy on Earth is limited, so in between the major powers led to a number of oil-related or simply a war for oil. In order to compete on the world's resources and energy control, led to the outbreak of two world wars. China's current consumption period coincided with the advent of high-energy, CNPC, Sinopec, CNOOC three state-owned oil giants have been "going out" to develop international markets, Jilin Province as China's energy output and energy consumption province, is also active in the energy corresponding diplomacy. Economic globalization and increasingly fierce competition in the energy environment, China's energy policy is still there are many imperfections, to a certain extent, affect the energy and population development of Jilin Province, China and even to some extent can be said existing population crisis is the energy crisis.[Keyword]Energy consumption; Population; Growth; Analysis;Data sourceI select data from "China Statistical Yearbook 2009" Jilin Province 1995-2007 comprehensive annual financial data (Table 1). Record of the total population (end) of the annual data sequence {Xt}, mind full of energy consumption (kg of standard coal) annual data sequence {Yt}.Table 1 1995-2007 older and province GDP per capita consumption level of all data2001 127627 16629798.1 11.75686723 16.626706712002 128453 17585215.7 11.76331836 16.682569092003 129227 19888035.3 11.76932583 16.805628872004 129988 21344029.6 11.77519742 16.876282612005 130756 23523004.4 11.78108827 16.973489412006 131448 25592925.6 11.78636662 17.057826532007 132129 26861825.7 11.791534 17.106216721.Timing diagramFirst, the total population of Table 1 (end) of the annual data series {Xt}, full of energy consumption (kg of standard coal) annual data series {Yt} are drawn timing diagram, in order to observe the annual population data series {Xt} and national annual energy consumption data sequence {Yt} is stationary, by EVIEWS software output is shown below.Figure 1 of the total population (end) sequence timing diagramFigure 2 universal life energy consumption (kg of standard coal) sequence timing diagramFigure 1 is a sequence {Xt} the timing diagram, Figure 2 is a sequence {Yt} of the timing diagram.Two figures show both the total population (end) or universal life energy consumption (kg of standard coal) index showed a rising trend, the total population of the annual data series {Xt} and national annual energy consumption data sequence {Yt} not smooth, the two may have long-term cointegration relationship.2. Data smoothing(1)Sequence LogarithmFigures 1 and 2 by the intuitive discovery data sequence {Xt} and {Yt} showed a significant growth trend, a significant non-stationary sequence. Therefore, the total population of first sequence {Xt} and universal life energy consumption (kg of standard coal) {Yt}, respectively for the number of treatment to eliminate heteroscedasticity. That logx = lnXt, logy = lnYt, with a view to the target sequence into the linear trend trend sequence, by EVIEWS software operations, the number of sequence timing diagram, in which the population sequence {logx} timing diagram shown in Figure 3, the full sequence of energy consumption {logy} timing diagram shown in Figure 4.Figure3 Figure 4Figure 3 shows the total population observed sequence {logx} and universal life energy consumption (kg of standard coal) sequence {logy} index trend has been basically eliminated, the two have obvious long-term cointegration relationship, which is the transfer function modeling an important prerequisite. However, the above sequence of numbers is still non-stationary series. Respectively {logx} and {logy} sequence of ADF unit root test (Table 5 and Table 6), the test results as shown below. (2)Unit root testHere we will be on the province's total population and the whole sequence {Xt} energy consumption (kg of standard coal) sequence data {Yt} be the unit root test, the results obtained by Eviews software operation is as follows:Table 2 Of the total population sequence {logx}Obtained from Table 2: Total population sequence data {Xt} of the ADF is -0.784587, significantly larger than the 1% level in the critical test value of -4.3260, the 5% level greater than the critical value of -3.2195 testing, but also greater than 10% level in the critical test value -2.7557, so the total population of the data sequence {logx} {Xt} is a non-stationary series.Table 3 National energy consumption (kg of standard coal) unit root test {logy}Obtained from Table 3: National energy consumption (kg of standard coal) data {Yt} of the ADF is 0.489677, significantly larger than the 1% level in the critical test value of -4.3260, the 5% level greater than the critical test value of -3.2195, but also 10% greater than the critical level test value -2.7557, so the total population of the sequence {logx} data {Yt} is a non-stationary series.(3) Sequence of differentialBecause of the number of time series after still not a smooth sequence, so the need for further logarithm of the total population after the sequence {logx} and after a few of the universal life energy consumption (kg of standard coal) differential sequence data {logY} differential sequences were recorded as {▽logx} and {▽logy}. Are respectively the second-order differential of the total population of the sequence {▽logX} and second-order differential of the national energy consumption (kg of standard coal) sequence data {▽ logy} the ADF unit root test (Table 7 and Table 8), test results the following table.Table 4Table 4 shows that the total population of second-order differential sequence {▽logx} ADF value is -10.6278, apparently less than 1% level in the critical test value of -6.292057, less than the 5% level in the critical test value -4.450425 also 10% less than the level in the critical test value of -3.701534, second-order differential of the total population of the sequence {▽ logx} is a stationary sequence.Table5 5Table 5 shows that the second-order differential universal life energy consumption (kg of standard coal) {▽logy} of the ADF is -6.395029, apparently less than 1% level in the critical test value of -4.4613, less than the 5 % level of the critical test value of -3.2695, but also less than the 10% level the critical value of -2.7822 testing,universal life, second-order differential consumption of energy (kg of standard coal) {▽ logy} is a stationary sequence.3. Cointegration(1)Cointegration regressionCointegration theory in the 1980s there Engle Granger put forward specific, it is from the analysis of non-stationary time series start to explore the non-stationary variable contains the long-run equilibrium relationship between the non-stationary time series modeling provides a new solution.As the population time series {Xt} and universal life energy consumption time series {Yt} are logarithmic, the total population obtained by the analysis of time series {logX} and universal life energy consumption time series {logY} are second-order single whole sequence, so they may exist cointegration relationship. The results obtained by Eviews software operation is as follows:Table 6Obtained from Table 6:D(LNE2)= -0.054819 – 101.8623D(LOGX2)t = (-1.069855) (-1.120827)R2=0.122487 DW=1.593055(2)Check the smoothness of the residual sequenceFrom the Eviews software, get residual sequence analysis:Table 7Residual series unit root testObtained from Table 7: second-order differential value of -5.977460 ADF residuals, significantly less than 1% level in the critical test value -4.6405, less than 5% level in the critical test value of -3.3350, but also less than 10% level in the critical test value of -2.8169. Therefore, the second-order difference of the residual et is a stationary time series sequence. Expressed as follows:D(ET,2)=-0.042260-1.707007D(ET(-1),2)t = (-0.783744)(-5.977460)DW= 1.603022 EG=-5.977460,Since EG =- 5.977460, check the AFG cointegration test critical value table (N = 2, = 0.05, T = 16) received, EG value is less than the critical value, so to accept the original sequence et is stationary assumption. So you can determine the total population and energy consumption of all the people living there are two variables are long-term cointegration relationship.4. ECM model to establishThrough the above analysis, after the second-order differential of the logarithm of the total population time series {▽ logX} and second-order differential of Logarithm of of national energy consumption time series {▽ logY} is a stationary sequence, the second-order differential residuals et is also a stationary series. So that the number of second-order differential of the national energy consumption time series {▽ logY} as the dependent variable, after the second-order differential of the logarithm of the total population time series {▽logX} and second-order differential as residuals et from variable regression estimation, using Eviews software, the following findings:Table 8ECM model resultsTable 8 can be written by the ECM standard regression model, results are as follows:D(logY2)= -0.047266-154.4568D(LNP2) +0.171676D(ET2)t = (-1.469685) (-2.528562) (1.755694)R2= 0.579628 DW=1.760658ECM regression equation of the regression coefficients by a significance test, the error correction coefficient is positive, in line with forward correction mechanism. The estimation results show that the province of everyone's life changes in energy consumption depends not only on the change of the total population, but also on the previous year's total population deviation from the equilibrium level. In addition, the regression results show that short-term changes in the total population of all the people living there is a positive impact on energy consumption. Because short-term adjustment coefficient is significant, it shows that all the people living in JilinProvince annual consumption of energy in its long-run equilibrium value is the deviation can be corrected well.5. ARMA model(1) Model to identifyAfter differential differenced stationary series into stationary time series, after the analysis can be used ARMR model, the choice of using the model of everyone's life before the first stable after the annual energy consumption time series {logY} to estimate the first full life energy consumption sequence {logY} do autocorrelation and partial autocorrelation, the results of the following:Table 9{logy} of the autocorrelation and partial autocorrelation mapObtained from Table 9, the relevant figure from behind, after K = 1 in a random interval, partial autocorrelation can be seen in K = 1 after a random interval. So we can live on national energy consumption to establish the sequence {logY} ARMA (1,1) model, following on the ARMA (1,1) model parameter estimation, which results in the following table:Table 10ARMA (1,1) model parameter estimationTable 10 obtained by the ARMA (1,1) model parameter estimation is given by: D(LNE,2)=0.014184+0.008803D(LNE,2)t-1-0.858461U t-1(2)ARMA (1,2) model testModel of the residuals obtained for white noise test, if the residuals are not white noise sequence, then the need for ARMA (1,2) model for further improvement; if it is white noise process, the acceptance of the original model. ARMA (1,2) model residuals test results are as follows:Table11 ARMA (1,2) model residuals testTable 11 shows, Q statistic P value greater than 0.05, so the ARMA (1,1) model, the residual series is white noise sequence and accept the ARMA (1,1) model. Our whole life to predict changes in energy consumption, the results are as follows:Figure 5 National energy consumption forecast mapJilin Province of everyone's life through the forecast energy consumption, we can see all the people living consumption of energy is rising every year, which also shows that in the future for many years, Jilin Province, universal life energy consumption will be showing an upward trend. And because of the total population and the existence of universal life energy consumption effects of changes in the same direction, so the total population over the next many years, will continue to increase.6. ProblemsBased on the province's total population and the national energy consumption cointegration analysis of the relationship between population and energy consumption obtained between Jilin Province, there are long-term stability of the interaction and mutual promotion of the long-run equilibrium relationship. The above analysis can be more accurate understanding of the energy consumption of Jilin Province, Jilin Province put forward a better proposal on energy conservation. Moment, Jilin Province facing energy problems:(1) The heavy industry still accounts for a large proportion of;(2)The scale of energy-intensive industry, the rapid growth of production ofenergy saving effect;(3)The coal-based energy consumption is still.7.Recommendation:(1) Population control, and actively cooperate with the national policy of family planning, ease the pressure on the average population can consume.(2) Raise awareness of the importance of energy saving, the implementation of energy-saving target responsibility system, energy efficiency are implemented.Conscientiously implement the State Council issued the statistics of energy saving, monitoring and evaluation program of the three systems. Strict accountability.(3) Speed up industrial restructuring and transformation of economic development. Speed up industrial restructuring and transformation of economic development, to overcome the resource, energy and other bottlenecks, and take the high technological content, good economic returns, low resources consumption, little environmental pollution and human resources into full play to the new industrialization path.(4) Should pay attention to quality improvement and optimization of the structure, so that the final implementation of the restructuring to improve the overall quality of industrial and economic growth, quality and efficiency up.(5) To enhance the development and promotion of energy-saving technologies, strengthen energy security, promotion of renewable energy, clean energy.Adhere to technical progress and the deepening of reform and opening up the combination. To enhance the independent innovation capability as the adjustment of industrial structure, changing the growth mode of the central link, speed up the innovation system, efforts to address the constraints of the city development major science and technology. Vigorously promote the recycling economy demonstration pilot enterprises to actively carry out comprehensive utilization of resources and renewable resources recycling. And actively promote solar, wind, biogas, biodiesel and other renewable energy construction.References[1] Wang Yan, Applied time series analysis of the Chinese People's University Press, 2008.12[2] Pang Hao. Econometric Science Press, 2006.1。
大数据挖掘外文翻译文献
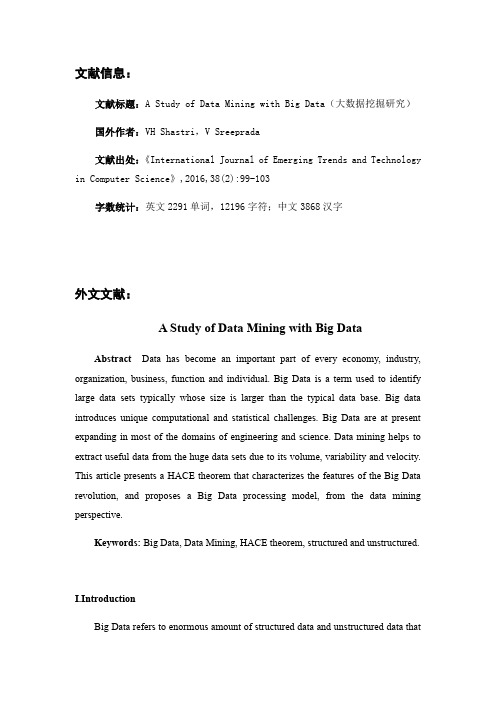
文献信息:文献标题:A Study of Data Mining with Big Data(大数据挖掘研究)国外作者:VH Shastri,V Sreeprada文献出处:《International Journal of Emerging Trends and Technology in Computer Science》,2016,38(2):99-103字数统计:英文2291单词,12196字符;中文3868汉字外文文献:A Study of Data Mining with Big DataAbstract Data has become an important part of every economy, industry, organization, business, function and individual. Big Data is a term used to identify large data sets typically whose size is larger than the typical data base. Big data introduces unique computational and statistical challenges. Big Data are at present expanding in most of the domains of engineering and science. Data mining helps to extract useful data from the huge data sets due to its volume, variability and velocity. This article presents a HACE theorem that characterizes the features of the Big Data revolution, and proposes a Big Data processing model, from the data mining perspective.Keywords: Big Data, Data Mining, HACE theorem, structured and unstructured.I.IntroductionBig Data refers to enormous amount of structured data and unstructured data thatoverflow the organization. If this data is properly used, it can lead to meaningful information. Big data includes a large number of data which requires a lot of processing in real time. It provides a room to discover new values, to understand in-depth knowledge from hidden values and provide a space to manage the data effectively. A database is an organized collection of logically related data which can be easily managed, updated and accessed. Data mining is a process discovering interesting knowledge such as associations, patterns, changes, anomalies and significant structures from large amount of data stored in the databases or other repositories.Big Data includes 3 V’s as its characteristics. They are volume, velocity and variety. V olume means the amount of data generated every second. The data is in state of rest. It is also known for its scale characteristics. Velocity is the speed with which the data is generated. It should have high speed data. The data generated from social media is an example. Variety means different types of data can be taken such as audio, video or documents. It can be numerals, images, time series, arrays etc.Data Mining analyses the data from different perspectives and summarizing it into useful information that can be used for business solutions and predicting the future trends. Data mining (DM), also called Knowledge Discovery in Databases (KDD) or Knowledge Discovery and Data Mining, is the process of searching large volumes of data automatically for patterns such as association rules. It applies many computational techniques from statistics, information retrieval, machine learning and pattern recognition. Data mining extract only required patterns from the database in a short time span. Based on the type of patterns to be mined, data mining tasks can be classified into summarization, classification, clustering, association and trends analysis.Big Data is expanding in all domains including science and engineering fields including physical, biological and biomedical sciences.II.BIG DATA with DATA MININGGenerally big data refers to a collection of large volumes of data and these data are generated from various sources like internet, social-media, business organization, sensors etc. We can extract some useful information with the help of Data Mining. It is a technique for discovering patterns as well as descriptive, understandable, models from a large scale of data.V olume is the size of the data which is larger than petabytes and terabytes. The scale and rise of size makes it difficult to store and analyse using traditional tools. Big Data should be used to mine large amounts of data within the predefined period of time. Traditional database systems were designed to address small amounts of data which were structured and consistent, whereas Big Data includes wide variety of data such as geospatial data, audio, video, unstructured text and so on.Big Data mining refers to the activity of going through big data sets to look for relevant information. To process large volumes of data from different sources quickly, Hadoop is used. Hadoop is a free, Java-based programming framework that supports the processing of large data sets in a distributed computing environment. Its distributed supports fast data transfer rates among nodes and allows the system to continue operating uninterrupted at times of node failure. It runs Map Reduce for distributed data processing and is works with structured and unstructured data.III.BIG DATA characteristics- HACE THEOREM.We have large volume of heterogeneous data. There exists a complex relationship among the data. We need to discover useful information from this voluminous data.Let us imagine a scenario in which the blind people are asked to draw elephant. The information collected by each blind people may think the trunk as wall, leg as tree, body as wall and tail as rope. The blind men can exchange information with each other.Figure1: Blind men and the giant elephantSome of the characteristics that include are:i.Vast data with heterogeneous and diverse sources: One of the fundamental characteristics of big data is the large volume of data represented by heterogeneous and diverse dimensions. For example in the biomedical world, a single human being is represented as name, age, gender, family history etc., For X-ray and CT scan images and videos are used. Heterogeneity refers to the different types of representations of same individual and diverse refers to the variety of features to represent single information.ii.Autonomous with distributed and de-centralized control: the sources are autonomous, i.e., automatically generated; it generates information without any centralized control. We can compare it with World Wide Web (WWW) where each server provides a certain amount of information without depending on other servers.plex and evolving relationships: As the size of the data becomes infinitely large, the relationship that exists is also large. In early stages, when data is small, there is no complexity in relationships among the data. Data generated from social media and other sources have complex relationships.IV.TOOLS:OPEN SOURCE REVOLUTIONLarge companies such as Facebook, Yahoo, Twitter, LinkedIn benefit and contribute work on open source projects. In Big Data Mining, there are many open source initiatives. The most popular of them are:Apache Mahout:Scalable machine learning and data mining open source software based mainly in Hadoop. It has implementations of a wide range of machine learning and data mining algorithms: clustering, classification, collaborative filtering and frequent patternmining.R: open source programming language and software environment designed for statistical computing and visualization. R was designed by Ross Ihaka and Robert Gentleman at the University of Auckland, New Zealand beginning in 1993 and is used for statistical analysis of very large data sets.MOA: Stream data mining open source software to perform data mining in real time. It has implementations of classification, regression; clustering and frequent item set mining and frequent graph mining. It started as a project of the Machine Learning group of University of Waikato, New Zealand, famous for the WEKA software. The streams framework provides an environment for defining and running stream processes using simple XML based definitions and is able to use MOA, Android and Storm.SAMOA: It is a new upcoming software project for distributed stream mining that will combine S4 and Storm with MOA.Vow pal Wabbit: open source project started at Yahoo! Research and continuing at Microsoft Research to design a fast, scalable, useful learning algorithm. VW is able to learn from terafeature datasets. It can exceed the throughput of any single machine networkinterface when doing linear learning, via parallel learning.V.DATA MINING for BIG DATAData mining is the process by which data is analysed coming from different sources discovers useful information. Data Mining contains several algorithms which fall into 4 categories. They are:1.Association Rule2.Clustering3.Classification4.RegressionAssociation is used to search relationship between variables. It is applied in searching for frequently visited items. In short it establishes relationship among objects. Clustering discovers groups and structures in the data.Classification deals with associating an unknown structure to a known structure. Regression finds a function to model the data.The different data mining algorithms are:Table 1. Classification of AlgorithmsData Mining algorithms can be converted into big map reduce algorithm based on parallel computing basis.Table 2. Differences between Data Mining and Big DataVI.Challenges in BIG DATAMeeting the challenges with BIG Data is difficult. The volume is increasing every day. The velocity is increasing by the internet connected devices. The variety is also expanding and the organizations’ capability to capture and process the data is limited.The following are the challenges in area of Big Data when it is handled:1.Data capture and storage2.Data transmission3.Data curation4.Data analysis5.Data visualizationAccording to, challenges of big data mining are divided into 3 tiers.The first tier is the setup of data mining algorithms. The second tier includesrmation sharing and Data Privacy.2.Domain and Application Knowledge.The third one includes local learning and model fusion for multiple information sources.3.Mining from sparse, uncertain and incomplete data.4.Mining complex and dynamic data.Figure 2: Phases of Big Data ChallengesGenerally mining of data from different data sources is tedious as size of data is larger. Big data is stored at different places and collecting those data will be a tedious task and applying basic data mining algorithms will be an obstacle for it. Next we need to consider the privacy of data. The third case is mining algorithms. When we are applying data mining algorithms to these subsets of data the result may not be that much accurate.VII.Forecast of the futureThere are some challenges that researchers and practitioners will have to deal during the next years:Analytics Architecture:It is not clear yet how an optimal architecture of analytics systems should be to deal with historic data and with real-time data at the same time. An interesting proposal is the Lambda architecture of Nathan Marz. The Lambda Architecture solves the problem of computing arbitrary functions on arbitrary data in real time by decomposing the problem into three layers: the batch layer, theserving layer, and the speed layer. It combines in the same system Hadoop for the batch layer, and Storm for the speed layer. The properties of the system are: robust and fault tolerant, scalable, general, and extensible, allows ad hoc queries, minimal maintenance, and debuggable.Statistical significance: It is important to achieve significant statistical results, and not be fooled by randomness. As Efron explains in his book about Large Scale Inference, it is easy to go wrong with huge data sets and thousands of questions to answer at once.Distributed mining: Many data mining techniques are not trivial to paralyze. To have distributed versions of some methods, a lot of research is needed with practical and theoretical analysis to provide new methods.Time evolving data: Data may be evolving over time, so it is important that the Big Data mining techniques should be able to adapt and in some cases to detect change first. For example, the data stream mining field has very powerful techniques for this task.Compression: Dealing with Big Data, the quantity of space needed to store it is very relevant. There are two main approaches: compression where we don’t loose anything, or sampling where we choose what is thedata that is more representative. Using compression, we may take more time and less space, so we can consider it as a transformation from time to space. Using sampling, we are loosing information, but the gains inspace may be in orders of magnitude. For example Feldman et al use core sets to reduce the complexity of Big Data problems. Core sets are small sets that provably approximate the original data for a given problem. Using merge- reduce the small sets can then be used for solving hard machine learning problems in parallel.Visualization: A main task of Big Data analysis is how to visualize the results. As the data is so big, it is very difficult to find user-friendly visualizations. New techniques, and frameworks to tell and show stories will be needed, as for examplethe photographs, infographics and essays in the beautiful book ”The Human Face of Big Data”.Hidden Big Data: Large quantities of useful data are getting lost since new data is largely untagged and unstructured data. The 2012 IDC studyon Big Data explains that in 2012, 23% (643 exabytes) of the digital universe would be useful for Big Data if tagged and analyzed. However, currently only 3% of the potentially useful data is tagged, and even less is analyzed.VIII.CONCLUSIONThe amounts of data is growing exponentially due to social networking sites, search and retrieval engines, media sharing sites, stock trading sites, news sources and so on. Big Data is becoming the new area for scientific data research and for business applications.Data mining techniques can be applied on big data to acquire some useful information from large datasets. They can be used together to acquire some useful picture from the data.Big Data analysis tools like Map Reduce over Hadoop and HDFS helps organization.中文译文:大数据挖掘研究摘要数据已经成为各个经济、行业、组织、企业、职能和个人的重要组成部分。
数据分析外文文献+翻译

数据分析外文文献+翻译文献1:《数据分析在企业决策中的应用》该文献探讨了数据分析在企业决策中的重要性和应用。
研究发现,通过数据分析可以获取准确的商业情报,帮助企业更好地理解市场趋势和消费者需求。
通过对大量数据的分析,企业可以发现隐藏的模式和关联,从而制定出更具竞争力的产品和服务策略。
数据分析还可以提供决策支持,帮助企业在不确定的环境下做出明智的决策。
因此,数据分析已成为现代企业成功的关键要素之一。
文献2:《机器研究在数据分析中的应用》该文献探讨了机器研究在数据分析中的应用。
研究发现,机器研究可以帮助企业更高效地分析大量的数据,并从中发现有价值的信息。
机器研究算法可以自动研究和改进,从而帮助企业发现数据中的模式和趋势。
通过机器研究的应用,企业可以更准确地预测市场需求、优化业务流程,并制定更具策略性的决策。
因此,机器研究在数据分析中的应用正逐渐受到企业的关注和采用。
文献3:《数据可视化在数据分析中的应用》该文献探讨了数据可视化在数据分析中的重要性和应用。
研究发现,通过数据可视化可以更直观地呈现复杂的数据关系和趋势。
可视化可以帮助企业更好地理解数据,发现数据中的模式和规律。
数据可视化还可以帮助企业进行数据交互和决策共享,提升决策的效率和准确性。
因此,数据可视化在数据分析中扮演着非常重要的角色。
翻译文献1标题: The Application of Data Analysis in Business Decision-making The Application of Data Analysis in Business Decision-making文献2标题: The Application of Machine Learning in Data Analysis The Application of Machine Learning in Data Analysis文献3标题: The Application of Data Visualization in Data Analysis The Application of Data Visualization in Data Analysis翻译摘要:本文献研究了数据分析在企业决策中的应用,以及机器研究和数据可视化在数据分析中的作用。
数据挖掘外文文献翻译中英文
数据挖掘外文文献翻译(含:英文原文及中文译文)英文原文What is Data Mining?Simply stated, data mining refers to extracting or “mining” knowledge from large amounts of data. The term is actually a misnomer. Remember that the mining of gold from rocks or sand is referred to as gold mining rather than rock or sand mining. Thus, “data mining” should have been more appropriately named “knowledge mining from data”, which is unfortunately somewhat long. “Knowledge mining”, a shorter term, may not reflect the emphasis on mining from large amounts of data. Nevertheless, mining is a vivid term characterizing the process that finds a small set of precious nuggets from a great deal of raw material. Thus, such a misnomer which carries both “data” and “mining” became a popular choice . There are many other terms carrying a similar or slightly different meaning to data mining, such as knowledge mining from databases, knowledge extraction, data / pattern analysis, data archaeology, and data dredging.Many people treat data mining as a synonym for another popularly used term, “Knowledge Discovery in Databases”, or KDD. Alternatively, others view data mining as simply an essential step in the process ofknowledge discovery in databases. Knowledge discovery consists of an iterative sequence of the following steps:· data cleaning: to remove noise or irrelevant data, · data integration: where multiple data sources may be combined,·data selection : where data relevant to the analysis task are retrieved from the database,· data transformati on : where data are transformed or consolidated into forms appropriate for mining by performing summary or aggregation operations, for instance,·data mining: an essential process where intelligent methods are applied in order to extract data patterns, · pattern evaluation: to identify the truly interesting patterns representing knowledge based on some interestingness measures, and·knowledge presentation: where visualization and knowledge representation techniques are used to present the mined knowledge to the user .The data mining step may interact with the user or a knowledge base. The interesting patterns are presented to the user, and may be stored as new knowledge in the knowledge base. Note that according to this view, data mining is only one step in the entire process, albeit an essential one since it uncovers hidden patterns for evaluation.We agree that data mining is a knowledge discovery process.However, in industry, in media, and in the database research milieu, the term “data mining” is becoming mo re popular than the longer term of “knowledge discovery in databases”. Therefore, in this book, we choose to use the term “data mining”. We adopt a broad view of data mining functionality: data mining is the process of discovering interesting knowledge from large amounts of data stored either in databases, data warehouses, or other information repositories.Based on this view, the architecture of a typical data mining system may have the following major components:1. Database, data warehouse, or other information repository. This is one or a set of databases, data warehouses, spread sheets, or other kinds of information repositories. Data cleaning and data integration techniques may be performed on the data.2. Database or data warehouse server. The database or data warehouse server is responsible for fetching the relevant data, based on the user’s data mining request.3. Knowledge base. This is the domain knowledge that is used to guide the search, or evaluate the interestingness of resulting patterns. Such knowledge can include concept hierarchies, used to organize attributes or attribute values into different levels of abstraction. Knowledge such as user beliefs, which can be used to assess a pattern’s interestingness based on its unexpectedness, may also be included. Otherexamples of domain knowledge are additional interestingness constraints or thresholds, and metadata (e.g., describing data from multiple heterogeneous sources).4. Data mining engine. This is essential to the data mining system and ideally consists of a set of functional modules for tasks such as characterization, association analysis, classification, evolution and deviation analysis.5. Pattern evaluation module. This component typically employs interestingness measures and interacts with the data mining modules so as to focus the search towards interesting patterns. It may access interestingness thresholds stored in the knowledge base. Alternatively, the pattern evaluation module may be integrated with the mining module, depending on the implementation of the data mining method used. For efficient data mining, it is highly recommended to push the evaluation of pattern interestingness as deep as possible into the mining process so as to confine the search to only the interesting patterns.6. Graphical user interface. This module communicates between users and the data mining system, allowing the user to interact with the system by specifying a data mining query or task, providing information to help focus the search, and performing exploratory data mining based on the intermediate data mining results. In addition, this component allows the user to browse database and data warehouse schemas or datastructures, evaluate mined patterns, and visualize the patterns in different forms.From a data warehouse perspective, data mining can be viewed as an advanced stage of on-1ine analytical processing (OLAP). However, data mining goes far beyond the narrow scope of summarization-style analytical processing of data warehouse systems by incorporating more advanced techniques for data understanding.While there may be many “data mining systems” on the market, not all of them can perform true data mining. A data analysis system that does not handle large amounts of data can at most be categorized as a machine learning system, a statistical data analysis tool, or an experimental system prototype. A system that can only perform data or information retrieval, including finding aggregate values, or that performs deductive query answering in large databases should be more appropriately categorized as either a database system, an information retrieval system, or a deductive database system.Data mining involves an integration of techniques from mult1ple disciplines such as database technology, statistics, machine learning, high performance computing, pattern recognition, neural networks, data visualization, information retrieval, image and signal processing, and spatial data analysis. We adopt a database perspective in our presentation of data mining in this book. That is, emphasis is placed on efficient andscalable data mining techniques for large databases. By performing data mining, interesting knowledge, regularities, or high-level information can be extracted from databases and viewed or browsed from different angles. The discovered knowledge can be applied to decision making, process control, information management, query processing, and so on. Therefore, data mining is considered as one of the most important frontiers in database systems and one of the most promising, new database applications in the information industry.A classification of data mining systemsData mining is an interdisciplinary field, the confluence of a set of disciplines, including database systems, statistics, machine learning, visualization, and information science. Moreover, depending on the data mining approach used, techniques from other disciplines may be applied, such as neural networks, fuzzy and or rough set theory, knowledge representation, inductive logic programming, or high performance computing. Depending on the kinds of data to be mined or on the given data mining application, the data mining system may also integrate techniques from spatial data analysis, Information retrieval, pattern recognition, image analysis, signal processing, computer graphics, Web technology, economics, or psychology.Because of the diversity of disciplines contributing to data mining, data mining research is expected to generate a large variety of datamining systems. Therefore, it is necessary to provide a clear classification of data mining systems. Such a classification may help potential users distinguish data mining systems and identify those that best match their needs. Data mining systems can be categorized according to various criteria, as follows.1) Classification according to the kinds of databases mined. A data mining system can be classified according to the kinds of databases mined. Database systems themselves can be classified according to different criteria (such as data models, or the types of data or applications involved), each of which may require its own data mining technique. Data mining systems can therefore be classified accordingly.For instance, if classifying according to data models, we may have a relational, transactional, object-oriented, object-relational, or data warehouse mining system. If classifying according to the special types of data handled, we may have a spatial, time -series, text, or multimedia data mining system , or a World-Wide Web mining system . Other system types include heterogeneous data mining systems, and legacy data mining systems.2) Classification according to the kinds of knowledge mined. Data mining systems can be categorized according to the kinds of knowledge they mine, i.e., based on data mining functionalities, such as characterization, discrimination, association, classification, clustering,trend and evolution analysis, deviation analysis , similarity analysis, etc.A comprehensive data mining system usually provides multiple and/or integrated data mining functionalities.Moreover, data mining systems can also be distinguished based on the granularity or levels of abstraction of the knowledge mined, including generalized knowledge(at a high level of abstraction), primitive-level knowledge(at a raw data level), or knowledge at multiple levels (considering several levels of abstraction). An advanced data mining system should facilitate the discovery of knowledge at multiple levels of abstraction.3) Classification according to the kinds of techniques utilized.Data mining systems can also be categorized according to the underlying data mining techniques employed. These techniques can be described according to the degree of user interaction involved (e.g., autonomous systems, interactive exploratory systems, query-driven systems), or the methods of data analysis employed(e.g., database-oriented or data warehouse-oriented techniques, machine learning, statistics, visualization, pattern recognition, neural networks, and so on ) .A sophisticated data mining system will often adopt multiple data mining techniques or work out an effective, integrated technique which combines the merits of a few individual approaches.中文译文什么是数据挖掘?简而言之,数据挖掘是指从大量数据中提取或“挖掘”知识。
- 1、下载文档前请自行甄别文档内容的完整性,平台不提供额外的编辑、内容补充、找答案等附加服务。
- 2、"仅部分预览"的文档,不可在线预览部分如存在完整性等问题,可反馈申请退款(可完整预览的文档不适用该条件!)。
- 3、如文档侵犯您的权益,请联系客服反馈,我们会尽快为您处理(人工客服工作时间:9:00-18:30)。
不确定性数据挖掘外文翻译文献(文档含中英文对照即英文原文和中文翻译)译文:不确定性数据挖掘:一种新的研究方向摘要由于不精确测量、过时的来源或抽样误差等原因,数据不确定性常常出现在真实世界应用中。
目前,在数据库数据不确定性处理领域中,很多研究结果已经被发表。
我们认为,当不确定性数据被执行数据挖掘时,数据不确定性不得不被考虑在内,才能获得高质量的数据挖掘结果。
我们称之为“不确定性数据挖掘”问题。
在本文中,我们为这个领域可能的研究方向提出一个框架。
同时,我们以UK-means 聚类算法为例来阐明传统K-means算法怎么被改进来处理数据挖掘中的数据不确定性。
1.引言由于测量不精确、抽样误差、过时数据来源或其他等原因,数据往往带有不确定性性质。
特别在需要与物理环境交互的应用中,如:移动定位服务[15]和传感器监测[3]。
例如:在追踪移动目标(如车辆或人)的情境中,数据库是不可能完全追踪到所有目标在所有瞬间的准确位置。
因此,每个目标的位置的变化过程是伴有不确定性的。
为了提供准确地查询和挖掘结果,这些导致数据不确定性的多方面来源不得不被考虑。
在最近几年里,已有在数据库中不确定性数据管理方面的大量研究,如:数据库中不确定性的表现和不确定性数据查询。
然而,很少有研究成果能够解决不确定性数据挖掘的问题。
我们注意到,不确定性使数据值不再具有原子性。
对于使用传统数据挖掘技术,不确定性数据不得不被归纳为原子性数值。
再以追踪移动目标应用为例,一个目标的位置可以通过它最后的记录位置或通过一个预期位置(如果这个目标位置概率分布被考虑到)归纳得到。
不幸地是,归纳得到的记录与真实记录之间的误差可能会严重也影响挖掘结果。
图1阐明了当一种聚类算法被应用追踪带有不确定性位置的移动目标时所发生的问题。
图1(a)表示一组目标的真实数据,而图1(b)则表示记录的已过时的这些目标的位置。
如果这些实际位置是有效的话,那么它们与那些从过时数据值中得到的数据集群有明显差异。
如果我们仅仅依靠记录的数据值,那么将会很多的目标可能被置于错误的数据集群中。
更糟糕地是,一个群中的每一个成员都有可能改变群的质心,因此导致更多的错误。
图1 数据图图1.(a)表示真实数据划分成的三个集群(a、b、c)。
(b)表示的有些目标(隐藏的)的记录位置与它们真实的数据不一样,因此形成集群a’、b’、c’和c”。
注意到a’集群中比a集群少了一个目标,而b’集群中比b集群多一个目标。
同时,c也误拆分会为c’和c”。
(c)表示方向不确定性被考虑来推测出集群a’,b’和c。
这种聚类产生的结果比(b)结果更加接近(a)。
我们建议将不确定性数据的概率密度函数等不确定性信息与现有的数据挖掘方法结合,这样在实际数据可利用于数据挖掘的情况下会使得挖掘结果更接近从真实数据中获得的结果。
本文研究了不确定性怎么通过把数据聚类当成一种激励范例使用使得不确定性因素与数据挖掘相结合。
我们称之为不确定性数据挖掘问题。
在本文中,我们为这个领域可能的研究方向提出一个框架。
文章接下来的结构如下。
第二章是有关工作综述。
在第三章中,我们定义了不确定性数据聚类问题和介绍我们提议的算法。
第四章将呈现我们算法在移动目标数据库的应用。
详细地的实习结果将在第五章解释。
最后在第六章总结论文并提出可能的研究方向。
2.研究背景近年来,人们对数据不确定性管理有明显的研究兴趣。
数据不确定性被为两类,即已存在的不确定生和数值不确定性。
在第一种类型中,不管目标或数据元组存在是否,数据本身就已经存在不确定性了。
例如,关系数据库中的元组可能与能表现它存在信任度的一个概率值相关联[1,2]。
在数据不确定性类型中,一个数据项作为一个封闭的区域,与其值的概率密度函数(PDF)限定了其可能的值[3,4,12,15]。
这个模型可以被应用于量化在不断变化的环境下的位置或传感器数据的不精密度。
在这个领域里,大量的工作都致力于不精确查找。
例如,在[5]中,解决不确定性数据范围查询的索引方案已经被提出。
在[4]中,同一作者提出了解决邻近等查询的方案。
注意到,所有工作已经把不确定性数据管理的研究结果应用于简化数据库查询中,而不是应用于相对复杂的数据分析和挖掘问题中。
在数据挖掘研究中,聚类问题已经被很好的研究。
一个标准的聚类过程由5个主要步骤组成:模式表示,模式定义,模式相似度量的定义,聚类或分组,数据抽象和造工评核[10]。
只有小部分关于数据挖掘或不确定性数据聚类的研究被发表。
Hamdan与Govaert已经通过运用EM算法解决使混合密度适合不确定性数据聚类的问题 [8]。
然而,这个模型不能任意地应用于其他聚类算法因为它相当于为EM定制的。
在数据区间的聚类也同样被研究。
像城区距离或明考斯基距离等不同距离测量也已经被用来衡量两个区间的相似度。
在这些测量的大多数中,区间的概率密度函数并没有被考虑到。
另外一个相关领域的研究就是模糊聚类。
在模糊逻辑中的模糊聚类研究已经很久远了[13]。
在模糊聚类中,一个是数据簇由一组目标的模糊子集组成。
每个目标与每个簇都有一个“归属关系度”。
换言之,一个目标可以归属于多个簇,与每个簇均有一个度。
模糊C均值聚类算法是一种最广泛的使用模糊聚类方法[2,7]。
不同的模糊聚类方法已被应用在一般数据或模糊数据中来产生的模糊数据簇。
他们研究工作是基于一个模糊数据模型的,而我们工作的开展则基于移动目标的不确定性模型。
3.不确定数据的分类在图2中,我们提出一种分类法来阐述数据挖掘方法怎么根据是否考虑数据不准确性来分类。
有很多通用的数据挖掘技术,如: 关联规则挖掘、数据分类、数据聚类。
当然这些技术需要经过改进才能用于处理不确定性技术。
此外,我们区分出数据聚类的两种类型:硬聚类和模糊聚类。
硬聚类旨在通过考虑预期的数据来提高聚类的准确性。
另一方面,模糊聚类则表示聚类的结果为一个“模糊”表格。
模糊聚类的一个例子是每个数据项被赋予一个被分配给数据簇的任意成员的概率。
图2. 不确定性数据挖掘的一种分类例如,当不确定性被考虑时,会发生一个有意思的问题,即如何在数据集中表示每个元组和关联的不确定性。
而且,由于支持和其他指标的概念需要重新定义,不得不考虑改进那些著名的关联规则挖掘算法(如Apriori)。
同样地,在数据分类和数据聚集中,传统算法由于未将数据不确定性考虑在内而导致不能起作用。
不得不对聚类质心、两个目标的距离、或目标与质心的距离等重要度量作重新定义和进行更深的研究。
4.不确定性数据聚类实例在这个章节中,我们将以不确定性数据挖掘的例子为大家介绍我们在不确定性数据聚类中的研究工作。
这将阐明我们在改进传统数据挖掘算法以适合不确定性数据问题上的想法。
4.1 问题定义用S 表示V 维向量x i 的集合,其中i=1到n ,这些向量表示在聚类应用中被考虑的所有记录的属性值。
每个记录o i 与一个概率密度函数f i (x)相联系,这个函数就是o i 属性值x 在时间t 时刻的概率密度函数。
我们没有干涉这个不确定性函数的实时变化,或记录的概率密度函数是什么。
平均密度函数就是一个概率密度函数的例子,它描述“大量不确定性”情景中是最糟的情况[3]。
另一个常用的就是高斯分布函数,它能够用于描述测量误差[12,15]。
聚类问题就是在数据集簇C j (j 从1到K )找到一个数据集C ,其中C j 由基于相似性的平均值c j 构成。
不同的聚类算法对应不对的目标函数,但是大意都是最小化同一数据集目标间的距离和最大化不同数据集目标间的距离。
数据集内部距离最小化也被视为每个数据点之间距离x i 以及x i 与对应的C j 中平均值c j 距离的最小化。
在论文中,我们只考虑硬聚类,即,每个目标只分配给一个一个集群的一个元素。
4.2 均值聚类在精确数据中的应用这个传统的均值聚类算法目的在于找到K(也就是由平均值c j 构成数据集簇C j )中找到一个数据集C 来最小化平方误差总和(SSE )。
平方误差总和通常计算如下:∑∑=∈-K j x i j ji x c 1C 2 (1)|| . ||表示一个数据点x i 与数据集平均值c j 的距离试题。
例如,欧氏距离定义为:∑=-=-V i i i y x y x 12(2)一个数据集C i 的平均值(质心)由下面的向量公式来定义:∑∈=j C i i j i x C c 1 (3)均值聚类算法如下:1. Assign initial values for cluster means c 1 to c K2. repeat3. for i = 1 to n do4. Assign each data point x i to cluster C j where || c j - x i || is the minimum.5. end for6. for j = 1 to K do7. Recalculate cluster mean c j of cluster C j8. end for9. until convergence10. return C收敛可能基于不同的质心来确定。
一些收敛性判别规则例子包括:(1)当平方误差总和小于某一用户专用临界值,(2)当在一次迭代中没有一个目标再分配给不同的数据集和(3)当迭代次数还达到预期的定义的最大值。
4.3 K-means 聚类在不确定性数据中的应用为了在聚类过程中考虑数据不确定性,我们提出一种算法来实现最小化期望平方误差总和E(SSE)的目标。
注意到一个数据对象x i 由一个带有不确定性概率密度f(x i )的不确定性区域决定。
给定一组数据群集,期望平方误差总和可以计算如下:()ii K j C i ij Kj C i ij Kj C i i j dx x f x c x c E x c E j jj )(121212∑∑∑∑∑∑=∈=∈=∈-=-=⎪⎪⎭⎫ ⎝⎛- (4) 数据集平均值可以如下给出: ()∑⎰∑∑∈∈∈==⎪⎪⎭⎫ ⎝⎛=j jj C i ii i j C i i j C i i j j dx x f x C x E C x C E c )(111 (5) 我们到此将提出一种新K-means 算法,即UK-means ,来实现不确定性数据聚类。
1. Assign initial values for cluster means c 1 to c K2. repeat3. for i = 1 to n do4. Assign each data point x i to cluster C j where E(|| c j - x i ||) is the minimum.5. end for6. for j = 1 to K do7. Recalculate cluster mean c j of cluster C j8. end for9. until convergence10. return CUK-mean 聚类算法与K-means 聚类算法的最大不同点在于距离和群集的计算。