流程图作文-8.10
雅思小作文范文-流程图
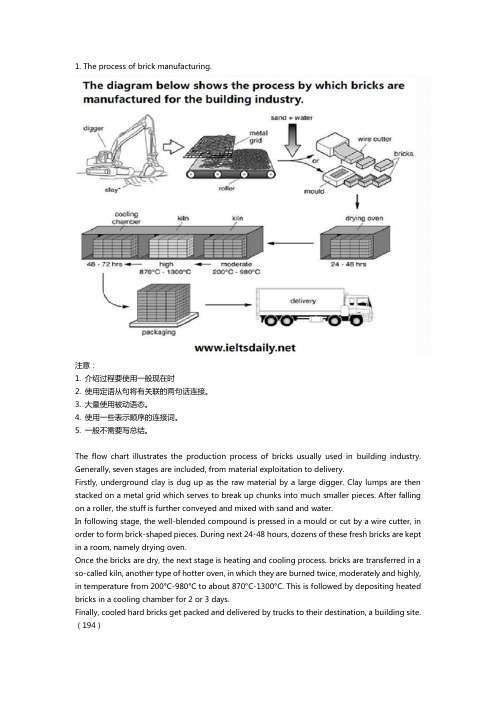
1. The process of brick manufacturing.注意:1. 介绍过程要使用一般现在时2. 使用定语从句将有关联的两句话连接。
3. 大量使用被动语态。
4. 使用一些表示顺序的连接词。
5. 一般不需要写总结。
The flow chart illustrates the production process of bricks usually used in building industry. Generally, seven stages are included, from material exploitation to delivery.Firstly, underground clay is dug up as the raw material by a large digger. Clay lumps are then stacked on a metal grid which serves to break up chunks into much smaller pieces. After falling on a roller, the stuff is further conveyed and mixed with sand and water.In following stage, the well-blended compound is pressed in a mould or cut by a wire cutter, in order to form brick-shaped pieces. During next 24-48 hours, dozens of these fresh bricks are kept in a room, namely drying oven.Once the bricks are dry, the next stage is heating and cooling process. bricks are transferred in a so-called kiln, another type of hotter oven, in which they are burned twice, moderately and highly, in temperature from 200°C-980°C to about 870°C-1300°C. This is followed by depositing heated bricks in a cooling chamber for 2 or 3 days.Finally, cooled hard bricks get packed and delivered by trucks to their destination, a building site.(194)2. The production of steam using a gas cooled nuclear reactor.1. 看懂基本过程和原理,定位流程的起点和终点。
做流程图的实验感悟

做流程图的实验感悟英文回答:Creating a flowchart is a valuable experience that provides insights into the complexities of a process and enhances problem-solving abilities. It involves breaking down a process into its constituent steps, identifying key decision points, and visualizing the flow of information and activities.Through the process of flowcharting, individuals gain a structured understanding of the process, enabling them to identify potential inefficiencies, bottlenecks, and areas for improvement. It allows for a visual representation of the process, making it easier to analyze and communicate to others.Furthermore, flowcharting fosters critical thinking and logical reasoning. It requires individuals to analyze the process thoroughly, identify logical dependencies betweensteps, and consider alternative paths. This enhances problem-solving skills by encouraging a systematic and analytical approach.中文回答:绘制流程图是一种宝贵的经历,它让人们深入了解流程的复杂性,并增强解决问题的能力。
流程图相关英语作文

流程图相关英语作文Title: The Importance and Application of Flowcharts。
Flowcharts are essential tools in various fields, providing a visual representation of processes, systems, or workflows. They play a crucial role in organizing, understanding, and communicating complex information. This essay explores the significance of flowcharts and their applications across different domains.Firstly, flowcharts serve as a universal language for conveying processes and procedures. Regardless of language barriers, individuals can interpret a flowchart's symbols and understand the sequence of steps involved in a process. This universality makes flowcharts an effective communication tool in multicultural and multinational environments.Moreover, flowcharts enhance clarity and comprehension. By breaking down complex processes into manageable stepsand illustrating decision points, flowcharts simplify intricate concepts. Whether used for training purposes or troubleshooting procedures, flowcharts enable individuals to grasp information quickly and accurately.In addition to their communicative benefits, flowcharts aid in process optimization and efficiency improvement. By visualizing workflows, stakeholders can identify bottlenecks, redundancies, or inefficiencies within a system. This insight empowers organizations to streamline processes, allocate resources effectively, and enhance overall productivity.Furthermore, flowcharts facilitate problem-solving and decision-making processes. When faced with a challenge or dilemma, individuals can refer to a flowchart to determine the appropriate course of action. The structured layout of a flowchart guides users through logical steps, helping them arrive at solutions efficiently.The versatility of flowcharts extends across various industries and sectors. In the field of softwaredevelopment, flowcharts are instrumental in designing algorithms, defining software architecture, and mapping out user interfaces. Similarly, in manufacturing and production environments, flowcharts aid in optimizing assembly lines, inventory management, and quality control processes.In project management, flowcharts assist in planning, scheduling, and tracking project milestones. They visualize the sequential flow of tasks, dependencies between activities, and critical paths. Project managers rely on flowcharts to ensure projects stay on track and meet deadlines effectively.Furthermore, flowcharts find applications in healthcare, where they depict patient care pathways, treatment protocols, and medical decision-making processes. By visualizing healthcare workflows, clinicians can enhance patient safety, optimize resource utilization, and improve overall quality of care.In the realm of education, flowcharts are valuable instructional tools for explaining complex concepts,illustrating problem-solving strategies, and guiding students through procedural tasks. Teachers utilize flowcharts to engage students visually and enhance their understanding of academic subjects.Overall, flowcharts play a vital role in organizing information, facilitating communication, optimizing processes, and guiding decision-making across diverse domains. Their universal appeal, clarity-enhancing features, and versatility make them indispensable tools in today's complex and dynamic world.In conclusion, flowcharts represent more than just graphical representations of processes; they are powerful instruments for fostering understanding, efficiency, and innovation. Whether in business, technology, healthcare, education, or any other field, flowcharts continue to shape the way we visualize, analyze, and improve processes. Embracing the utility of flowcharts enables individuals and organizations to navigate complexity with clarity and confidence.。
雅思作文电路板生产流程图

雅思作文电路板生产流程图英文回答:Circuit Board Production Process Flowchart: A Comprehensive Overview.Preparation.1. Design and layout: Engineers conceptualize anddesign the circuit board layout, including component placement and routing.2. Material selection: Appropriate materials are chosen for the board, taking into consideration factors such as electrical properties, thermal conductivity, and durability.3. Artwork Generation: The design is converted into computer-aided design (CAD) files for manufacturing.Manufacturing.1. Fabrication:Photolithography: A photosensitive layer is applied to the base material, and UV light is used to expose specific areas based on the CAD files.Etching: Exposed areas are etched away, leaving the desired copper circuitry.2. Drilling: Holes are drilled into the board for component mounting and interconnections.3. Plating: Copper plating is applied to the exposed circuitry to enhance conductivity and solderability.4. Solder Mask Application: A protective solder mask is applied to the board, leaving exposed areas for soldering components.5. Silkscreen Printing: Component reference numbers and other markings are printed on the board.Assembly.1. Component Placement: Electronic components areplaced on the board using automated pick-and-place machines or manual assembly.2. Soldering: Components are soldered to the boardusing various techniques, including wave soldering, reflow soldering, and hand soldering.3. Inspection and Testing: Automated optical inspection (AOI) and electrical tests are performed to ensure theboard meets quality standards and specifications.4. Programming: Firmware or software may be programmed into programmable devices on the board.Finishing.1. Conformal Coating: A protective coating is appliedto the board to enhance resistance to environmental factors,such as moisture and corrosion.2. Packaging: The completed circuit board is packaged for storage or shipment.中文回答:电路板生产流程图,全方位概述。
雅思写作小作文(流程图)
You should spend about 20 minutes on this task.
The picture below shows the recycling process of wasted glass bottles.
Summarize the information by selecting and reporting the main features, and make comparisons where relevant. Write at least 150 words
第三段:结尾段
The above is the whole procedure of making and recycling glass bottles.
流程图常用衔接词
第一步 in the first stage/step at first initially first of all to begin with
流程图必备词汇
v. 包装 v. 生育 This tree bears well. v. 成熟 maturity n. v. 交配 Birds mate in the spring. v. 产卵 The frogs spawn in the lake. v. 存放 deposit eggs 产卵 v. 迁徙 migration n. adj. 固态的 adj. 液态的
流程图
流程图的文章结构
第一段 中间段 尾段
文章结构
介绍流程图是做什么的 详细的介绍每一步的原料,变化,过程。
简单总结(没有也可以)
开头段
The picture below shows the recycling process of wasted glass bottles.
傅阳小作文——流程图

• This diagram shows the constituent parts of a cell and how the genetic information within a cell, which is stored in chromosomes, can be transferred to another cell to complete the process of genetic modification.
• The chart describes how the process of genetic modification is completed.
• the constituent parts (内部(nèibù)构造) of a cell
•
第十九页,共40页。
• To begin the genetic engineering process, first of
第十五页,共40页。
试验(shìyàn)intro 和 conclusion
• The chart describes how water is obtained outdoors.
• Thus, water is collected successfully through evaporation from green plants.
Done= hung(挂),dug(挖),cut(剪), laid , turned on(打开(dǎ kāi)),open,filled, removed, put, pasted,covered, uncovered…….. are applied=复杂的做(用)法
第九页,共40页。
• 为了什么目的(mùdì)(in order to+ 主动语态) • and stones are applied on both sides of the sheet
雅思小作文流程图类题目范文及解析
雅思小作文流程图类题目范文及解析雅思小作文流程图类题目范文及解析,一起来学习一下吧,下面就和大家分享,来欣赏一下吧。
雅思小作文流程图类题目范文及解析雅思小作文流程图类题目范文及解析为大家带来雅思小作文当中一类较有难度的图表——流程图类的小作文的范文以及解析。
流程图顾名思义就是对某一有时间和步骤先后顺序的行为进行步骤的拆解,并配上相应的文字和解说而生成的图表。
我们在处理流程图类图表作文是应该怎么写,请看下文。
上图来自网络主题:家居设计题型:流程图The diagrams below show some principles of house design for cool and for warm climates.满分范文:The diagrams show how house designs differ according to climate.这些图表显示房子的设计因气候而不同。
The most noticeable difference between houses designed for cool and warm climates is in the shape of the roof. The designs also differ with regard to the windows and the use of insulation.为凉爽和温暖气候设计的房子之间最明显的区别是屋顶的形状。
在窗户和保温材料的使用方面,设计也有所不同。
We can see that the cool climate house has a high-angled roof, which allows sunlight to enter through the window. By contrast, the roof of the warm climate house has a peak in the middle and roof overhangs to shade the windows. Insulation and thermal building materials are used in cool climates to reduce heat loss, whereas insulation and reflective materials are used to keep the heat out in warm climates.我们可以看到凉爽的气候房子有一个高角度的屋顶,它允许阳光通过窗户进入。
雅思写作小作文范文 雅思写作流程图flow chart 水循环water cycle.doc
雅思写作小作文范文雅思写作流程图flow chart 水循环water cycle今天我们雅思写作小作文范文的文章来研究下流程图flow chart。
该图表展示了水资源循环的三个阶段,分别为海水在太阳的照射下蒸发并在空中逐渐积聚成云朵;水资源以降水或者降雪的形式从云朵中来到地面。
地面上的水形成湖泊或者渗入地下流回海洋。
小编搜集了一篇相关的考官范文,以供大家参考。
雅思写作小作文题目The diagram below shows the water cycle, which is the continuous movement of water on, above and below the surface of the Earth.Summarise the information by selecting and reporting the main features, and make comparisons where relevant.雅思写作小作文范文The picture illustrates the way in which water passes from ocean to air to land during the natural process known as the water cycle.图片说明了在自然过程中,水资源从海洋到空气再到陆地的变化方式。
这一过程被称为水循环。
Three main stages are shown on the diagram. Ocean water evaporates, falls as rain, and eventually runs back into the oceans again.图片中展示了3个主要阶段。
海水蒸发,然后作为雨水降落,并最终再次回到海洋。
Beginning at the evaporation stage, we can see that 80% of water vapour in the air comes from the oceans. Heat from the sun causes water to evaporate, and water vapour condenses to form clouds. At the second stage, labelled ‘precipitation’ on the diagram, water falls as rain or snow.在一开始的蒸发阶段,我们可以看到空气中百分之80的水蒸气都来自于海洋。
2020雅思小作文考官范文(流程图题型)
2020雅思小作文考官范文(流程图题型)主题:房屋保护题型:流程图The diagrams below show how houses can be protected in areas which are prone to flooding.满分范文:The diagrams compare two different methods of defence for homes which are at risk of being flooded.The key difference between the diagrams is that they show flood protection with and without a stopbank. In either case, the at-risk home is raised on stilts above ground level.The first diagram shows how a stopbank acts as a flood barrier to stop river water from flooding homes. The stopbank is a small mound of land next to the river that is higher than the 100-year flood level, and prevents the river from bursting its banks. Nearby houses can be built on stilts to prevent flooding from rainwater, and a floodgate beneath the stopbank can be opened to allow this ‘ponding’ to drain off into the river.When there is no stopbank, as shown in the second diagram, there will be nothing to stop the river from flooding. In this case, the solution is to put buildings on stilts. The height of the stilts is measured so that the floor of the house is 300mm above the 100-year flood level. This measurement is called the ‘freeboard’.主题:房屋设计题型:流程图The diagrams below show some principles of house design for cool and for warm climates.The diagrams show how house designs differ according to climate.The most noticeable difference between houses designed for cool and warm climates is in the shape of the roof. The designs also differ with regard to the windows and the use of insulation.We can see that the cool climate house has a high-angled roof, which allows sunlight to enter through the window. By contrast, the roof of the warm climate house has a peak in the middle and roof overhangs to shade the windows. Insulation and thermal building materials are used in cool climates to reduce heat loss, whereas insulation and reflective materials are used to keep the heat out in warm climates.Finally, the cool climate house has one window which faces the direction of the sun, while the warm climate house has windows on two sides which are shaded from the sun. By opening the two windows at night, the house designed for warm climates can be ventilated.满分范文:The diagrams show how house designs differ according to climate.The most noticeable difference between houses designed for cool and warm climates is in the shape of the roof. The designs also differ with regard to the windows and the use of insulation.We can see that the cool climate house has a high-angled roof, which allows sunlight to enter through the window. By contrast, the roof of the warm climate house has a peak in the middle and roof overhangs to shade the windows. Insulation and thermal building materials are used in cool climates to reduce heat loss, whereas insulation and reflective materials are used to keep the heat out in warm climates.Finally, the cool climate house has one window which faces the direction of the sun, while the warm climate house has windows on two sides which are shaded from the sun. By opening the two windows at night, the house designed for warm climates can be ventilated.主题:废纸回收题型:流程图The chart below shows the process of waste paper recycling.满分范文:The chart below shows the process of waste paper recycling.The flow chart shows how waste paper is recycled. It is clear that there are six distinct stages in this process, from the initial collection of waste paper to the eventual production of usable paper.At the first stage in the paper recycling process, waste paper is collected either from paper banks, where members of the public leave their used paper, or directly from businesses. This paper is then sorted by hand and separated according to its grade, with any paper that is not suitable for recycling being removed. Next, the graded paper is transported to a paper mill.Stages four and five of the process both involve cleaning. The paper is cleaned and pulped, and foreign objects such as staples are taken out. Following this, all remnants of ink and glue are removed from the paper at the de-inking stage. Finally, the pulp can be processed in a paper making machine, which makes the end product: usable paper.主题:蜜蜂一生题型:流程图The diagram shows the life cycle of the honey bee.The diagram illustrates the various stages in the life of a honey bee. We can see that the complete life cycle lasts between 34 and 36 days. It is also noticeable that there are five main stages in the development of the honey bee, from egg to mature adult insect.The life cycle of the honey bee begins when the female adult lays an egg; the female typically lays one or two eggs every 3 days. Between 9 and 10 days later, each egg hatches and the immature insect, or nymph, appears.During the third stage of the life cycle, the nymph grows in size and sheds its skin three times. This moulting first takes place 5 days after the egg hatches, then 7 days later, and again another 9 days later. After a total of 30 to 31 days from the start of the cycle, the young adult honey bee emerges from its final moulting stage, and in the space of only 4 days it reaches full maturity.题型:流程图The diagram below shows the water cycle, which is the continuous movement of water on, above and below the surface of the Earth.满分范文:The picture illustrates the way in which water passes from ocean to air to land during the natural process known as the water cycle.Three main stages are shown on the diagram. Ocean water evaporates, falls as rain, and eventually runs back into the oceans again.Beginning at the evaporation stage, we can see that 80% of water vapour in the air comes from the oceans. Heat from the sun causes water to evaporate, and water vapour condenses to form clouds. At the second stage, labelled ‘precipitation’ on the diagram, water falls as rain or snow.At the third stage in the cycle, rainwater may take various paths. Some of it may fall into lakes or return to the oceans via ‘surface runoff’. Otherwise, rainwater may filter through the ground, reaching the impervious layer of the earth. Salt water intrusion is shown to take place just before groundwater passes into the oceans to complete the cycle.主题:太阳能发电题型:流程图The diagram below shows how solar panels can be used to provide electricity for domestic use.满分范文:The picture illustrates the process of producing electricity in a home using solar panels.It is clear that there are five distinct stages in this process, beginning with the capture of energy from sunlight. The final two steps show how domestic electricity is connected to the external power supply.At the first stage in the process, solar panels on the roof of a normal house take energy from the sun and convert it into DC current. Next, this current is passed to an inverter, which changes it to AC current and regulates the supply of electricity. At stage three, electricity is supplied to the home from an electrical panel.At the fourth step shown on the diagram, a utility meter in the home is responsible for sending any extra electric power outside the house into the grid. Finally, if the solar panels do not provide enough energy for the household, electricity will flow from the utility grid into the home through the meter.主题:天气预报题型:流程图The diagram shows the process of weather forcast by Australian Bureau of Meteorology满分范文:The figure illustrates the process used by the Australian Bureau of Meteorology to forecast the weather.There are four stages in the process, beginning with the collection of information about the weather. This information is then analysed, prepared for presentation, and finally broadcast to the public.Looking at the first and second stages of the process, there are three ways of collecting weather data and three ways of analysing it. Firstly, incoming information can be received by satellite and presented for analysis as a satellite photo. The same data can also be passed to a radar station and presented on a radar screen or synoptic chart. Secondly, incoming information may be collected directly by radar and analysed on a radar screen or synoptic chart. Finally, drifting buoys also receive data which can be shown on a synoptic chart.At the third stage of the process, the weather broadcast is prepared on computers. Finally, it is delivered to the public on television, on the radio, or as a recorded telephone announcement.。
流程图写成一段话
流程图写成一段话As the business process is becoming more complex, it is essential for organizations to have a clear understanding of their workflow. 随着业务流程变得越来越复杂,组织清楚地了解他们的工作流程变得至关重要。
Firstly, a well-documented and visual representation of the workflow is crucial for employees to understand their roles and responsibilities within the organization. 在组织内部,详细记录并以可视化形式呈现工作流程对员工理解其在组织内的角色和责任至关重要。
Moreover, a clear workflow diagram can help identify bottlenecks or inefficiencies in the process, allowing for improvements to be made. 此外,清晰的工作流程图可以帮助识别流程中的瓶颈或低效,从而可以进行改进。
Additionally, having a visual representation of the workflow can aid in training new employees and assisting them in understanding the overall business process. 此外,对于培训新员工和帮助他们理解整个业务流程,具有可视化形式的工作流程图能够发挥重要作用。
Furthermore, a well-documented workflow can serve as a reference point for future audits or evaluations, ensuring that the organization is operating in compliance with regulations and best practices. 此外,详细记录的工作流程可以作为未来审计或评估的参考点,确保组织在符合法规和最佳实践的情况下运作。
- 1、下载文档前请自行甄别文档内容的完整性,平台不提供额外的编辑、内容补充、找答案等附加服务。
- 2、"仅部分预览"的文档,不可在线预览部分如存在完整性等问题,可反馈申请退款(可完整预览的文档不适用该条件!)。
- 3、如文档侵犯您的权益,请联系客服反馈,我们会尽快为您处理(人工客服工作时间:9:00-18:30)。
This following chart illustrates the recycling process of waste paper. The whole recycling process can be divided into six steps.
In the first step, various waste paper is collected from different occasions, such as the public paper banks and business places where tons of paper is thrown away after being used. After having been collected, waste paper is sorted by hand to evaluate the grade of different paper and then that paper which is considered unsuitable for recycling is removed. On the next stage, the sorted paper is transported to paper mill to be cleaned and then pulped in order to get rid of other materials on the paper, such as staples. When the cleaning process is finished, the waste paper is later going through the de-inking process to remove inks, glues and other staff. In the final stage, the paper making machine is used to manufacture usable paper from the processed waste paper. At this point, a recycling process of waste paper has been completed.
Overall, the chart shows how to make usable paper from waste papers through the paper recycling process.。