HTML5视频教程之基于HTML5 Canvas的3D动态Chart图表的制作
HTML5 canvas纸片3D旋转动画
<!doctype html><html><head><meta charset="utf-8"><title>卷曲噪音</title><style>body{margin: 0;padding: 0;overflow: hidden;}</style></head><body><script src="js/three.js"></script><script src="js/OrbitControls.js"></script><script src="js/GPUComputationRenderer.js"></script><div class="wrapper" id="wrapper"></div><script id="simulation_vel" type="x-shader/x-fragment">//// Description : Array and textureless GLSL 2D/3D/4D simplex// noise functions.// Author : Ian McEwan, Ashima Arts.// Maintainer : ijm// Lastmod : 20110822 (ijm)// License : Copyright (C) 2011 Ashima Arts. All rights reserved.// Distributed under the MIT License. See LICENSE file. // https:///ashima/webgl-noise //vec3 mod289(vec3 x) {return x - floor(x * (1.0 / 289.0)) * 289.0;}vec4 mod289(vec4 x) {return x - floor(x * (1.0 / 289.0)) * 289.0;}vec4 permute(vec4 x) {return mod289(((x*34.0)+1.0)*x);}vec4 taylorInvSqrt(vec4 r){return 1.79284291400159 - 0.85373472095314 * r;}float snoise(vec3 v) {const vec2 C = vec2(1.0/6.0, 1.0/3.0) ;const vec4 D = vec4(0.0, 0.5, 1.0, 2.0);// First cornervec3 i = floor(v + dot(v, C.yyy) );vec3 x0 = v - i + dot(i, C.xxx) ;// Other cornersvec3 g = step(x0.yzx, x0.xyz);vec3 l = 1.0 - g;vec3 i1 = min( g.xyz, l.zxy );vec3 i2 = max( g.xyz, l.zxy );// x0 = x0 - 0.0 + 0.0 * C.xxx;// x1 = x0 - i1 + 1.0 * C.xxx;// x2 = x0 - i2 + 2.0 * C.xxx;// x3 = x0 - 1.0 + 3.0 * C.xxx;vec3 x1 = x0 - i1 + C.xxx;vec3 x2 = x0 - i2 + C.yyy; // 2.0*C.x = 1/3 = C.yvec3 x3 = x0 - D.yyy; // -1.0+3.0*C.x = -0.5 = -D.y// Permutationsi = mod289(i);vec4 p = permute( permute( permute(i.z + vec4(0.0, i1.z, i2.z, 1.0 ))+ i.y + vec4(0.0, i1.y, i2.y, 1.0 ))+ i.x + vec4(0.0, i1.x, i2.x, 1.0 ));// Gradients: 7x7 points over a square, mapped onto an octahedron. // The ring size 17*17 = 289 is close to a multiple of 49 (49*6 = 294) float n_ = 0.142857142857; // 1.0/7.0vec3 ns = n_ * D.wyz - D.xzx;vec4 j = p - 49.0 * floor(p * ns.z * ns.z); // mod(p,7*7)vec4 x_ = floor(j * ns.z);vec4 y_ = floor(j - 7.0 * x_ ); // mod(j,N)vec4 x = x_ *ns.x + ns.yyyy;vec4 y = y_ *ns.x + ns.yyyy;vec4 h = 1.0 - abs(x) - abs(y);vec4 b0 = vec4( x.xy, y.xy );vec4 b1 = vec4( x.zw, y.zw );//vec4 s0 = vec4(lessThan(b0,0.0))*2.0 - 1.0;//vec4 s1 = vec4(lessThan(b1,0.0))*2.0 - 1.0;vec4 s0 = floor(b0)*2.0 + 1.0;vec4 s1 = floor(b1)*2.0 + 1.0;vec4 sh = -step(h, vec4(0.0));vec4 a0 = b0.xzyw + s0.xzyw*sh.xxyy ;vec4 a1 = b1.xzyw + s1.xzyw*sh.zzww ;vec3 p0 = vec3(a0.xy,h.x);vec3 p1 = vec3(a0.zw,h.y);vec3 p2 = vec3(a1.xy,h.z);vec3 p3 = vec3(a1.zw,h.w);//Normalise gradientsvec4 norm = taylorInvSqrt(vec4(dot(p0,p0), dot(p1,p1), dot(p2, p2), dot(p3,p3))); p0 *= norm.x;p1 *= norm.y;p2 *= norm.z;p3 *= norm.w;// Mix final noise valuevec4 m = max(0.6 - vec4(dot(x0,x0), dot(x1,x1), dot(x2,x2), dot(x3,x3)), 0.0);m = m * m;return 42.0 * dot( m*m, vec4( dot(p0,x0), dot(p1,x1), dot(p2,x2), dot(p3,x3) ) ); }vec3 snoiseVec3( vec3 x ){float s = snoise(vec3( x ));float s1 = snoise(vec3( x.y - 19.1 , x.z + 33.4 , x.x + 47.2 ));float s2 = snoise(vec3( x.z + 74.2 , x.x - 124.5 , x.y + 99.4 ));vec3 c = vec3( s , s1 , s2 );return c;}// via: https://petewerner.blogspot.jp/2015/02/intro-to-curl-noise.html vec3 curlNoise( vec3 p ){const float e = 0.1;float n1 = snoise(vec3(p.x, p.y + e, p.z));float n2 = snoise(vec3(p.x, p.y - e, p.z));float n3 = snoise(vec3(p.x, p.y, p.z + e));float n4 = snoise(vec3(p.x, p.y, p.z - e));float n5 = snoise(vec3(p.x + e, p.y, p.z));float n6 = snoise(vec3(p.x - e, p.y, p.z));float x = n2 - n1 - n4 + n3;float y = n4 - n3 - n6 + n5;float z = n6 - n5 - n2 + n1;const float divisor = 1.0 / ( 2.0 * e );return normalize( vec3( x , y , z ) * divisor );}uniform float timer;uniform float delta;uniform float speed;uniform float factor;uniform float evolution;uniform float radius;void main() {vec2 uv = gl_FragCoord.xy / resolution.xy;vec4 c = texture2D( posTex, uv );vec4 oldVel = texture2D( velTex, uv );vec3 pos = c.xyz;float life = oldVel.a;float s = life / 100.0;float speedInc = 1.0;vec3 v = factor * speedInc * delta * speed * ( curlNoise( .2 * pos) );pos += v;life -= 0.3;if( life <= 0.0) {pos = texture2D( defTex, uv ).xyz;life = 100.0;}gl_FragColor = vec4( pos - c.xyz, life );}</script><script id="simulation_pos" type="x-shader/x-fragment">void main() {vec2 uv = gl_FragCoord.xy / resolution.xy;vec4 tmpPos = texture2D( posTex, uv );vec3 pos = tmpPos.xyz;vec4 tmpVel = texture2D( velTex, uv );vec3 vel = tmpVel.xyz;pos += vel;gl_FragColor = vec4( pos, 0.0 );}</script><script id="simulation_def" type="x-shader/x-fragment">void main() {vec2 uv = gl_FragCoord.xy / resolution.xy;vec4 tmpPos = texture2D( defTex, uv );gl_FragColor = vec4( tmpPos.rgb, 0.0 );}</script><script id="vs-particles" type="x-shader/x-vertex">attribute float aNum;attribute float aRandom;// attribute vec2 aPosUvattribute vec3 aColor;uniform sampler2D posMap;uniform sampler2D velMap;uniform float size;uniform float timer;uniform vec3 boxScale;uniform float meshScale;uniform mat4 shadowMatrix;varying vec3 vPosition;varying vec3 vColor;varying vec4 vShadowCoord;mat3 calcLookAtMatrix(vec3 vector, float roll) { vec3 rr = vec3(sin(roll), cos(roll), 0.0);vec3 ww = normalize(vector);vec3 uu = normalize(cross(ww, rr));vec3 vv = normalize(cross(uu, ww));return mat3(uu, ww, vv);}void main() {vec2 posUv;posUv.x = mod(aNum, (size - 1.0));posUv.y = float(aNum / (size - 1.0));posUv /= vec2(size);vec4 cubePosition = texture2D( posMap, posUv ); vec4 cubeVelocity = texture2D( velMap, posUv ); float alpha = cubeVelocity.a / 100.0;float scale = 0.025 * 4.0 * (1.0 - alpha) * alpha;mat4 localRotationMat = mat4( calcLookAtMatrix( cubeVelocity.xyz, 0.0 ) );vec3 modifiedVertex = (localRotationMat * vec4( position * scale * aRandom * (vec3(1.0)) * boxScale * meshScale, 1.0 ) ).xyz;vec3 modifiedPosition = modifiedVertex + cubePosition.xyz;gl_Position = projectionMatrix * modelViewMatrix * vec4( modifiedPosition, 1.0 );vPosition = modifiedPosition;// via: line 7 in https:///mrdoob/three.js/blob/dev/src/renderers/shaders/ShaderChunk/shadow map_vertex.glslvShadowCoord = shadowMatrix * modelMatrix * vec4( modifiedPosition, 1. );vColor = aColor;}</script><script id="fs-particles" type="x-shader/x-fragment">varying vec3 vPosition;varying vec3 vColor;varying vec4 vShadowCoord;uniform sampler2D shadowMap;uniform vec2 shadowMapSize;uniform float shadowBias;uniform float shadowRadius;// uniform sampler2D projector;uniform vec3 lightPosition;uniform vec2 resolution;float bias;// via: https:///mrdoob/three.js/blob/dev/src/renderers/shaders/ShaderChunk/packing. glslconst float UnpackDownscale = 255. / 256.; // 0..1 -> fraction (excluding 1)const vec3 PackFactors = vec3( 256. * 256. * 256., 256. * 256., 256. );const vec4 UnpackFactors = UnpackDownscale / vec4( PackFactors, 1. );float unpackRGBAToDepth( const in vec4 v ) {return dot( v, UnpackFactors );}float texture2DCompare( sampler2D depths, vec2 uv, float compare ) {return step( compare, unpackRGBAToDepth( texture2D( depths, uv ) ) );}float getShadow( sampler2D shadowMap, vec2 shadowMapSize, float shadowBias, float shadowRadius, vec4 shadowCoord ) {float shadow = 1.0;shadowCoord.xyz /= shadowCoord.w;shadowCoord.z += shadowBias;// if ( something && something ) breaks ATI OpenGL shader compiler// if ( all( something, something ) ) using this insteadbvec4 inFrustumVec = bvec4 ( shadowCoord.x >= 0.0, shadowCoord.x <= 1.0, shadowCoord.y >= 0.0, shadowCoord.y <= 1.0 );bool inFrustum = all( inFrustumVec );bvec2 frustumTestVec = bvec2( inFrustum, shadowCoord.z <= 1.0 );bool frustumTest = all( frustumTestVec );if ( frustumTest ) {vec2 texelSize = vec2( 1.0 ) / shadowMapSize;float dx0 = - texelSize.x * shadowRadius;float dy0 = - texelSize.y * shadowRadius;float dx1 = + texelSize.x * shadowRadius;float dy1 = + texelSize.y * shadowRadius;shadow = (texture2DCompare( shadowMap, shadowCoord.xy + vec2( dx0, dy0 ), shadowCoord.z ) + texture2DCompare( shadowMap, shadowCoord.xy + vec2( 0.0, dy0 ), shadowCoord.z ) +texture2DCompare( shadowMap, shadowCoord.xy + vec2( dx1, dy0 ), shadowCoord.z ) + texture2DCompare( shadowMap, shadowCoord.xy + vec2( dx0, 0.0 ), shadowCoord.z ) +texture2DCompare( shadowMap, shadowCoord.xy, shadowCoord.z ) +texture2DCompare( shadowMap, shadowCoord.xy + vec2( dx1, 0.0 ), shadowCoord.z ) +texture2DCompare( shadowMap, shadowCoord.xy + vec2( dx0, dy1 ), shadowCoord.z ) +texture2DCompare( shadowMap, shadowCoord.xy + vec2( 0.0, dy1 ), shadowCoord.z ) +texture2DCompare( shadowMap, shadowCoord.xy + vec2( dx1, dy1 ), shadowCoord.z ) ) * ( 1.0 / 9.0 );}return shadow;}mat2 rotationMatrix( float a ) {return mat2( cos( a ), sin( a ),-sin( a ), cos( a ) );}vec3 calcIrradiance_hemi(vec3 newNormal, vec3 lightPos, vec3 grd, vec3 sky){float dotNL = dot(newNormal, normalize(lightPos));float hemiDiffuseWeight = 0.5 * dotNL + 0.5;return mix(grd, sky, hemiDiffuseWeight);}vec3 calcIrradiance_dir(vec3 newNormal, vec3 lightPos, vec3 light){float dotNL = dot(newNormal, normalize(lightPos));return light * max(0.0, dotNL);}const float PI = 3.14159265358979323846264;// hemisphere ground colorconst vec3 hemiLight_g = vec3(256.0, 246.0, 191.0) / vec3(256.0);// hemisphere sky colorconst vec3 hemiLight_s_1 = vec3(0.5882352941176471,0.8274509803921568,0.8823529411764706);const vec3 hemiLight_s_2 = vec3(0.9686274509803922,0.8509803921568627,0.6666666666666666);const vec3 hemiLight_s_3 = vec3(0.8784313725490196,0.5882352941176471,0.7647058823529411);// directional light colorconst vec3 dirLight = vec3(0.4);const vec3 dirLight_2 = vec3(0.1);const vec3 hemiLightPos_1 = vec3(100.0, 100.0, -100.0);const vec3 hemiLightPos_2 = vec3(-100.0, -100.0, 100.0);const vec3 hemiLightPos_3 = vec3(-100.0, 100.0, 100.0);void main() {vec3 fdx = dFdx( vPosition );vec3 fdy = dFdy( vPosition );vec3 n = normalize(cross(fdx, fdy));float diffuse = max(0.0, dot(n, normalize(lightPosition)));float theta = clamp( -diffuse, 0., 1. );bias = 0.005 * tan( acos( theta ) );bias = clamp( bias, 0., 0.01 );// shadow gradient// float mask = sqrt(pow((vShadowCoord.x - 0.5) * 2.0, 2.0) + pow((vShadowCoord.y - 0.5) * 2.0, 2.0));// mask = 1.0 - smoothstep(0.5, 1.0, mask);vec3 hemiColor = vec3(0.0);hemiColor += calcIrradiance_hemi(n, hemiLightPos_1, hemiLight_g, hemiLight_s_1) * 0.43; hemiColor += calcIrradiance_hemi(n, hemiLightPos_2, hemiLight_g, hemiLight_s_2) * 0.33; hemiColor += calcIrradiance_hemi(n, hemiLightPos_3, hemiLight_g, hemiLight_s_3) * 0.38;vec3 dirColor = vec3(0.0);dirColor += calcIrradiance_dir(n, lightPosition, dirLight);vec3 dirLightPos2 = vec3(-lightPosition.x, -lightPosition.y, -lightPosition.z);dirColor += calcIrradiance_dir(n, dirLightPos2, dirLight_2);float shadow = 1.0;shadow *= getShadow(shadowMap, shadowMapSize, bias, shadowRadius, vShadowCoord);vec3 color = vColor * hemiColor;color += dirColor * shadow;gl_FragColor = vec4(color, 0.0);}</script><script id="fs-particles-shadow" type="x-shader/x-fragment">// via: https:///mrdoob/three.js/blob/dev/src/renderers/shaders/ShaderChunk/packi ng.glslconst float PackUpscale = 256. / 255.; // fraction -> 0..1 (including 1)const vec3 PackFactors = vec3( 256. * 256. * 256., 256. * 256., 256. );const float ShiftRight8 = 1. / 256.;vec4 packDepthToRGBA( const in float v ) {vec4 r = vec4( fract( v * PackFactors ), v );r.yzw -= r.xyz * ShiftRight8; // tidy overflowreturn r * PackUpscale;}void main() {gl_FragColor = packDepthToRGBA( gl_FragCoord.z );}</script><script>// curl noise// https://petewerner.blogspot.jp/2015/02/intro-to-curl-noise.html// inspired by https:///code/polygon-shredder/window.onload = () =>{var webgl = new Webgl();window.onresize = () => {webgl.resize();}}class Webgl{constructor(){this.size = 28;this.widthW = document.body.clientWidth;this.heightW = window.innerHeight;this.init();}init(){this.container = document.getElementById( "wrapper" );this.renderer = new THREE.WebGLRenderer( { antialias: true } );// renderer.setPixelRatio( window.devicePixelRatio );this.renderer.setSize( this.widthW, this.heightW );this.renderer.setClearColor( 0xff00ff );this.container.appendChild( this.renderer.domElement );this.scene = new THREE.Scene();this.colorPallete = [new THREE.Color(0x0d0232),new THREE.Color(0xe50061),new THREE.Color(0x1cafc0),new THREE.Color(0xefcb03)];this.camera = new THREE.PerspectiveCamera( 45, this.widthW / this.heightW, .01, 10000 );this.scene.add( this.camera );this.camera.position.set(-0.1, 4.0, 0.1);var controls = new THREE.OrbitControls( this.camera, this.renderer.domElement );this.sim = new Simulation(this.renderer, this.size);this.setLight();this.createObj();this.time = new THREE.Clock();this.render();}setLight(){this.light = new THREE.DirectionalLight( 0xFFAA55 );this.light.position.set(-4, -6, 10);this.light.castShadow = true;this.shadowCamera = this.light.shadow.camera;this.shadowCamera.lookAt( this.scene.position );this.light.shadow.matrix.set(0.5, 0.0, 0.0, 0.5,0.0, 0.5, 0.0, 0.5,0.0, 0.0, 0.5, 0.5,0.0, 0.0, 0.0, 1.0);this.light.shadow.matrix.multiply( this.shadowCamera.projectionMatrix );this.light.shadow.matrix.multiply( this.shadowCamera.matrixWorldInverse );if(this.light.shadow.map === null){this.light.shadow.mapSize.x = 2048;this.light.shadow.mapSize.y = 2048;var pars = { minFilter: THREE.NearestFilter, magFilter: THREE.NearestFilter, format: THREE.RGBAFormat };this.light.shadow.map = new THREE.WebGLRenderTarget( this.light.shadow.mapSize.x,this.light.shadow.mapSize.y, pars );// = + ".shadowMap";}}createObj(){// var originalG = new THREE.BoxBufferGeometry(1, 1, 1);var originalG = new THREE.OctahedronBufferGeometry(1, 0);var geometry = new THREE.InstancedBufferGeometry();// vertexvar vertices = originalG.attributes.position.clone();geometry.addAttribute("position", vertices);var normals = originalG.attributes.normal.clone();geometry.addAttribute("normal", normals);// uvvar uvs = originalG.attributes.uv.clone();geometry.addAttribute("uv", uvs);// index// var indices = originalG.index.clone();// geometry.setIndex(indices);geometry.maxInstancedCount = this.sim.size * this.sim.size;var nums = new THREE.InstancedBufferAttribute(new Float32Array(this.sim.size * this.sim.size * 1), 1, 1);var randoms = new THREE.InstancedBufferAttribute(new Float32Array(this.sim.size * this.sim.size * 1), 1, 1);var colors = new THREE.InstancedBufferAttribute(new Float32Array(this.sim.size * this.sim.size * 3), 3, 1);for(var i = 0; i < nums.count; i++){var _color = this.colorPallete[Math.floor(Math.random() * this.colorPallete.length)];nums.setX(i, i);randoms.setX(i, Math.random() * 0.5 + 1);colors.setXYZ(i, _color.r, _color.g, _color.b);}geometry.addAttribute("aNum", nums);geometry.addAttribute("aRandom", randoms);geometry.addAttribute("aColor", colors);var scale = {x: 2,y: 8,z: 2}this.material = new THREE.ShaderMaterial( {uniforms: {posMap: { type: "t", value: this.sim.gpuCompute.getCurrentRenderTarget(this.sim.pos).texture },velMap: { type: "t", value: this.sim.gpuCompute.getCurrentRenderTarget(this.sim.vel).texture },size: { type: "f", value: this.sim.size },timer: { type: 'f', value: 0 },boxScale: { type: 'v3', value: new THREE.Vector3(scale.x, scale.y, scale.z) },meshScale: { type: 'f', value: 0.7 },shadowMap: { type: 't', value: this.light.shadow.map },shadowMapSize: {type: "v2", value: this.light.shadow.mapSize},shadowBias: {type: "f", value: this.light.shadow.bias},shadowRadius: {type: "f", value: this.light.shadow.radius},// Line 217 in https:///mrdoob/three.js/blob/dev/src/renderers/webgl/WebGLShadowMap.jsshadowMatrix: { type: 'm4', value: this.light.shadow.matrix},lightPosition: { type: 'v3', value: this.light.position }},vertexShader: document.getElementById( 'vs-particles' ).textContent,fragmentShader: document.getElementById( 'fs-particles' ).textContent,side: THREE.DoubleSide,shading: THREE.FlatShading} );this.mesh = new THREE.Mesh( geometry, this.material );this.scene.add( this.mesh );this.shadowMaterial = new THREE.ShaderMaterial( {uniforms: {posMap: { type: "t", value: this.sim.gpuCompute.getCurrentRenderTarget(this.sim.pos).texture },velMap: { type: "t", value: this.sim.gpuCompute.getCurrentRenderTarget(this.sim.vel).texture },size: { type: "f", value: this.sim.size },timer: { type: 'f', value: 0 },boxScale: { type: 'v3', value: new THREE.Vector3(scale.x, scale.y, scale.z) },meshScale: { type: 'f', value: 0.7 },shadowMatrix: { type: 'm4', value: this.light.shadow.matrix},lightPosition: { type: 'v3', value: this.light.position }},vertexShader: document.getElementById( 'vs-particles' ).textContent,fragmentShader: document.getElementById( 'fs-particles-shadow' ).textContent,side: THREE.DoubleSide} );}render(){var delta = this.time.getDelta() * 4;var time = this.time.elapsedTime;this.sim.velUniforms.timer.value = time;this.sim.velUniforms.delta.value = delta;pute();this.material.uniforms.posMap.value = this.sim.gpuCompute.getCurrentRenderTarget(this.sim.pos).texture;this.material.uniforms.velMap.value = this.sim.gpuCompute.getCurrentRenderTarget(this.sim.vel).texture;this.shadowMaterial.uniforms.posMap.value = this.sim.gpuCompute.getCurrentRenderTarget(this.sim.pos).texture;this.shadowMaterial.uniforms.velMap.value = this.sim.gpuCompute.getCurrentRenderTarget(this.sim.vel).texture;this.material.uniforms.timer.value = this.shadowMaterial.uniforms.timer.value = time;this.mesh.material = this.shadowMaterial;this.renderer.render( this.scene, this.shadowCamera, this.light.shadow.map);this.renderer.setClearColor( 0x2e0232 );this.mesh.material = this.material;this.renderer.render( this.scene, this.camera );requestAnimationFrame(this.render.bind(this));}resize(){this.widthW = document.body.clientWidth;this.heightW = window.innerHeight;this.camera.aspect = this.widthW / this.heightW;this.camera.updateProjectionMatrix();this.renderer.setSize( this.widthW, this.heightW);}}class Simulation{constructor(renderer, size){this.renderer = renderer;this.size = size;this.init();}init(){this.gpuCompute = new GPUComputationRenderer( this.size, this.size, this.renderer );this.dataPos = this.gpuCompute.createTexture();this.dataVel = this.gpuCompute.createTexture();this.dataDef = this.gpuCompute.createTexture();var posArray = this.dataPos.image.data;var velArray = this.dataVel.image.data;var defArray = this.dataDef.image.data;for ( var i = 0, il = posArray.length; i < il; i += 4 ) {var phi = Math.random() * 2 * Math.PI;var theta = Math.random() * Math.PI;var r = 0.8 + Math.random() * 2;defArray[ i + 0 ] = posArray[ i + 0 ] = r * Math.sin( theta) * Math.cos( phi );defArray[ i + 1 ] = posArray[ i + 1 ] = r * Math.sin( theta) * Math.sin( phi );defArray[ i + 2 ] = posArray[ i + 2 ] = r * Math.cos( theta );velArray[ i + 3 ] = Math.random() * 100; // frames life// if(i < 50) console.log(velArray[ i + 3 ])}this.def = this.gpuCompute.addVariable( "defTex", document.getElementById( 'simulation_def' ).textContent, this.dataDef );this.vel = this.gpuCompute.addVariable( "velTex",document.getElementById( 'simulation_vel' ).textContent, this.dataVel );this.pos = this.gpuCompute.addVariable( "posTex", document.getElementById( 'simulation_pos' ).textContent, this.dataPos );this.gpuCompute.setVariableDependencies( this.def, [ this.pos, this.vel, this.def ] );this.gpuCompute.setVariableDependencies( this.vel, [ this.pos, this.vel, this.def ] );this.gpuCompute.setVariableDependencies( this.pos, [ this.pos, this.vel, this.def ] );// var posUniforms = this.pos.material.uniforms;this.velUniforms = this.vel.material.uniforms;this.velUniforms.timer = { value: 0.0 };this.velUniforms.delta = { value: 0.0 };this.velUniforms.speed = { value: 0.5 };this.velUniforms.factor = { value: 0.5 };this.velUniforms.evolution = { value: 0.5 };this.velUniforms.radius = { value: 2.0 };var error = this.gpuCompute.init();if ( error !== null ) {console.error( error );}}}</script><div style="text-align:center;"><p>更多源码:<a href="/" target="_blank"> </a></p></div></body></html>。
基于HTML5的Canvas动画设计教学的研究

2021年1月25日第5卷第2期现代信息科技Modern Information TechnologyJan.2021 Vol.5 No.2632021.1收稿日期:2020-11-29基于HTML5的Canvas动画设计教学的研究林观德(广州工商学院,广东 广州 510850)摘 要:HTML5新增的Canvas 元素,它是一种像素级别的位图绘图技术,实现较为简便,不需要安装插件,大部分浏览器都支持该技术。
Canvas 元素的功能也较为强大,除了可用于任意图形和动画的绘制外,与云技术相结合起来,还可用于巨型复杂图形的绘制。
文章对基于HTML5的Canvas 进行研究,主要针对Canvas API 提供的裁切方法clip()创建遮罩动画,通过Canvas 动画设计教学实例步骤的详细展示,使学生在学习中逐步掌握Canvas 动画的原理和制作方法,进而提高学生动画设计与制作的技能技巧。
关键词:HTML5;Canvas ;动画制作中图分类号:TP312文献标识码:A文章编号:2096-4706(2021)02-0063-03Research on Canvas Animation Design Teaching Based on HTML5LIN Guande(Guangzhou College of Technology and Business ,Guangzhou 510850,China )Abstract :Canvas element added in HTML 5 is a pixel level bitmap drawing technology ,which is easy to implement and does notneed to install plug-ins. Most browsers support this technology. Canvas element is also powerful. In addition to drawing arbitrary graphics and animation ,combined with cloud technology ,it can also be used to draw giant complex graphics. This paper studies the Canvas based on HTML 5,mainly aiming at the clipping method clip() provided by Canvas API to create mask animation. Through the detailed display of the steps of Canvas animation design teaching examples ,students can gradually master the principles and production methods of Canvas animation in learning ,and then improve their animation design and production skills.Keywords :HTML 5;Canvas ;animation production0 引 言Canvas 元素是HTML 5中新增开发跨平台动画和游戏的一个重要元素,可以用于绘制图形,合成制作照片或动画,能够在Web 页面上对图像和视频进行像素级操作。
基于SQLite+HTML5 Canvas的动态图形输出嵌入式Web服务
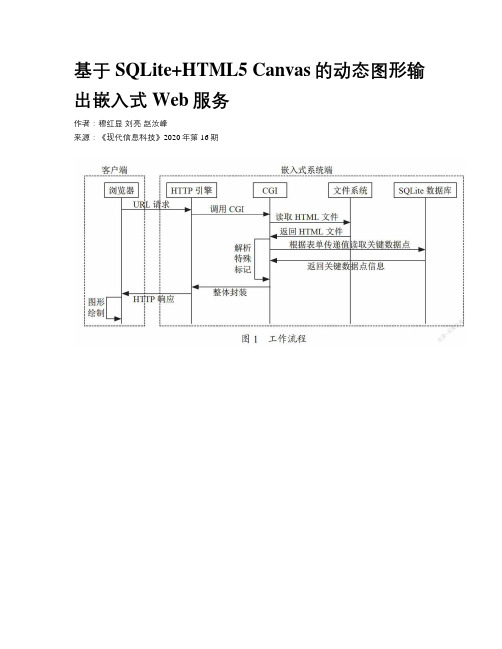
基于SQLite+HTML5 Canvas的动态图形输出嵌入式Web服务作者:穆红显刘亮赵汝峰来源:《现代信息科技》2020年第16期摘要:针对嵌入式Web服务器对资源和数据处理能力有限的特点,为了解决在嵌入式Web中输出如折线图等具有交互能力的动态图形问题,首先分析了FLASH、VML、SVG以及Java Applet等技术的不足,提出一种基于HTML5 Canvas绘制动态图形的瘦服务器思想,通过CGI程序与SQLite数据库交互实现图形的动态输出,并给出实例验证,为基于嵌入式Web服务器的动态图形输出提供一种解决思路。
关键词:嵌入式Web Canvas标签;SQLite数据库;动态图形;瘦服务器中图分类号:TP311.1 文献标识码:A 文章编号:2096-4706(2020)16-0078-04Dynamic Graphic Output Embedded Web Service Based on SQLite + HTML5 CanvasMU Hongxian,LIU Liang,ZHAO Rufeng(CETC Satellite Navigation Operation & Service Co.,Ltd.,Shijiazhuang 050200,China)Abstract:In view of the limited resources and data processing capacity of embedded Web server,in order to solve the problem of interactive dynamic graphics such as line graph output in embedded Web,this paper first analyzes the shortcomings of FLASH,VML,SVG and JavaApplet technologies,and proposes a thin server idea of drawing dynamic graphics based on HTML5 canvas. The dynamic output of graphics is realized through the interaction between CGI program and SQLite database. An example is given to verify the idea,which provides a solution for dynamic graphics output based on embedded Web server.Keywords:embedded Web Canvas tag;SQLite database;dynamic graphics;thin server0 引言基于笔者所在单位智慧农业领域相关项目需求,本文研究了温室大棚温湿度实时环境数据的采集与监测,温室大棚温湿度的实时环境数据和历史数据变化趋势对于农业生产具有重要意义。
Html5canvas画趋势图、柱状图

Html5canvas画趋势图、柱状图Html5 canvas画趋势图、柱状图首先,请确保你调试程序使用的浏览器支持html5。
(火狐、google chrome、ie9)然后,选择一个认识html5标签的开发环境,我使用的是vs2010。
要让VS2010识别html5页面很简单,首先安装vs2010旗舰版,然后,升级到vs2010sp1,然后打开编程环境,在“工具”—“选项”—“文本编辑器”—“HTML”—“验证”—“目标”下拉列表中选“Html5”即可。
值得一提的是,VS2010对javascript的联想能力比以前的版本要好得多。
下面进入主题,怎样在客户端绘制图像。
本人已经将经常用到的方法写到一个js文件中,下面直接贴上js代码,读者可以把以下代码直接复制到一个js文件中即可,后面是对函数的说明:Js代码:function DrawTrend(canvas,title,titlefont, left, right, top, bottom, data, ySegment, sXaxis, sYaxis, axisFont, color, xSegment) {var height = Number($(canvas).attr('height'));var width = Number($(canvas).attr('width'));var cxt = canvas.getContext("2d");cxt.fillStyle = "#f0f0f0";cxt.clearRect(0, 0, width, height);if (data == null || data.length < 1) {DrawString(cxt, "无数据", titlefont, "#000000", "center", "middle", width / 2, height / 2);}else {DrawLine(cxt, left, height - bottom, left, top, "");DrawLine(cxt, left, height - bottom, width - right, height -bottom, "");DrawString(cxt, title, titlefont, "#000000", "center", "middle", width / 2, top / 2);var stime = "";var subx = 0;var i = 0;var tempdata = new Array();for (i = 0; i < data.length; i++) {tempdata[i] = data[i][1];}var Yaxis = GetYaxis(tempdata, ySegment);var yinterval = (Yaxis[0] - Yaxis[1]) / ySegment;//画纵轴间隔线var suby = 0;for (i = 1; i <= ySegment; i++) {suby = height - bottom - (height - (bottom + top)) * i / ySegment; //副横轴纵坐标DrawString(cxt, String(Yaxis[1] + i * yinterval), axisFont, "", "right", "middle", left - 3, suby);DrawLine(cxt, left, suby, width - right, suby, "#aaaaaa");}DrawString(cxt, String(Yaxis[1]), axisFont, "", "right", "middle", left - 3, height - bottom); //起始纵坐标DrawString(cxt, sYaxis, axisFont, "", "center", "bottom", left, top - 10); //纵坐标单位DrawString(cxt, sXaxis, "", "", "right", "bottom", width - 3, height - bottom); //横坐标单位if (xSegment != null) {//找出横轴间隔点时间(分段)var n = data.length / xSegment;var xinter = (width - (left + right)) / xSegment;//画横轴间隔线for (i = 1; i <= xSegment; i++) {subx = left + xinter * i; //副横轴坐标stime = String(data[parseInt(n * i) - 1][0]);DrawString(cxt, stime, axisFont, "", "center", "top", subx, height - bottom + 3);DrawLine(cxt, subx, top, subx, height - bottom, "#aaaaaa");}//通过数值计算点坐标xinter = (width - (left + right)) / (data.length - 1); //横轴间隔像素数var points = new Array();for (i = 0; i < data.length; i++) {points[i] = new Array();points[i][0] = left + i * xinter;points[i][1] = height - bottom - (height - (bottom + top)) * (data[i][1] - Yaxis[1]) / (Yaxis[0] - Yaxis[1]);}}else {//通过数值计算点坐标xinter = (width - (left + right)) / (data.length - 1); //横轴间隔像素数var points = new Array();//计算x轴刻度间隔var xsegment = 1;if (data.length > 9) {for (i = 9; i > 1; i--) {if (data.length % i < 2) {xsegment = parseInt(data.length / i);break;}}}for (i = 0; i < data.length; i++) {points[i] = new Array();points[i][0] = left + i * xinter;points[i][1] = height - bottom - (height - (bottom + top)) * (data[i][1] - Yaxis[1]) / (Yaxis[0] - Yaxis[1]);if (i % xsegment == 0 && i != 0) {//横轴坐标时间var stime = data[i][0];DrawString(cxt, stime, axisFont, "", "center", "top", left + i * xinter, height - bottom + 3);DrawLine(cxt, left + i * xinter, top, left + i * xinter, height - bottom, "#aaaaaa");}}}DrawLines(cxt, points, color);}}参数说明:canvas:画布对象,必须用document.getElementById("");title:标题titlefont:标题字体,例如:"18px 微软雅黑",left, right, top, bottom:坐标轴左右上下边距data:数据,二维数组,其中data[i][1]必须为number类型,可以使用Number()函数将其他类型转换为数值类型ySegment:Y轴分段数量sXaxis:横轴标签sYaxis:纵轴标签axisFont:坐标轴字体color:曲线颜色xSegment:X轴分段数量,可选,如果设置了,则X轴分段数量为设置值,否则根据数据的长度自动分段function DrawColumnChart(canvas, title, titlefont, left, right, top, bottom, data,showdata, ySegment, sXaxis, sYaxis, axisFont, color,colordark) {var height = Number($(canvas).attr('height'));var width = Number($(canvas).attr('width'));var cxt = canvas.getContext("2d");cxt.fillStyle = "#f0f0f0";cxt.clearRect(0, 0, width, height);if (data == null || data.length == 0) {DrawString(cxt, "无数据", titlefont, "#000000", "center", "middle", width / 2, height / 2);}else {DrawLine(cxt, left, height - bottom, left, top, "");DrawLine(cxt, left, height - bottom, width - right, height - bottom, "");DrawString(cxt, title, titlefont, "#000000", "center", "middle", width / 2, top / 2);var i = 0;var tempdata = new Array();for (i = 0; i < data.length; i++) {tempdata[i] = data[i][1];}var Yaxis = GetYaxis(tempdata, ySegment);var yinterval = (Yaxis[0] - Yaxis[1]) / ySegment;//画纵轴间隔线var suby = 0;for (i = 1; i <= ySegment; i++) {suby = height - bottom - (height - (bottom + top)) * i / ySegment; //副横轴纵坐标DrawString(cxt, String(Yaxis[1] + i * yinterval), axisFont, "", "right", "middle", left - 3, suby);DrawLine(cxt, left, suby, width - right, suby, "#aaaaaa");}DrawString(cxt, String(Yaxis[1]), axisFont, "", "right", "middle", left - 3, height - bottom); //起始纵坐标DrawString(cxt, sYaxis, axisFont, "", "center", "bottom", left, top - 10); //纵坐标单位var xinter = (width - (left + right)) / (3 * data.length + 1); //横轴间隔的宽度(像素数)var points = new Array();//计算x轴刻度间隔var xsegment = 1;if (data.length > 10) {for (i = 10; i > 1; i--) {if (data.length % i < 2) {xsegment = parseInt(data.length / i);break;}}}for (i = 0; i < data.length; i++) {points[i] = new Array();points[i][0] = left + (i * 3 + 1) * xinter;var colheight = (height - (top + bottom)) * (data[i][1] - Yaxis[1]) / (Yaxis[0] - Yaxis[1]);points[i][1] = height - bottom - colheight;//画柱状图if (colordark == null) {FillRect(cxt, points[i][0], points[i][1], xinter * 2, colheight, color);}else {var colors = new Array();colors[0] = new Array();colors[0][0] = 0;colors[0][1] = colordark;colors[1] = new Array();colors[1][0] = 0.4;colors[1][1] = color;colors[2] = new Array();colors[2][0] = 1;colors[2][1] = colordark;FillLinearRect(cxt, points[i][0], points[i][1], xinter * 2, colheight, colors);}DrawRect(cxt, points[i][0], points[i][1], xinter * 2, colheight, "#000000");if (i % xsegment == 0) {//横轴坐标时间var stime = data[i][0];DrawString(cxt, stime, axisFont, "", "center", "top", left + (i *3 + 2) * xinter, height - bottom + 3);if (showdata) {//显示数字DrawString(cxt, data[i][1], axisFont, "", "center", "bottom", left + (i * 3 + 2) * xinter, points[i][1] - 1);}}DrawString(cxt, sXaxis, "", "", "right", "bottom", width - 3, height - bottom);}}}参数说明:canvas:画布对象,必须用document.getElementById("");title:标题titlefont:标题字体,例如:"18px 微软雅黑",left, right, top, bottom:坐标轴左右上下边距data:数据,二维数组,其中data[i][1]必须为number类型,可以使用Number()函数将其他类型转换为数值类型showdata:bool类型,表示是否在柱状图的顶部显示数值ySegment:Y轴分段数量sXaxis:横轴标签sYaxis:纵轴标签axisFont:坐标轴字体color:曲线颜色colordark:暗色,可选,如果设置了,柱状图显示为线性渐变色(从左到右:0:colordark,0.4:color,1:colordark),否则显示为单色,function FillRect(cxt, x1, y1, width, height, color) {cxt.fillStyle = color;cxt.fillRect(x1, y1, width, height);}参数说明:cxt:画笔,var cxt = canvas.getContext("2d"); 得到x1, y1:矩形左上角坐标width, height:矩形宽高color:矩形颜色function DrawRect(cxt, x1, y1, width, height, color){cxt.strokeStyle = color;cxt.beginPath();cxt.moveTo(x1, y1);cxt.lineTo(x1+width, y1);cxt.lineTo(x1+width, y1+height);cxt.lineTo(x1, y1+height);cxt.lineTo(x1, y1);cxt.stroke();}参数同上function FillLinearRect(cxt, x1, y1, width, height, colors) { var grd = cxt.createLinearGradient(x1, y1,x1+ width, y1); for (var i = 0; i < colors.length; i++) {grd.addColorStop(colors[i][0], colors[i][1]);}cxt.fillStyle = grd;cxt.fillRect(x1, y1, width, height);}参数说明:cxt:画笔,var cxt = canvas.getContext("2d"); 得到x1, y1:矩形左上角坐标width, height:矩形宽高colors:渐变色数组,colors[i][0]颜色驻点,colors[i][1]颜色值"#FF0000"function DrawLine(cxt, x1, y1, x2, y2, color) { if (color == "") {cxt.strokeStyle = "#000000";}else {cxt.strokeStyle = color;}cxt.beginPath();cxt.moveTo(x1, y1);cxt.lineTo(x2, y2);cxt.stroke();}function DrawLines(cxt, points, color) {if (color == "") {cxt.strokeStyle = "#000000";}else {cxt.strokeStyle = color;}if (points.length > 0) {cxt.beginPath();var point = new Array();point = points[0];cxt.moveTo(point[0], point[1]);for (var i = 1; i < points.length; i++) {point = points[i];cxt.lineTo(point[0], point[1]);}cxt.stroke();}参数说明:points:二维数组,points[i][0]X坐标,points[i][1]y 坐标function DrawString(cxt, text, font, color, align, v_align, x, y) { if (font == "") {cxt.font = "12px 微软雅黑";}else {cxt.font = font;}if (color == "") {cxt.fillStyle = "#000000";}else {cxt.fillStyle = color;}if (align == "") {cxt.textAlign = "left";}else {cxt.textAlign = align;}if (v_align == "") {cxt.textBaseline = "top";}else {cxt.textBaseline = v_align;}cxt.fillText(text, x, y);参数说明:font:字体,如:"18px 微软雅黑",align:横向对齐:'left','center','right'v_align:纵向对齐:'top','middle','bottom'// 根据一组数据,计算画曲线图需要的纵坐标最大最小值(尚需改进)function GetYaxis(data, inter) {var dataret = new Array();if (data.Length < 2) return null;var mindata = Min(data);var maxdata = Max(data);var interval = 0;if (maxdata > 0 && mindata >= 0) {interval = maxdata / inter;}else if (maxdata > 0 && mindata < 0) {interval = (maxdata - mindata) / inter;}else if (maxdata <= 0 && mindata < 0) {interval = Math.abs(mindata) / inter;}if (interval > 1) {var v = String(parseInt(interval)).length - 1; //*10的指数var yaxis = 0;if (maxdata > 0 && mindata >= 0) {var i = parseInt(Math.ceil(maxdata));while (true) {if (i % inter == 0 && i % Math.pow(10, v) == 0) {yaxis = i;break;i++;}dataret[0] = yaxis;dataret[1] = 0;}else if (maxdata > 0 && mindata < 0) {var i = parseInt(Math.ceil(maxdata));while (true) {if (i % inter == 0 && i % Math.pow(10, v) == 0) {var k = MinGongBeiShu(inter, parseInt(Math.pow(10, v))); //间隔数inter和10*n的最小公倍数yaxis = i + k;break;}i++;}var iinter = yaxis / inter;var n_max = parseInt(Math.ceil(maxdata / iinter));dataret[0] = n_max * iinter;dataret[1] = (n_max - inter) * iinter;}else if (maxdata <= 0 && mindata < 0) {maxdata = Math.abs(maxdata);mindata = Math.abs(mindata);var i = parseInt(Math.ceil(mindata));while (true) {if (i % inter == 0 && i % Math.pow(10, v) == 0) {yaxis = i;break;i++;}dataret[0] = 0;dataret[1] = -1 * yaxis;}}else if (interval > 0.1)//小于1大于0.1,先将max和min扩大10倍,再除以10{var mindata1 = mindata * 10;var maxdata1 = maxdata * 10;var interval1 = interval * 10;var v = String(parseInt(interval1)).length - 1; //*10的指数var yaxis = 0;if (maxdata1 > 0 && mindata1 >= 0) {var i = parseInt(Math.ceil(maxdata1));while (true) {if (i % inter == 0 && i % Math.pow(10, v) == 0) {yaxis = i;break;}i++;}dataret[0] = yaxis * 0.1;dataret[1] = 0;}else if (maxdata1 > 0 && mindata1 < 0) {var i = parseInt(Math.ceil(maxdata1));while (true) {if (i % inter == 0 && i % Math.pow(10, v) == 0) {var k = MinGongBeiShu(inter, parseInt(Math.pow(10, v))); //4和10*n的最小公倍数yaxis = i + k;break;}i++;}var iinter = yaxis / inter;var n_max = parseInt(Math.ceil(maxdata1 / iinter));dataret[0] = n_max * iinter * 0.1;dataret[1] = (n_max - inter) * iinter * 0.1;}else if (maxdata1 <= 0 && mindata1 < 0) {maxdata = Math.abs(maxdata1);mindata = Math.abs(mindata1);var i = parseInt(Math.ceil(maxdata1));while (true) {if (i % inter == 0 && i % Math.pow(10, v) == 0) {yaxis = i;break;}i++;}dataret[0] = 0;dataret[1] = -0.1 * yaxis;}}else {//如果数据过小,则用其上下整数限制dataret[0] = Math.ceil(maxdata);dataret[1] = Math.floor(mindata);if (maxdata == mindata && maxdata == 0) {dataret[0] = 1;dataret[1] = 0;}else if (maxdata == mindata && maxdata > 0) {dataret[0] = maxdata;dataret[1] = 0;}else if (maxdata == mindata && maxdata < 0) {dataret[0] = 0;dataret[1] = mindata;}}return dataret;}参数说明:data:一维数组inter:纵轴间隔段数下面介绍怎样使用上面的方法。
利用html5canvas动态画饼状图的示例代码

利⽤html5canvas动态画饼状图的⽰例代码本⽂介绍了利⽤html5 canvas动态画饼状图的⽰例代码,分享给⼤家,具体如下:先来看效果图这⾥并没引⽤jquery等第三⽅库,只是⽤dom操作和canvas的特性编写的。
canvas画圆⼤体分为实⼼圆和空⼼圆。
根据需求分析知道该圆为实⼼圆。
1.先⽤canvas画实⼼圆//伪代码var canvas = document.createElement("canvas");var ctx = canvas.getContext('2d');ctx.beginPath();ctx.arc(圆⼼x轴坐标,圆⼼y轴坐标,半径,开始⾓,结束⾓);ctx.fillStyle = 'green';ctx.closePath();ctx.fill();2.根据不同颜⾊绘制饼状图//伪代码var canvas = document.createElement("canvas");var ctx = canvas.getContext('2d');ctx.beginPath();ctx.arc(圆⼼x轴坐标,圆⼼y轴坐标,半径,绿⾊开始⾓,绿⾊结束⾓);ctx.fillStyle = 'green';ctx.closePath();ctx.fill();ctx.beginPath();ctx.arc(圆⼼x轴坐标,圆⼼y轴坐标,半径,红⾊开始⾓,红⾊结束⾓);ctx.fillStyle = 'red';ctx.closePath();ctx.fill();ctx.beginPath();ctx.arc(圆⼼x轴坐标,圆⼼y轴坐标,半径,黄⾊开始⾓,黄⾊结束⾓);ctx.fillStyle = 'yellow';ctx.closePath();ctx.fill();ctx.beginPath();ctx.arc(圆⼼x轴坐标,圆⼼y轴坐标,半径,紫⾊开始⾓,紫⾊结束⾓);ctx.fillStyle = 'purple';ctx.closePath();ctx.fill();3.动态绘制饼状图动态绘制圆⽹上普遍推荐三种⽅法:requestAnimationFrame、setInterval(定时)、还有动态算⾓度的。
HTML5之Canvas绘图——使用Canvas绘制图形的基本教程

HTML5之Canvas绘图——使⽤Canvas绘制图形的基本教程HTML5⽕的正热,最近有个想法也是要⽤到HTML的相关功能,所以也要好好学习⼀把。
好好看了⼀下Canvas的功能,感觉HTML5在客户端交互的功能性越来越强了,今天看了⼀下Canvas绘图,下边是⼏个实例,记下以备后⽤。
1、使⽤Canvas绘制直线:<!doctype html><html><head><meta charset="UTF-8"></head><style type="text/css">canvas{border:dashed 2px #CCC}</style><script type="text/javascript">function $$(id){return document.getElementById(id);}function pageLoad(){var can = $$('can');var cans = can.getContext('2d');cans.moveTo(20,30);//第⼀个起点cans.lineTo(120,90);//第⼆个点cans.lineTo(220,60);//第三个点(以第⼆个点为起点)cans.lineWidth=3;cans.strokeStyle = 'red';cans.stroke();}</script><body onload="pageLoad();"><canvas id="can" width="400px" height="300px">4</canvas></body></html>这⾥⽤到的两个API⽅法,moveTo和lineTo分别是线段的起点和终点坐标,变量为(X坐标,Y坐标),strokeStyle、stroke分别路径绘制样式和绘制路径。
使用Canvas绘制动态图形和动画
使用Canvas绘制动态图形和动画Canvas(画布)是HTML5中的一个重要功能,它允许我们通过JavaScript在网页上绘制图形和动画。
利用Canvas,我们可以创建各种各样的交互式网页元素,为用户提供更加丰富和生动的视觉体验。
本文将介绍一些基本的Canvas绘图技巧,并给出一些示例,帮助读者更好地理解和运用Canvas。
首先,要使用Canvas绘制图形,我们需要在HTML文件中添加一个画布元素。
例如:```<canvas id="myCanvas" width="600" height="400"></canvas>```在JavaScript中,我们可以通过获取画布元素的上下文(context)来绘制图形。
Canvas提供了两种绘图上下文:2D和WebGL。
2D上下文是较为常用的,适合绘制2D图形和动画。
我们可以使用如下代码获取2D上下文:```var canvas = document.getElementById("myCanvas");var ctx = canvas.getContext("2d");```接下来,我们可以使用绘图上下文的各种方法来绘制图形。
例如,如果我们要绘制一个矩形,可以使用`ctx.fillRect(x, y, width, height)`方法。
其中x和y是矩形左上角的坐标,width和height是矩形的宽度和高度。
我们还可以使用`ctx.strokeRect(x, y, width, height)`方法绘制一个只有边框的矩形。
除了绘制简单的形状,Canvas还提供了一些用于绘制路径的方法,例如`ctx.beginPath()`用于开始一个新的路径,`ctx.moveTo(x, y)`用于将路径的起点移动到(x, y)处,`ctx.lineTo(x, y)`用于从当前点画一条直线到(x, y)处,`ctx.closePath()`用于闭合路径等。
Html5饼图绘制实现统计图的方法
Html5饼图绘制实现统计图的⽅法Html5提供了强⼤的绘图API,让我们能够使⽤javascript轻松绘制各种图形。
本⽂将主要讲解使⽤HTML5绘制饼图(统计图)的⽅法。
先看⼀下饼图效果:这个图是动态⽣成的,根据传⼊的⽐例参数(数组),来动态绘制饼图。
饼图的⼤⼩也是根据<canvas>⾼度来动态调整的。
全部代码如下:<!DOCTYPE html><html><head><title>Canvas测试</title><meta charset="UTF-8"><script>//绘制饼图function drawCircle(canvasId, data_arr, color_arr, text_arr){var c = document.getElementById(canvasId);var ctx = c.getContext("2d");var radius = c.height / 2 - 20; //半径var ox = radius + 20, oy = radius + 20; //圆⼼var width = 30, height = 10; //图例宽和⾼var posX = ox * 2 + 20, posY = 30; //var textX = posX + width + 5, textY = posY + 10;var startAngle = 0; //起始弧度var endAngle = 0; //结束弧度for (var i = 0; i < data_arr.length; i++){//绘制饼图endAngle = endAngle + data_arr[i] * Math.PI * 2; //结束弧度ctx.fillStyle = color_arr[i];ctx.beginPath();ctx.moveTo(ox, oy); //移动到到圆⼼ctx.arc(ox, oy, radius, startAngle, endAngle, false);ctx.closePath();ctx.fill();startAngle = endAngle; //设置起始弧度//绘制⽐例图及⽂字ctx.fillStyle = color_arr[i];ctx.fillRect(posX, posY + 20 * i, width, height);ctx.moveTo(posX, posY + 20 * i);ctx.font = 'bold 12px 微软雅⿊'; //斜体 30像素微软雅⿊字体ctx.fillStyle = color_arr[i]; //"#000000";var percent = text_arr[i] + ":" + 100 * data_arr[i] + "%";ctx.fillText(percent, textX, textY + 20 * i);}}function init() {//绘制饼图//⽐例数据和颜⾊var data_arr = [0.05, 0.25, 0.6, 0.1];var color_arr = ["#00FF21", "#FFAA00", "#00AABB", "#FF4400"];var text_arr = ["第⼀季度", "第⼆季度", "第三季度", "第四季度"];drawCircle("canvas_circle", data_arr, color_arr, text_arr);}//页⾯加载时执⾏init()函数window.onload = init;</script></head><body><h3>HTML5绘制饼图演⽰</h3><p><canvas id="canvas_circle" width="500" height="300" style="border:2px solid #0026ff;" >浏览器不⽀持canvas</canvas></p></body></html>这个函数可以直接使⽤,如果想做的更漂亮,可以增加⼀些额外的美观绘制。
使用Canvas实现数据可视化图表和图形的技术要点和实例
使用Canvas实现数据可视化图表和图形的技术要点和实例数据可视化是现代数据分析和数据展示的关键技术之一。
通过图表和图形展示数据,可以帮助人们更直观地理解和分析复杂的数据。
而Canvas技术则提供了强大的绘图功能,使得开发者可以灵活地定制和绘制各种图表和图形。
本文将介绍使用Canvas实现数据可视化图表和图形的技术要点和实例。
一、Canvas是什么Canvas是一项基于HTML5的绘图标准,它提供了一套API,可以用来绘制图像、动画和其他富媒体效果。
在Web开发中,我们可以通过使用Canvas技术,将数据可视化呈现出来,使得数据更加生动和易于理解。
二、使用Canvas绘制图表的技术要点1. 数据准备要绘制图表,首先需要准备好要展示的数据。
数据可以来源于数据库、文件或者网络请求等途径。
在准备数据的过程中,需要进行数据的清洗、处理和筛选,确保数据的准确性和合理性。
2. 设计图表类型和样式不同的数据需要使用不同的图表类型来展示。
常见的图表类型有折线图、柱状图、饼图等。
在选择图表类型时,需要根据实际需求和数据特点进行选择,确保图表的可读性和易于理解。
同时,在设计图表的样式时,可以选择不同的颜色、线条类型和字体等元素,使得图表更加美观。
3. 确定坐标系和比例尺在绘制图表前,需要确定坐标系和比例尺。
坐标系用于确定图表的坐标轴和数据点的位置,比例尺用于确定数据值和坐标轴上的刻度。
通过确定坐标系和比例尺,可以将数据准确地映射到图表中,保证数据的准确性。
4. 绘制图表在绘制图表时,可以使用Canvas提供的基本绘图函数,如strokeRect、fillRect和lineTo等。
可以根据数据点的坐标,在画布上绘制相应的图形,如线条、矩形和圆形等,来表达数据之间的关系。
5. 添加交互和动画效果为了增强用户体验,可以在图表上添加交互和动画效果。
可以通过监听鼠标事件,实现图表的拖动、缩放和高亮等操作。
同时,可以使用CSS3和JavaScript技术,实现图表的渐变、旋转和缩放等动画效果,使得图表更加生动和有趣。
第6章 HTML5的canvas绘图
矩阵乘法是这样定义的:假设有两个矩阵A和B ,如果要通过A*B得到C,那么矩阵A的列数必 须与矩阵B的行数相同,方才能进行运算。得到 的新的矩阵的第 i 行 ,第 j 列的值 就是A的第 i 行 与 B 的第 j 列相对应的值相乘,然后相加的 结果。
HTML5+CSS3 Web 前端开发技术
6.6 在canvas中使用图像
首先,我们来看看图形在画布上的移动。 算法很简单:
X’ = X + a
Y’ = Y + b
这样就把点(X,Y)移动到了(X’,Y’)。
对应的变换的矩阵就是
X’ 1 0 a
X
Y’ = 0 1 b * Y
1
001
1
X’ = 1*X + 0*Y + a*1;
这个方法只接受一个参数:旋转的角度(angle),它是顺时针方向的,以弧度为单位的值
HTMLc5t+xC.rSoSt3aWtee(ba前n端g开le发);技术
6.5 使用坐标变换和矩阵变换绘图
示例6-15(script15.js)中使用坐标变换方法绘制了一组变形图形。
HTML5+CSS3 Web 前端开发技术
交汇处的拐角形状
角
round:创建圆角拐角
bevel:创建斜角拐角
HTML5+CSS3 Web 前端开发技术
6.3 使用路径绘制图形
示例6-8(script08.js)绘制了宽度从2像素到10像素不等的5 条直线。
HTML5+CSS3 Web 前端开发技术
6.3 使用路径绘制图形
6-9 (script09.js)示例中先用数组保存butt、round、square三种线 条端点属性值,然后使用循环访问数组元素,为每条直线添加不同端点。
- 1、下载文档前请自行甄别文档内容的完整性,平台不提供额外的编辑、内容补充、找答案等附加服务。
- 2、"仅部分预览"的文档,不可在线预览部分如存在完整性等问题,可反馈申请退款(可完整预览的文档不适用该条件!)。
- 3、如文档侵犯您的权益,请联系客服反馈,我们会尽快为您处理(人工客服工作时间:9:00-18:30)。
HTML5视频教程之基于HTML5 Canvas的3D动态Chart图表的制作
HTML5 Canvas的3D动态Chart图表的制作有多少喜欢HTML5或者是从事HTML5开发技术的人员了解且懂得制作的?本篇文章小编就给大家分享一下基于HTML5 Canvas的3D动态Chart图表的示例,想要学习或了解的小伙伴就随小编一起来看一下吧。
现在工业SCADA上或者电信网管方面用图表的特别多,虽然绝大部分人在图表制作方面用的是echarts,他确实好用,但是有些时候我们不能调用别的插件,这个时候就得自己写这些美丽的图表了,然而图表轻易做不成美丽的。
这个例子用HT 实现真的很容易,首先创建一个HT 中最基础的dm 数据模型,然后将数据模型添加进g3d 3d 组件中,再设置3d 中的视角并把3d 组件添加进body 元素中:
dm = new ht.DataModel();
g3d = new ht.graph3d.Graph3dView(dm);
g3d.setEye(0, 185, 300);
g3d.addToDOM();
g3d.getView().style.background = '#000';
接着就是造这五个chart图表条了,我的思路是这样的,里层有一个节点,外层一个透明的节点,底部一个3d 的文字显示当前的百分比。
里层的节点非常容易,我直接用的HT 封装的ht.Node 创建了一个新的节点对象,然后通过node.s 方法来设置node 节点的样式:
var node = new ht.Node();
node.s({
'shape3d': cylinderModel,
'shape3d.color': color,
'3d.movable': false
});
node.a({
'myHeight': s3[1],
});
node.p3([p3[0], s3[1]/2, p3[2]]);
node.s3(s3);
dm.add(node);
其中要说明的是,'shape3d':cylinderModel 这个样式的设置,首先,shape3d 属性指定显示为3d 模型的图标效果,cylinderModel 是用HT 自定义的一个3d 模型,可参考HT for Web 建模手册:
cylinderModel = ht.Default.createCylinderModel(1000, 0, 1000, false, false, true, true);
然后设置了一个动态变化的属性myHeight,在HT 中,node.a 方法是预留给用户存储业务数据的,我们可以在这边添加任意多个属性。
接下来我们要创建的是外部的透明节点,这个节点的构造方式基本上与内部节点相同,就是多了一点“透明”的样式设置:
var cNode = new ht.Node();
cNode.s({
'shape3d': cylinderModel,
'shape3d.transparent': true,
'shape3d.opacity': 0.2,
'label.color': '#fff',
'3d.movable': false
});
cNode.p3([p3[0], 50, p3[2]]);
cNode.s3(20, 100, 20);
dm.add(cNode);
要先设置‘shape3d.transparent’ 为true,再设置‘shape3d.opacity’ 透明度。
最后是3d 文字,呈现3d 文字需要一个json 格式的typeface 字体,然后通过
ht.Default.loadFontFace 来加载json 格式的字体到内存中,详情请参考HT for Web 3D 手册:
ht.Default.loadFontFace('./wenquanyi.json', function(){
//......
var text = new ht.Node();
text.s3([5, 5, 5]);
text.p3(cNode.p3()[0]-5, -10, 0);
dm.add(text);
text.s({
'shape3d' : 'text',
'shape3d.text': node.a('myHeight')+'%',
'shape3d.text.curveSegments': 1,
'3d.movable': false
});
});
因为我们用的typeface 字体的绘制方式是无数个三角形构成的一个字,会占用很大的内存,所以我把图形的曲线的精细度调得较低,但是还是很清晰,如果你们能找到性能更好的字体,可以使用并且告知我一下,我们目前没找到占用内存小的字体。
最后,要动态的变化chart 图表中的柱形图,我们得设置动画,并且将3d 字体也同步更新数值:
setInterval(function(){
if(node.a('myHeight') < 100){
node.a('myHeight', (node.getAttr('myHeight')+1));
node.s3(20, node.a('myHeight'), 20);
node.p3(p3[0], node.a('myHeight')/2, p3[2]);
}else{
node.a('myHeight', 0);
node.s3([20, 0, 20]);
node.p3([p3[0], 0, p3[2]]);
}
if (text) text.s('shape3d.text', node.a('myHeight')+'%');
}, 100);
这里,自定义的属性“myHeight” 就起到了决定性的作用,用这个属性来存储变量,而且可以任意更改变量的值,这样就能实现动态绑定的效果了。
以上就是小编给大家分享的基于HTML5 Canvas的3D动态Chart图表的示例,希望对小伙伴们有所帮助。