探针说明书
Ocean Optics 透光pH探针系统说明书
Transmissive pH ProbeInstructionsOverviewOcean Optics’ fully integrated pH systems provide full spectral analysis to help eliminate errors from dye leaching or from changes in turbidity, temperature, and ionic strength. Inherent calibration based on the physical properties of the immobilized indicator dye eliminates the need for frequent calibration. The ratiometric algorithm provides accurate and reproducible measurements at a high resolution.The Transmissive pH Probe’s form factor provides very fast response with high signal strength, though is limited to clear, non-turbid solutions. These sensors are compatible with aqueous solutions, ethanol/methanol solutions, ammonia, peroxides, and sodium hypochlorite solutions. Transmissive Probes and PatchesThe pH sensory substrates use a sol gel sensing material coated onto a transmissive patch. The immobilized indicator dye(s) are encapsulated into the sol gel matrix, allowing for the diffusion of ions while preventing leaching of the dye. The sensors provide very accurate measurements in the biological range, from pH 5 to 9. Advantages of these probes over traditional potentiometric devices include faster response time, easy storage and no maintenance, and low cost. These are especially useful for monitoring low conductivity samples such as boiler water, where electrode devices fail. Software InterfaceThe Transmissive pH Probes can be used with a desktop system or the Jaz handheld spectrometer. The desktop system uses a special SpectraSuite software module that allows for easy calibration, convenient pH readings, customizable data logging, and comprehensive export of data and calibration values.pH Probe InstructionsTransmissive pH Probe Benefits∙Chemistry-Proprietary Organically Modified Sol Gel (ORMOSIL) formulation engineered to maximize immunity to ionic strength sensitivity-Compatible with some organic solvents (i.e. acetone, alcohols, aromatics) ◊ Sol-Gel material chosen over typical polymer method, allowing for a faster response -time, versatility in the desired dopants, greater chemical compatibility, flexible coating, and enhanced thermal and optical performance-Indicator molecule allows high resolution measurement in biological range (pH 5-9)∙Simplified algorithm takes analytical and baseline wavelengths into account to reduce errors caused by optical shifts∙Sterilization-Transmissive patches are autoclavable-Transmissive patches are gamma and ethylene oxide sterilizable∙Maintenance-Long-term storage-Dry or wet storage-Single point reset∙Applications-Organic solvents-Low ionic strength cooling water-Biological Processes-Environmental∙Durable design allows probe to survive conditions/shocks that would cause glass electrodes to breakFiber Optic pH Sensor System ComponentsThe Fiber Optic pH Sensor system consists of the following:∙Transmissive pH probe (T300-UV/VIS or VIS/NIR)∙Ocean Optics VIS-NIR spectrometer (or Jaz Sensor module) that covers 350–1100 nm (slit options 25, 50, 100, 200)∙SpectraSuite Spectrometer Operating Software for reading values∙Light source (LS-1 Tungsten Halogen Light Source or a white LED)∙Transmissive pH patches, pack of 5 (PH-BCG-TRANS)Calibration requires recording spectra in high and low pH samples, as well as in at least one pH standard solution (such as a NIST-traceable buffer).pH Probe Instructions For field measurements, the Ocean Optics handheld Jaz spectrometer offers an easy and portable solution. An SD card contains a script that allows you to use the factory calibration or a complete calibration, shows live pH values and provides the ability to save data right onto the SD card. Probe Storage/LifetimeProbes can be stored dry at room temperature for any amount of time. As they are used, the patches may slowly leach indicator dye from the sensing material. As a rule, once the maximum absorbance at pH 11 falls below 0.1, the patch should be discarded and replaced (assumes a reference of pH 1). The patch’s lifetime depends on frequency of use, harshness of the samples it is exposed to, the temperature of samples, and other environmental factors.Nature of SamplesThe analyte solutions being measured should have a pH within the biological range (pH 5-9) for accurate readings. Data obtained from analyte solutions that register values above or below this range should not be considered valid within the specifications of the sensors. Aqueous solutions,ethanol/methanol solutions, peroxides, ammonia, and sodium hypochlorite solutions are all compatible with the sensor material. Samples being used with the transmissive probe should be optically transparent, having no turbidity or sediment present. It is also ideal to have analyte solutions that are colorless, though colored liquids can be compensated for.Response time is dependent on the ionic strength of the solution, with higher salinity samples responding notably faster. For example, using the calibration buffers of pH 5 – 8 will show a 90% response in 10 seconds or less, but when pure D.I. water is being measured, more time is needed to equilibrate at a final value. Make sure that the probe is sufficiently submersed into the analyte solution, and that there are not bubbles present. To ensure no bubbles remain, shake the probe back and forth through the liquid to knock them free. Likewise, more accurate results will be obtained if the probe is rinsed once or twice with the analyte solution after calibration. This removes any residual buffer solution that may contaminate your sample.When immersed in solution, the film dyes may leach very slowly over time and will have to be replaced. The film response rate is limited by diffusion of ions into the material; therefore increasing stirring speed and ionic strength tend to increase the response rate.pH Probe Set UpThe following procedures describe how to connect and calibrate the transmissive pH probe using a VIS-NIR spectrometer, a light source and SpectraSuite software. See your spectrometer, light source and SpectraSuite manual for more detailed installation information (available at/technical/operatinginstructions.asp).pH Probe InstructionsInstalling the pH Sensor System►ProcedurePerform the steps below to install the pH Sensor components:1.Install SpectraSuite software on your computer.2.Connect the spectrometer to your computer using the supplied USB cable.3.Install the light source as specified in its instructions.4.Attach the fibers between the spectrometer, probe, and light source. The transmissive probehas two identical legs.5.Turn on the light source and allow it to warm up for the period specified in the light sourceinstructions.6.The cap for the transmissive probe screws off.The probe uses a thin sensing film withadhesive on one side. This can be affixed to the lens of the probe. A second patch can beaffixed to the mirror as well to dramatically increase signal strength and pH resolution.Calibrating the pH Sensor SystemThe pH sensor patches include a pre-calibrated pK value determined at the factory. This value was originally obtained at 22°C, and it is recalculated using the temperature compensation algorithm based on the temperature that was entered in SpectraSuite’s Calibration Wizard. Using the Factory Calibration method is ideal for being able to start making pH measurements quickly, though it is less accurate than performing an Independent Calibration. The specifications listed for the probes assume a complete Independent Calibration, as this eliminates the errors seen from temperature and other environmental differences.Using Factory Calibration►Procedure1.Open SpectraSuite and select File | New | New Sol Gel pH Measurement.2.Click the Calibration Wizard button to begin the calibration.3.Select the spectrometer to use and click Next.4.Select Use Factory Calibration. Click the box for Using Reflective Probe, and then clickNext. The Enter Experimental Parameters screen appears.pH Probe Instructions5.Enter your Experimental parameters: Acquisition Wavelength, Baseline Wavelength, andapproximate Ambient Temperature. Click Set, then click Next.NoteFor pH probes that perform in the biological range (pH 5 – 9), the AcquisitionWavelength is 620nm and the Baseline Wavelength is 509nm.6.Enter the value for pK that came with your probe pH patch. Then click Next.7.Take a low pH reference spectrum at pH 1.0. To do this,a.Submerge the probe tip in pH 1 buffer and shake back and forth to remove bubbles.b.Wait 30 seconds, then click Acquire. The spectrum shown should have a maximumintensity around 80% of the saturation level. Most Ocean Optics spectrometers have asaturation limit of 4000 counts. If saturation is occurring, reduce the integration timeappropriately. If the signal is too low, increase the integration time until the intensity at620nm is at least over 1000 counts.c.You can click Acquire repeatedly to update the spectrum after adjusting the integrationtime; the last time you press the button will be the last reference that is saved.d.Once the signal looks strong, make sure you’ve updated the acquisition and then clickNext.8.Take a dark spectrum. To do this, block the light source and click Acquire Dark Spectrum.Then click Next. Be sure to allow enough time for the system to complete an entire scan while in the dark before acquiring the spectrum.9.Unblock the light source.pH Probe Instructions10.Take a high reference spectrum for pH 11.0. To do this, submerge the probe tip in pH 11buffer and shake back and forth to remove bubbles. It’s a good idea to rinse the probe with buffer before submersion to ensure residual buffer from before does not contaminate your sample. Allow 30 seconds, and then click Acquire. When complete, click Next.11. Depending on the value for pK you previously entered, the wizard will ask you to expose theprobe to either pH 5 or pH 8. For pK values less than 6.5, pH 8 is used; for pK value greaterthan 6.5, pH 5 is used.Submerge the probe tip in the requested buffer and shake back andforth to remove bubbles. Allow 30 seconds, click Acquire, and then click Finish.12.You are now ready to take pH measurements. See Taking pH Measurements. Performing an Independent Calibration►Procedure1.Open SpectraSuite and select File | New | New Sol Gel pH Measurement.2.Click the Calibration Wizard button to begin the calibration.3.Select the spectrometer to use and click Next.4.Select Perform Independent Calibration. Click the box for Using Reflective Probe, andthen click Next. The Enter Experimental Parameters screen appears.5.Enter your Experimental parameters: Acquisition Wavelength, Baseline Wavelength, andapproximate Ambient Temperature. Click Set, then click Next.NoteFor pH probes that perform in the biological range (pH 5 – 9), the AcquisitionWavelength is 620nm and the Baseline Wavelength is 509nm.pH Probe Instructions6.Take a low pH reference spectrum at pH 1.0. To do this,a.Submerge the probe tip in pH 1 buffer and shake back and forth to remove bubbles.b.Wait 30 seconds, then click Acquire. The spectrum shown should have a maximumintensity around 80% of the saturation level. Most Ocean Optics spectrometers have asaturation limit of 4000 counts. If saturation is occurring, reduce the integration timeappropriately. If the signal is too low, increase the integration time until the intensity at620nm is at least over 1000 counts.c.You can click Acquire repeatedly to update the spectrum after adjusting the integrationtime; the last time you press the button will be the last reference that is saved.d.Once the signal looks strong, make sure you’ve updated the acquisition and then clickNext.7.Take a dark spectrum. To do this, block the light source and click Acquire Dark Spectrum.Then click Next. Be sure to allow enough time for the system to complete an entire scan while in the dark before acquiring the spectrum.8.Unblock the light source.9.Take a high reference spectrum for pH 11.0. To do this, submerge the probe tip in pH 11buffer and shake back and forth to remove bubbles. It’s a good idea to rinse the probe with buffer before submersion to ensure residual buffer from before does not contaminate your sample.Allow 30 seconds,and then click Acquire. When complete, click Next.10.Follow the wizard and repeat Step 9 for pH buffers 5, 6, 7, and 8 (follow on-screen prompts).Again, it is a good idea to rinse the probe tip with buffer before submersion to prevent sample contamination. Then, click Finish.11. You are now ready to take pH measurements.Taking pH MeasurementsNow that you have finished calibrating your pH sensor system, you can take pH measurements in the biological range.►Procedure1.Submerge the probe tip into analyte solution for pH measurement in the biological range. ThepH value appears on the screen in the Current pH field (upper right corner).pH Probe Instructions2.Click the Run/Stop button to toggle data acquisition appearing in the lower table on thescreen. Data is recorded at the time interval you specify in the Time Increment (sec) field.3.Click one or all of the following buttons:∙Reset: Clears the table and restarts the run time.∙Export: Opens a window to save your data in a format that can be opened with Microsoft Excel or a text program such as WordPad. The exported data file contains all of thevariables that you have entered and have been calculated, along with a time stamp for dataacquisition and save, the time-resolved pH data, and complete spectra for all reference andcalibration buffers used.∙Export Calibration: Opens a window to save your calibration data. This creates a file containing the reference spectra and other variables that can later be loaded via theCalibration Wizard, allowing for very quick setup.pH Probe InstructionsAlgorithms Used pH Calculation⎪⎪⎭⎫ ⎝⎛-+=Sample pH Sample Abs Abs Abs Slope pK pH 11log *…where Abs Sample is the sample absorbance at 620nm with baseline correction, and Abs pH11 is the absorbance at pH 11 at 620nm with baseline correction.Temperature CompensationWhen you select Use Factory Calibration in SpectraSuite, the value for pK is adjusted via the van’t Hoff equation based on the current temperature you entered:⎪⎪⎭⎫ ⎝⎛+=⎪⎪⎭⎫ ⎝⎛+=⎪⎪⎭⎫ ⎝⎛--⎪⎪⎭⎫ ⎝⎛--121211*4801211*48012log log T T T T e pH pH e pK pK Resetting pK and SlopeAn x-y plot is made using data obtained from intermediate buffers 5 through 8. The x-axis is of the term:⎪⎪⎭⎫ ⎝⎛-Sample pH Sample Abs Abs Abs 11log …for each of the buffers. The y-axis shows the pH value of the buffers. This generates a plot such as the one shown below:pH Probe InstructionsPerforming a linear fit gives a line with pK equal to the y-intercept and slope equal to the slope. In the example chart above, the new pK value would be 6.2977 and the new slope value would be 1.7248. SpecificationsSpecification Ocean Optics pH Probe ValuepH Range 5 – 9Temperature Range-5 – 80°CAccuracy<1% of reading across rangeResolution0.02 pHResponse Time (t90)30 secondsResponse time increases with decreasing ionic strength Calibration Requirements (minimum) 3 buffersSterilization Gamma, EtO, AutoclaveChemical Compatibility Aqueous, alcohols, some organic solvents, peroxides,ammonia, sodium hypochloriteChemicals to Avoid Concentrated acidsDrift (Continuous Stability) 1% per dayDiscrete Stability (Lifetime)50 uses or more, dispose when absorbance atpH 11 < 0.1 (assumes pH 1 reference)Storage Conditions Dry or wet storage。
Actin-Tracker Green(微丝绿色荧光探针) 产品说明书
Actin-Tracker Green(微丝绿色荧光探针) 产品编号产品名称包装C1033 Actin-Tracker Green(微丝绿色荧光探针) 0.2ml产品简介: Actin-Tracker Green 是一种Actin 绿色荧光探针,可以用于培养细胞或组织切片的Actin 特异性荧光染色。
Actin-Tracker Green 探针为荧光染料FITC 标记的毒蕈肽(phalloidin),即phalloidin-FITC ,其分子量约为1251.4,最大激发波长为496nm ,最大发射波长为516nm 。
本产品可以用于细胞或组织内的微丝(microfilament)的荧光检测。
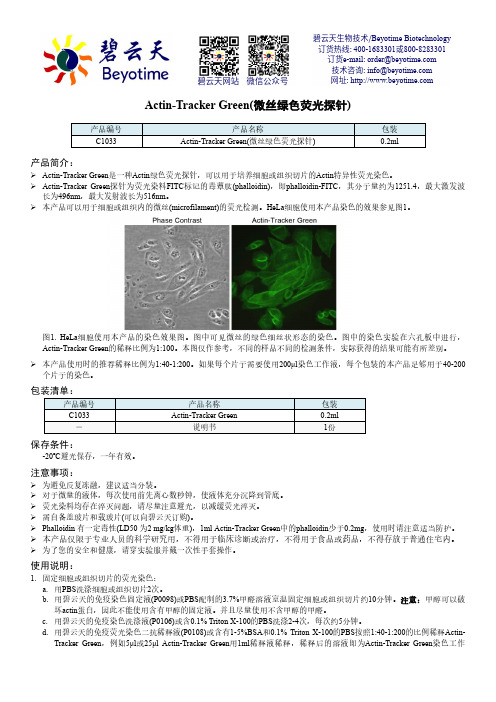
HeLa 细胞使用本产品染色的效果参见图1。
图1. HeLa 细胞使用本产品的染色效果图。
图中可见微丝的绿色细丝状形态的染色。
图中的染色实验在六孔板中进行,Actin-Tracker Green 的稀释比例为1:100。
本图仅作参考,不同的样品不同的检测条件,实际获得的结果可能有所差别。
本产品使用时的推荐稀释比例为1:40-1:200。
如果每个片子需要使用200μl 染色工作液,每个包装的本产品足够用于40-200个片子的染色。
包装清单:产品编号产品名称 包装 C1033Actin-Tracker Green 0.2ml - 说明书 1份保存条件:-20ºC 避光保存,一年有效。
注意事项:为避免反复冻融,建议适当分装。
对于微量的液体,每次使用前先离心数秒钟,使液体充分沉降到管底。
荧光染料均存在淬灭问题,请尽量注意避光,以减缓荧光淬灭。
需自备盖玻片和载玻片(可以向碧云天订购)。
Phalloidin 有一定毒性(LD50 为2 mg/kg 体重),1ml Actin-Tracker Green 中的phalloidin 少于0.2mg ,使用时请注意适当防护。
本产品仅限于专业人员的科学研究用,不得用于临床诊断或治疗,不得用于食品或药品,不得存放于普通住宅内。
sosg荧光探针使用说明书

sosg荧光探针使用说明书
sosg荧光探针是一种高度灵敏的生物分子探针,可用于定量分析和定位生物分子。
该荧光探针受体结构特异性强,对样品的检测灵敏度高,因此广泛应用于生物药物分析、环境监测、医药研发等领域。
一、适用范围
sosg荧光探针广泛适用于生物分子的检测和研究,包括但不限于以下领域:
1、生物药物分析
2、环境监测
3、医药研发
二、使用方法
1、实验准备:
准备所需样品和实验仪器,确保实验室环境清洁,避免环境对实验结果的影响。
2、探针使用:
将sosg荧光探针加入样品中,按照标准操作程序进行操作,运用实验仪器进行检测。
对于样品的检测,建议采用正交实验设计,以获得最优检测效果。
3、实验分析:
根据实验结果进行数据分析和处理,获得所需要的结论。
三、使用注意事项
1、操作中注意个人安全,避免荧光污染。
2、荧光探针存储温度为-20℃,避免阳光直射。
3、严格按照使用说明使用荧光探针,以获得最佳检测效果。
4、如有其他疑问或者操作上需要帮助,请联系专业人员。
总之,sosg荧光探针是一种高度灵敏的生物分子探针,适用范围广泛,使用方法简便,且对样品的检测灵敏度高。
在实验操作中需要注意个人安全,正确存储荧光探针,严格按照使用说明进行操作,以获得最佳检测效果。
f374 二价铁离子检测探针说明书

f374 二价铁离子检测探针说明书二价铁离子检测探针是一种用于快速、准确检测水中二价铁离子浓度的工具。
本说明书将为用户提供有关探针的详细信息,包括使用方法、操作步骤和注意事项等内容。
一、产品简介:二价铁离子是一种广泛存在于自然水体中的重要离子,其浓度的高低直接影响水体的质量和环境状况。
二价铁离子的检测对于环境保护、水质监测和工业生产等领域具有重要意义。
本探针基于化学荧光原理,通过与二价铁离子的特定反应生成荧光信号,从而实现对二价铁离子浓度的快速、准确检测。
二、产品性能:1.灵敏度高:本探针能够在较低浓度范围内检测二价铁离子,灵敏度远高于传统的分光光度法或浊度法。
2.反应快速:探针与二价铁离子的反应快速完成,反应时间短,可以在几分钟内得到结果。
3.准确性高:由于探针与二价铁离子的高度特异性反应,其检测结果具有较高的准确性和可靠性。
4.操作简便:使用本探针只需要简单的操作步骤,无需使用昂贵的仪器设备,非专业人士也能轻松操作。
三、使用方法:1.准备工作:a.检测前,确保探针的包装完好无损,避免受潮、受热或受光等。
b.打开探针包装,取出探针。
2.检测操作步骤:a.取一定量的待测水样,放置在透明玻璃容器中。
b.将探针插入待测水样中,确保探针全部浸入水中并稳定。
c.静置一定时间(一般不超过5分钟),待探针与二价铁离子发生反应。
d.从水中取出探针,观察探针表面的荧光信号。
四、注意事项:1.使用前请仔细阅读本说明书,并按照说明进行操作。
2.探针仅适用于二价铁离子的检测,不可用于其他离子或化合物的检测。
3.请保管好探针,避免受到外界光照和湿气的影响。
4.若探针包装损坏或过期,请勿使用,以免影响检测结果的准确性。
5.在使用过程中,如发现探针异常或者结果与预期不符,请立即停止使用并与供应商联系。
五、注意事项:本探针仅提供二价铁离子的快速、准确检测,不对水质的其它指标提供判定。
用户在进行水质监测时还需结合其它指标进行综合判定。
DiI (细胞膜红色荧光探针)说明书

DiI (细胞膜红色荧光探针)产品编号 产品名称包装 C1036DiI (细胞膜红色荧光探针)10mg产品简介:DiI 即DiIC 18(3),全称为1,1'-dioctadecyl-3,3,3',3'-tetramethylindocarbocyanine perchlorate ,是最常用的细胞膜荧光探针之一,呈现橙红色荧光。
DiI 是一种亲脂性膜染料,进入细胞膜后可以侧向扩散逐渐使整个细胞的细胞膜被染色。
DiI 在进入细胞膜之前荧光非常弱,仅当进入到细胞膜后才可以被激发出很强的荧光。
DiI 被激发后可以发出橙红色的荧光,DiI 和磷酯双层膜结合后的激发光谱和发射光谱参考下图。
其中,最大激发波长为549nm ,最大发射波长为565nm 。
DiI 的分子式为C 59H 97ClN 2O 4,分子量为933.88,CAS number 为41085-99-8。
DiI 可以溶解于无水乙醇、DMSO 和DMF ,其中在DMSO 中的溶解度大于10mg/ml 。
发现较难溶解时可以适当加热,并用超声处理以促进溶解。
DiI 被广泛用于正向或逆向的,活的或固定的神经等细胞或组织的示踪剂或长期示踪剂(long-term tracer)。
DiI 通常不会影响细胞的生存力(viability)。
被DiI 标记的神经细胞在体外培养的条件下可以存活长达4周,在体内可以长达一年。
DiI 在经过固定的神经元细胞膜上的迁移速率为0.2-0.6mm/day ,在活的神经元细胞膜上的的迁移速率为6mm/day 。
DiI 除了最简单的细胞膜荧光标记外,还可以用于检测细胞的融合和粘附,检测发育或移植过程中细胞迁移,通过FRAP(Fluorescence Recovery After Photobleaching)检测脂在细胞膜上的扩散,检测细胞毒性和标记脂蛋白等。
用于细胞膜荧光标记时,DiI 的常用浓度为1-25µM ,最常用的浓度为5-10µM 。
EMSA突变探针-SP1 说明书
EMSA 突变探针-SP1 产品编号 产品名称 包装GS078M EMSA 突变探针-SP1 (1.75µM)60µl 产品简介:¾ EMSA 突变探针-SP1是用于EMSA(也称gel shift)研究的SP1 consensus oligonucleotide 的突变体。
可以作为EMSA 探针-SP1的阴性对照,用于EMSA 结合反应中突变探针的冷竞争反应等。
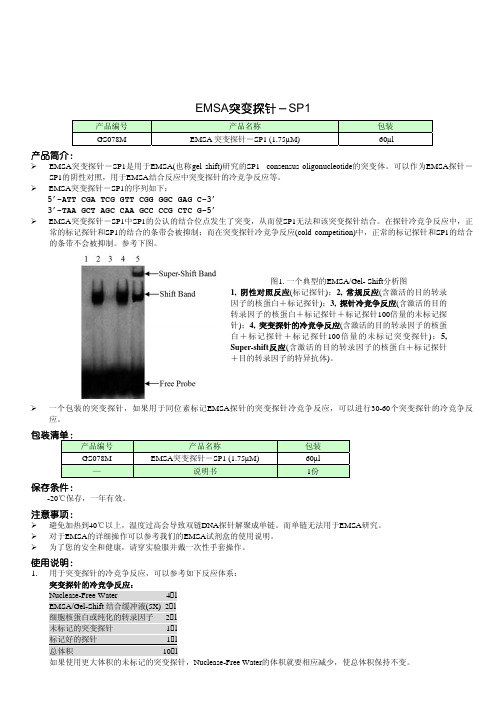
¾ EMSA 突变探针-SP1的序列如下:5’-ATT CGA TCG GTT CGG GGC GAG C-3’3’-TAA GCT AGC CAA GCC CCG CTC G-5’¾ EMSA 突变探针-SP1中SP1的公认的结合位点发生了突变,从而使SP1无法和该突变探针结合。
在探针冷竞争反应中,正常的标记探针和SP1的结合的条带会被抑制;而在突变探针冷竞争反应(cold competition)中,正常的标记探针和SP1的结合的条带不会被抑制。
参考下图。
¾ 一个包装的突变探针,如果用于同位素标记EMSA 探针的突变探针冷竞争反应,可以进行30-60个突变探针的冷竞争反应。
包装清单:产品编号 产品名称包装 GS078M EMSA 突变探针-SP1 (1.75µM)60µl — 说明书 1份 保存条件:-20℃保存,一年有效。
注意事项:¾避免加热到40℃以上,温度过高会导致双链DNA 探针解聚成单链。
而单链无法用于EMSA 研究。
¾对于EMSA 的详细操作可以参考我们的EMSA 试剂盒的使用说明。
¾ 为了您的安全和健康,请穿实验服并戴一次性手套操作。
使用说明: 1. 用于突变探针的冷竞争反应,可以参考如下反应体系:突变探针的冷竞争反应:Nuclease-Free Water 4µlEMSA/Gel-Shift 结合缓冲液(5X) 2µl细胞核蛋白或纯化的转录因子 2µl未标记的突变探针 1µl标记好的探针 1µl总体积 10µl如果使用更大体积的未标记的突变探针,Nuclease-Free Water 的体积就要相应减少,使总体积保持不变。
高尔基体红色荧光探针说明书
Golgi-Tracker Red (高尔基体红色荧光探针)产品简介:Golgi-Tracker Red 是一种高尔基体红色荧光探针,是神经鞘脂(sphingolipid)类荧光探针中的一种,可以用于活细胞高尔基体特异性荧光染色。
Golgi-Tracker Red 为采用Molecular Probes 公司的BODIPY TR 进行了荧光标记的C5-ceramide 。
Ceramide 或其类似物可以选择性地和高尔基体结合,因此荧光标记的ceramide 可以用作高尔基体特异性的荧光探针。
Golgi-Tracker Red 可以用于活细胞的高尔基体荧光标记,但不适合用于固定细胞的标记。
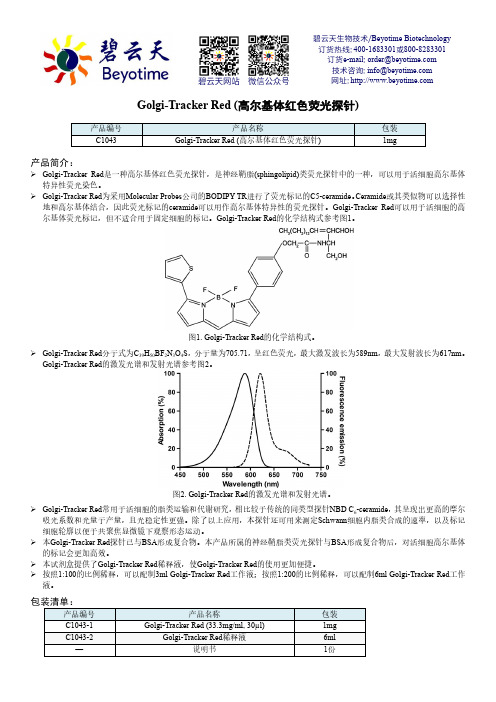
Golgi-Tracker Red 的化学结构式参考图1。
图1. Golgi-Tracker Red 的化学结构式。
Golgi-Tracker Red 分子式为C 39H 50BF 2N 3O 4S ,分子量为705.71,呈红色荧光,最大激发波长为589nm ,最大发射波长为617nm 。
Golgi-Tracker Red 的激发光谱和发射光谱参考图2。
图2. Golgi-Tracker Red 的激发光谱和发射光谱。
Golgi-Tracker Red 常用于活细胞的脂类运输和代谢研究,相比较于传统的同类型探针NBD C 6-ceramide ,其呈现出更高的摩尔吸光系数和光量子产量,且光稳定性更强。
除了以上应用,本探针还可用来测定Schwann 细胞内脂类合成的速率,以及标记细胞轮廓以便于共聚焦显微镜下观察形态运动。
本Golgi-Tracker Red 探针已与BSA 形成复合物。
本产品所属的神经鞘脂类荧光探针与BSA 形成复合物后,对活细胞高尔基体的标记会更加高效。
本试剂盒提供了Golgi-Tracker Red 稀释液,使Golgi-Tracker Red 的使用更加便捷。
按照1:100的比例稀释,可以配制3ml Golgi-Tracker Red 工作液;按照1:200的比例稀释,可以配制6ml Golgi-Tracker Red 工作液。
CFDA SE (细胞增殖示踪荧光探针) 说明书

CFDA SE (细胞增殖示踪荧光探针) 产品编号产品名称包装C1031 CFDA SE (细胞增殖示踪荧光探针) 5mg产品简介:CFDA SE 的全称为Carboxyfluorescein diacetate, succinimidyl ester ,是一种近年来被广泛应用的细胞增殖检测用荧光探针,也可以用于细胞的荧光示踪。
基于CFDA SE 荧光标记的细胞增殖检测和[3H]-thymidine 掺入、BrdU 标记获得的检测结果完全一致,但同时可以提供更多的细胞增殖信息。
使用CFDA SE 检测可以提供整个细胞群中有多少比例的细胞分裂了1次、2次或更多次数,同时如果和其它荧光探针联用,可以获取不同分裂次数细胞的其它相关信息。
CFDA-SE 的分子式为C 29H 19NO 11,分子量为557.47,CAS number 为150347-59-4。
CFDA SE 可以通透细胞膜,进入细胞后可以被细胞内的酯酶(esterase)催化分解成CFSE ,CFSE 可以偶发性地(spontaneously)并不可逆地和细胞内蛋白的Lysine 残基或其它氨基发生结合反应,并标记这些蛋白。
在加入荧光探针CFDA SE 后大约24小时,即可充分标记细胞。
被CFDA SE 标记的非分裂细胞的荧光非常稳定,稳定标记的时间可达数个月。
CFDA SE 标记细胞的荧光非常均一,比以前使用的其它细胞示踪荧光探针例如PKH26的荧光更加均一,并且分裂后的子代细胞的荧光分配也更均匀。
由于CFDA SE 标记细胞的荧光非常均匀和稳定,每分裂一次子代细胞的荧光会减弱一半,这样通过流式细胞仪检测就可以检测出没有分裂的细胞,分裂一次的细胞(1/2的荧光强度),分离两次的细胞(1/4的荧光强度),分裂三次的细胞(1/8的荧光强度)以及类似的其它分裂次数的细胞。
采用CFDA SE 通过流式细胞仪检测获得的检测结果参考右图。
每一个峰代表一种分裂次数的细胞,从右至左的峰通常依次为分裂0次、1次、2次、3次等次数的细胞。
- 1、下载文档前请自行甄别文档内容的完整性,平台不提供额外的编辑、内容补充、找答案等附加服务。
- 2、"仅部分预览"的文档,不可在线预览部分如存在完整性等问题,可反馈申请退款(可完整预览的文档不适用该条件!)。
- 3、如文档侵犯您的权益,请联系客服反馈,我们会尽快为您处理(人工客服工作时间:9:00-18:30)。
SZT-2C四探针测试仪使用说明书一概述SZT-2C型数字式四探针测试仪是运用四线法测量原理的多用途综合测量装置,配上专用的四探针测试架,即可以测量片状,块状或柱状半导体材料的径向和轴向电阻率,测量扩散层的薄层电阻(亦称方块电阻)。
四探针测试架有电动,手动,手持三种可以选配,另外还配有四个夹子的四线输入插头用来作为测量线状或片状电阻的中,低阻阻值。
仪器由主机,测试架等部份组成,测试结果由液晶显示器显示,同时,液晶显示器还显示测量类型(电阻率,方块电阻和电阻);探头修正系数和温度值,用来监测仪器使用时的环境温度。
主机由开关电源,DC/DC变换器,高灵敏度电压测量部份,高稳定度恒流源,和微电脑控制系统组成。
由於采用大规模集成电路,所以仪器可靠性高,测量稳定性好。
测试探头采用宝石导向轴套和高硬度钢针,定位准确,游移率小,使用寿命长。
仪器适用於半导体材料厂,半导体器件厂,科研单位,高等院校对半导体材料电阻性能的测试。
本仪器工作条件为:使用温度:23℃±3℃相对湿度:50%~70%工作室内应无强磁场干扰,不与高频设备共用电源,二,技术参数1,测量范围电阻率: 10⁻⁴-106Ω-cm方块电阻 10⁻⁴- 106Ω/□电阻 10-⁴- 106Ω2,可测半导体材尺寸直径:Ф5-250mm长(或高)度:≤400mm(如配探笔可以测量任意长度)3,测量方位轴向,径向均可4,数字电压表:(1)量程:20mV,200mV,2V(2)误差:±%读数±2字(3)输入阻抗:>10⁸Ω(4)最大分辨率:10μV(5)点阵液晶显示,过载显示。
5,恒流源:(1)电流输出:共分10μA,100uA,1mA,10mA,100mA六挡可通过按键选择,各挡均为定值不可调节,电阻率探头修正系和扩散层方块电阻修正系数均由机内CPU运算后,直接显示修正后的结果。
(2)误差:±%±2字,在使用1μA恒流电流输出时为±%±5字6,四探针测试头;(1) 探针间距: 1mm(2) 探针机械游移率: ±%(3) 探针材料: 碳化钨,Ф(4) 0-2Kg可调,最大压力约2Kg7,温度传感器;本仪器增加了高精度的温度传感器,以监测仪器使用时的环境温度。
温度测量的范围;+99℃— -55℃温度测量的精度;±℃8, 电源:交流 220V±10%功耗<35W本仪器可以选配电动测试架,手动测试架,手持探险头或四夹子电阻测量输入线。
1,电动测试架;电动测试架是用步进电机驱动测试头升降,只要将被测工件放在测试平台中心位置,按一次启动按钮,测试头自动下降,直到针头和被测工件接触,探头将自动以慢速下降一段距离压紧探针使针与工件接触良好并等待测量,稍候测量结束,探头上行并恢复到原来位置。
所以电动测试架的操作简便,探针对被测工件所施压力恒定,测量结果稳定,建议优先选配。
2,手动测试架以其结构简单不用电源见长,只要操作熟练,测量精度和稳定性也很好。
3,手持式四探针测试头,使用灵活可以对任意形状的半导体材料进行测试,而且脱离了测试架尺寸的限止,可以对大尺寸单晶硅柱的任意部位进行单点或多点测试,但由於探针对被测材料的压力是由手感控制的,因此,测量时必须将探头持稳压紧,保证探针和被测工件接触良好。
4带夹四线测试头,是必配件,可以用四线法测量低阻值电阻。
三,工作原理;1,测试原理;直流四探针法测试原理简介如下;(1)电阻率测量;(图一):当1,2,3,4四根金属针排成一直线时体材料上时,在1,4两根探针间通过电流I,则在2,3探针间产生电位差V,V (Ω-cm) (3-1)材料电阻率ρ=CI式中C为探针修正系数,由探针的间距决定。
当试样电阻率分布均匀,试样尺寸满足半无穷大条件时C=32212111112S S S S S S +-+-+π(cm) (3-2)式中:S 1,, S 2 S 3 分别为探针对1与2,2与3,3与4之间的距离,探头系数由制造厂对探针间距进行测定后确定,并提供给用户。
每个探头都有自已的系数。
C ≈±,单位为cm 。
(a )块状或棒状样品体电阻率测量:由於块状或棒状样品外形尺寸远大於探针间距,符合半无穷大的边界条件,电阻率值可直接由(3-1)式求出。
(b )薄片电阻率测量:薄片样品因为其厚度与探针间距相近,不符合半远穷大边界条件,测量时要附加样品的厚度,形状和测量位置的修正系数。
其电阻率值可由下面公式得出 ρ=C IV G (S W )D (S d )=ρ0 G (SW )D (S d) (3-3) 式中ρ0—— 为块状体电阻率测量值 G (SW)———为样品厚度修正系数,可由附录1A 或附录1B 查得。
W :样品厚度(μm );S 探针间距(mm )D :(Sd)——为样品形状与测量位置的修正函数可由附录2查得。
当园形硅片的厚度满足 SW<条件时,电阻率为 ρ=ρ0 D Ln S W221 )(Sd(3-4) 式中Ln2为2的自然对数。
当忽略探针几何修正系数时,即认为C=2πS时, )(53.4)(2SdD I VW S d D ILn VW==πρ (3-5) (©)扩散层的方块电阻测量当半导体薄层尺寸满足于半无穷大平面条件时:IVI V Ln R 53.4)(20==π(3-6)SZT-2B 型四探针测试仪电气部分原理框图: (图二)仪器主体部分由单片计算机, 液晶显示器、键盘、高灵敏度,高输入阻抗的方大器、双积分式A/D 变换器、恒流源、,开关电源,DC-DC 变换隔离电源。
电动,手动或手持式四探针测试架(头)等组成。
三.使用方法本仪器适配三种测试架(电动,手动,手持测试头),还可使用带有四个夹子的,四线法电阻测试输入插头,这四种输入插头虽然外形相同,使用同一个输入插座,但使用方法略有不同,以下将分别于以说明。
1, 主机;A :面板:面板左侧为液晶显示器,显示器的第一行显示测量结果,阻单位(KΩ,Ω,mΩ)和测量方式的符号(“-cm”电阻率,“ -口”方块电阻,“—”电阻)- 在正常测量时第二行将以较小的字号显示和第一行相同的数值,只有在超程时第一行显示四个横杠(- - - -),第二行则显示一个正在使用的测量方式可以显示的最大数值,例如电阻率测量可以显示的最大值为1256,方块电阻可以显示的最大值为9060,而电阻测量则可以显示的最大显示值为1999,(以上所示的值中小数点和单位均视测量当时所设量程而定,这里不作详述)。
指示灯下面为二行二列功能设置键,上面一行左边那个为左移键,右边那个为右移键,恒流源在开机时优先设定为1mA,应该是左起第三个指示灯被点亮,恒流源输出电流为1mA第二列为电压量程设置键和测量方式设置键,每组都只有一个键,采用单键循环操作方式。
最下面一个键为往复键,重复按键可以选择测量或保持二个状态,(必须注意!当使用电动测试架时,只能设定在测量状态)。
2,电动测试架;电动测试架是一个完整的组件,由步进电机和驱动电路,活动架,四探针测头等组成,用九芯电缆和主机连接。
3,手动测试架手持测试头,四端子电阻测试夹使用比较简单,只要将七芯输入插头插入输入端,仪器就会连续测量,将探针和工件保持良好接触,就可在显示器上读出测量结果。
C,操作步骤;仪器在第一次使用前必须首先检查所使用的电源是否符合规定要求,各种线缆是否连接妥当。
接通电源并开机后,必须预热30分钟,并注意观察仪器的温度指值,是否符合要求,主机在接通电源后,测试架的探头就会复位,上升到规定位置。
同时主机运行自检程序,液晶显示器显示公司名称,网址,联系电话,指示灯循环点亮一次,最后电流指灯停在1mA位置上,电压量程指示灯停在2V位置,测量模式指示灯停在电阻率测量模式,测量/保持键则选在测量位置,液晶显示器显示单位为KΩ-cm,(电阻率测量)在液晶显示器的下面显示的二行数字上面一行是现场温度,下面一行是修整系数,是探头的修正系数。
这是仪器在开机后的优先先选择。
此时液晶显示器的第一行还没有显示任何数值,因为现在测量还没有开始,接下来可以将被测半导体材料放在测试架的园形绝缘板的园心上,把探针保护套取下并保存好,按一下测试架上的启动按键(小红键),随即测试头下降探针和被测工件接触稍后显示测量结果,测试头上升。
如果测量结果显示“- - - -”则为超量程,可以减小恒流源的设置值,如果电压量程置于最高,恒流电流置于最小,仍显示超量程则可能是被测工件电阻太大,已超出了本仪器的测量范围,当测量的结果为0则可以增大恒流电流或减小电压量程,调整电流或电压量程,直至测量结果可以显示三位以上的读数为最好的量程组合。
在选择量程时必须注意的是,如已知被测工件是半导体材料并且阻值大于10Ω时,建议不要使用10mA以上的恒流源,原因是10mA以上的恒流源使用较低的工作电压,而半导体材料表面接触电阻又较大,会使恒流源工作不正常。
附录:测量时,预估的样品阻值范围应该选择相对应的电流范围,关系如下表:附录1A 样品厚度修正系数G (WS)样品厚度较薄:WS=~1 见表5W :样品厚度(μm ):S :探针间距(mm ) W/S W 01234567890 10 20 30 40 50 60 70 80 90 100 110 120 130 140 150 160 170 180 190 200.000 .007 .014 .022 .029 .036 .043 .051 .058 .065 .072 .079 .087 .094 .101 .108 .115 .123 .130 .137 .144 .001 .008 .015 .022 .030 .037 .044 .051 .058 .066 .073 .080 .087 .095 .102 .109 .116 .123 .131 .138 .145 .001 .009 .016 .023 .030 .038 .045 .052 .059 .066 .074 .081 .088 .095 .102 .110 .117 .124 .131 .139 .145 .002 .009 .017 .024 .031 .038 .045 .053 .060 .067 .074 .082 .089 .096 .103 .110 .118 .125 .132 .139 .146 .003 .010 .017 .025 .032 .039 .046 .053 .061 .068 .075 .082 .089 .097 .104 .111 .118 .126 .133 .140 .147 .004 .011 .018 .025 .032 .040 .047 .054 .061 .069 .076 .083 .090 .097 .105 .112 .119 .126 .133 .141 .148 .004 .012 .019 .026 .033 .040 .048 .055 .062 .069 .077 .084 .091 .098 .105 .113 .120 .127 .134 .141 .149 .005 .012 .019 .027 .034 .041 .048 .056 .063 .070 .077 .084 .092 .099 .106 .113 .120 .128 .135 .142 .149 .006 .013 .020 .027 .035 .042 .049 .056 .063 .071 .078 .085 .092 .100 .107 .114 .121 .128 .136 .143 .150 .006 .014 .021 .028 .035 .043 .050 .057 .064 .071 .079 .086 .093 .100 .107 .115 .122 .129 .136 .144 .151210 220 230.151.159.166.152.159.167.153.160.167.154.161.168.154.162.169.155.162.170.156.163.170.157.164.171.157.164.172.158.165.172W/S W0123456789240 250 260 270 280 290 300 310 320 330 340 350 360 370 380 390 400 410 420 430 440 450 460 470 480.173.180.188.1953202.209.216.224.231.238.245.252.260.267.274.281.288.296.303.310.317.324.331.338.346.174.181.188.195.203.210.217.224.232.239.246.253.260.268.275.282.289.296.303.311.318.325.332.339.346.175.182.189.19.203.211.218.225.232.239.247.254.261.268.275.283.290.297.304.311.319.326.333.340.347.175.183.190.197.204.211.219.226.233.240.247.255.262.269.276.283.291.298.305.312.319.326.333.341.348.176.183.190.198.205.212.219.227.234.241.248.255.263.270.277.284.291.298.306.313.320.327.334.341.348.177.184.191.199.205.213.220.227.234.242.249.256.263.270.278.285.292.299.306.314.321.328.335.342.349.177.185.192.199.206.214.221.228.235.242.250.257.264.271.278.286.293.300.307.314.321.329.336.343.350.178.185.193.200.207.214.221.229.236.243.250.257.265.272.279.286.293.301.308.315.323.329.336.343.351.197.186.193.201.208.215.222.229.237.244.251.258.265.273.280.287.294.301.308.316.323.330.337.344.351.180.187.194.201.208.216.223.230.237.245.252.259.266.273.281.289.295.302.309.316.324.331.338.345.352490 500.353.360.353.360.354.361.355.362.355.363.356.363.357.364.358.365.358.365.359W/S W0123456789056510520530540550560570580590600610620630640650660670680690700710720730740750.367.374.381.388.395.402.409.416.422.429.436.443.450.456.463.470.476.483.489.496.502.508.515.521.527.368.375.382.389.396.402.409.416.423.430.437.444.450.457.464.470.477.483.490.496.503.509.516.522.528.368.375.382.389.396.403.410.417.424.431.437.444.451.458.464.471.477.484.491.497.503.510.516.522.529.369.376.383.390.397.404.411.418.425.431.438.445.452.458.465.472.478.485.491.498.504.510.517.523.529.370.377.384.391.398.405.411.418.425.432.439.446.452.459.466.472.479.485.492.498.505.511.517.524.530.370.377.384.391.398.405.412.419.426.433.439.446.453.460.466.473.479.486.492.499.505.512.518524.530.371.378.385.392.399.406.413.420.427.433.440.447.454.460.467.474.480.487.493.500.506.512.519.525.531372.379.386.393.400.407.414.420.427.434.441448454461.468.474.481.488.494.500.507.513.519.525.532372.379.386.393.400.407.414.421.428.435.442.448.455.462.468.475.481.488.494.501.507.514.520.526.532.373.380.387.394.401.408.415.422.429.435.442.449.456.462.469.476.482.489.495.501.508.514.520.527.533760 770.533.540.534.540.535.541.535.541.536.542.537.543.537.543.538.544.538.544.539.545W/S W0123456789780 790 800 810 820 830 840 850 860 870 880 890 900 910 920 930 940 950 960 970 980 990 1000.546.552.558.564.569.575.581.587.592.598.603.609.614.619.625.630.635.640.645.650.655.660.665.546.552.558.564.570.576.581.587.593.598.604.609.615.620.625.630.636..641.646.651.656.660.547.553.559.565.571.576.582.588.593.599.604.610.615.621.626631.636.641.646.651.656.661.547.553.559.565.571.577.583.588.594.599.605.610.616.621.626.631.637.642.647.652.657.661.548.554.560.565.572.577.583.589.594.600.605.611.616.622.627.632.637.642.647.652.657.662..549.555.561.567.573.579.584590.596.601.607.612.617.623.628.633.638.643.648.653.658.663.549.555.561.567.573.579.584.590.596.601.607.612.617.623.628.633.638.643.648.653.658.663.550.556.562.568.573.579.585.591.596.602.607.613.618.623.628.634.639.644.649.654.658.663.550.556.562.568.574.580.585.591.597.602.608.613.618.624.629.634.639.644.649.654.658.664.551.557.563.569.575.580.586.592.597.603.608.614.619.624.629.635.640.645.650.655.659.664附录1B 样品厚度修正系数G (WS)样品厚度较厚:WS=~ 见表W :样品厚度(μm ):S :探针间距(mm ) W/SW/S如需所测值更精确,请查下表附录2样品形状和测量位置的修正系数D(ds)(1)圆形薄片直径d (mm)探针位置距圆心位置距边缘位置0mm1/4 d 5 mm 4 mm 3 mm 2 mm20 23 25 27 30 32 35 38 40 42 45 50 55 57 60 63 65 70 758090100(2)矩形薄片正方形矩形d/s a/d=1a/d=2a/d=3a/d≥4100d:短边长度a:长边长度s:探针间距提醒:每次开机启动,仪器会有一个自动校正和自动预热过程,初测试偶有5到10次测试数值不精确视为正常情况。