利用matlab进行信号与系统分析实验

- 1、下载文档前请自行甄别文档内容的完整性,平台不提供额外的编辑、内容补充、找答案等附加服务。
- 2、"仅部分预览"的文档,不可在线预览部分如存在完整性等问题,可反馈申请退款(可完整预览的文档不适用该条件!)。
- 3、如文档侵犯您的权益,请联系客服反馈,我们会尽快为您处理(人工客服工作时间:9:00-18:30)。
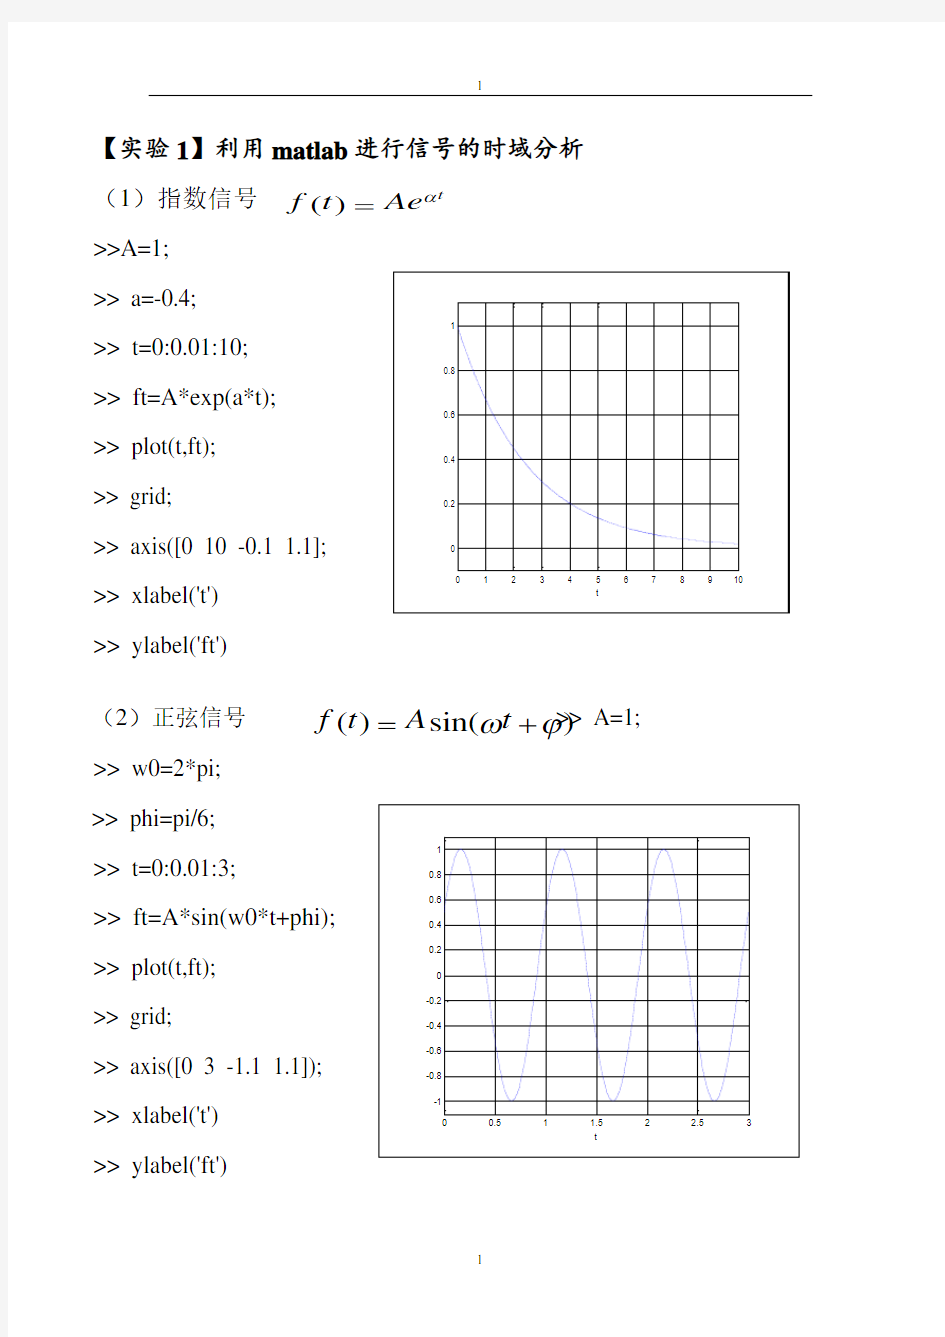
【实验1】利用matlab 进行信号的时域分析 (1)指数信号 >>A=1; >> a=-0.4;
>> t=0:0.01:10;
>> ft=A*exp(a*t); >> plot(t,ft); >> grid;
>> axis([0 10 -0.1 1.1]; >> xlabel('t') >> ylabel('ft')
(2)正弦信号 >> A=1; >> w0=2*pi; >> phi=pi/6; >> t=0:0.01:3; >> ft=A*sin(w0*t+phi); >> plot(t,ft); >> grid;
>> axis([0 3 -1.1 1.1]); >> xlabel('t') >> ylabel('ft')
()t f t Ae α=()sin()
f t A t ωϕ=+
>>x=linspace(-20,20); >> y=sinc(x/pi); >> plot(x,y);>> grid; >> axis([-21 21 -0.5 1.1]); >> xlabel('x') >> ylabel('y')
(4)矩形脉冲信号 >> t=0:0.001:4; >> T=1;
>> ft=rectpuls(t-2*T,2*T); >> plot(t,ft); >> grid;
>> axis([-1 5 -0.1 1.1]); >> xlabel('t') >>ylabel('ft')
t t t Sa t f )
sin()()(=
=)]
()([)()
(10τετετ+-+==t t A t G t f
function ft=heaviside(t) ft=(t>0); >> t=-1:0.001:3; >> ft=heaviside(t); >> plot(t,ft); >> grid;
>> axis([-1 3 -0.1 1.1]); >> xlabel('t') >>ylabel('ft')
(6)复指数信号的时域波形 >> t=0:0.1:60;
>> f=exp(-0.1*t).*sin(2/3*t); >> plot(t,f); >> grid;
>> axis([0 60 -1 1]); >> xlabel('Time(sec)') >>ylabel('f(t)')
⎩⎨
⎧<>=)0(0)
0(1)(t t t ε)
3
2sin()(1.0t e t f t -=
(7)加入随机噪声的正弦波>> t=0:0.001:50;
>> y=sin(2*pi*50*t);
>> s=y+randn(size(t)); >> subplot(2,1,1);
>> plot(t(1:100),y(1:100)); >> grid;
>> subplot(2,1,2);
>> plot(t(1:100),s(1:100)); >>grid;
(8)周期矩形波
>> A=1;
>> t=0:0.0001:5;
>> y=A*square(2*pi*t,20); >> plot(t,y);
>> grid;
>> axis([0 5 -1.5 1.5]);
(9)信号的基本运算
>> syms t;
>>f=sym('(t/2+1)*(heaviside(t+2)-heaviside(t-2))');
>>subplot(3,2,1),ezplot(f,[-3,3]);
>>grid;
>> y1=subs(f,t,t+2);
>> subplot(3,2,2),ezplot(y1,[-5,1]);
>> title('f(t+2)');
>> grid;
>> y2=subs(f,t,t-2);
>> subplot(3,2,3),ezplot(y2,[-1,5]);
>> title('f(t-2)');
>> grid;
>> y3=subs(f,t,-t);
>> subplot(3,2,4),ezplot(y3,[-3,3]);
>> title('f(-t)');
>> grid;
>> y4=subs(f,t,2*t);
>> subplot(3,2,5),ezplot(y4,[-2,2]);
>> title('f(2t)');
>> grid;
例1求系统y ”(t )+2y ’(t )+100y (t )=10f (t )的零状态响应,已知f (t )=(sin2πt ) ε(t )。
>> t=0:0.01:5;
>> sys=tf([10],[1 2 100]); >> f=10*sin(2*pi*t); >> y=lsim(sys,f,t); >> plot(t,y); >> grid;
>> xlabel('Time(sec)') >> ylabel('y(t)')
例2 求系统y ”(t )+2y ’(t )+100y (t )=10f (t )的零状态响应,已知f (t )=δ(t )。
>> t=0:0.01:5;
>> sys=tf([10],[1 2 100]); >> y=impulse(sys,t); >> plot(t,y); >> xlabel('Time(sec)') >> ylabel('h(t)') >> grid;
[例1]实用matlab 画出图示周期三角波信号的频谱
>> N=8; >> n1=-N:-1;
>> c1=-4*j*sin(n1*pi/2)/pi^2./n1.^2; >> c0=0; >> n2=1:N;
>>c2=-4*j*sin(n2*pi/2)/pi^2./n2.^2; >> cn=[c1 c0 c2]; >> n=-N:N; >> subplot(2,1,1); >> stem(n,abs(cn)); >> ylabel('Cn 的幅度'); >> subplot(2,1,2); >> stem(n,angle(cn)); >> ylabel('Cn 的相位'); >>xlabel('\omega/\omega0');
t
⎪
⎩⎪⎨⎧=≠-=000 )2
sin(422n n n n j
C n ππ
