07动态信号分析仪
网络分析仪基本操作介绍
网络分析仪基本操作介绍一、概述随着信息技术的飞速发展,网络已成为现代生活和工作中不可或缺的一部分。
为了更好地分析和优化网络性能,网络分析仪作为一种重要的测试工具被广泛应用。
网络分析仪基本操作介绍对于使用者来说至关重要,本文将详细介绍网络分析仪的基本操作,帮助读者更好地理解和使用这一强大的工具。
网络分析仪主要用于测量网络中的各项参数,如信号的频率响应、失真度、噪声系数等,以评估网络性能。
通过掌握网络分析仪的基本操作,使用者可以准确地分析网络中的各种问题,并找到相应的解决方案。
本文旨在让读者了解网络分析仪的基本功能、操作方法和使用注意事项,以便在实际应用中能够准确、高效地使用网络分析仪。
1. 介绍网络分析仪的重要性和应用领域随着互联网技术的飞速发展和信息通信技术的日益成熟,网络已经成为了我们日常生活与工作中不可或缺的重要部分。
为了确保网络的稳定、高效和安全运行,网络分析仪成为了必不可少的重要工具。
因此本文将为大家介绍网络分析仪的基本操作,本文将重点阐述的第一部分,是关于网络分析仪的重要性和应用领域。
在当今信息化社会,网络已经渗透到各行各业和千家万户的日常生活中。
无论是企业级的复杂网络系统,还是家庭用户的日常网络连接,网络的性能优化和故障排查成为了保证业务连续性和生活质量的关键环节。
网络分析仪在这一点上发挥着至关重要的作用,它可以对网络信号进行捕捉、分析和可视化处理,帮助工程师和IT专家迅速定位网络问题,提供准确的数据分析和解决方案。
因此网络分析仪是维护网络正常运行、提升网络性能的关键工具。
网络分析仪的应用领域非常广泛,几乎涵盖了所有涉及网络通信的领域。
以下列举几个主要应用领域:通信行业:在网络规划、部署和维护阶段,网络分析仪用于测试和优化无线和有线通信网络。
通过对信号质量的精确分析,确保通信的稳定和高效。
网络安全领域:网络分析仪通过深度分析网络流量和行为模式,有助于发现潜在的安全威胁,帮助防御各种网络安全攻击。
DynamicSignalAnalyzer:动态信号分析仪
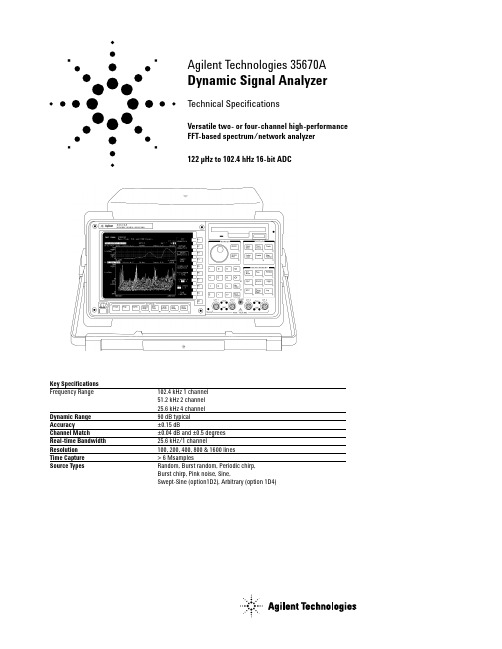
Agilent Technologies 35670A Dynamic Signal Analyzer Technical SpecificationsVersatile two- or four-channel high-performance FFT-based spectrum/network analyzer122 µHz to 102.4 hHz 16-bit ADCSignal Averaging (FFT Mode)Average Types (1 to 9,999,999 averages)RMS TimeExponentialRMS Exponential Peak HoldTimeAveraging ControlsOverload RejectFast Averaging On/OffUpdate Rate SelectSelect Overlap Process PercentagePreview Time RecordMeasurement ControlStart MeasurementPause/Continue MeasurementTriggeringContinuous (Freerun)External (Analog or TTL Level)Internal Trigger from any ChannelSource Synchronized TriggerGPIB TriggerArmed TriggersAutomatic/ManualRPM StepTime StepPre- and Post-Trigger Measurement DelayTachometer Input:±4V or ±20V range40 mv or 200 mV resolutionUp to 2048 pulses/revTach hold-off controlSource OutputsRand om BurstRand omPeriodic Chirp Burst ChirpPink Noise Fixed SineNote: Some source types are not available foruse in optional modes. See option description fordetails.Input ChannelsManual Range Anti-alias Filters On/OffUp-Only Auto Range AC or DC CouplingUp/Down Auto Range LED Half Range andOverload IndicatorsFloating or Grounded A-Weight Filters On/OffT ransducer power supplies (4 ma constant current)Frequency20 Spans from 195 mHz to 102.4 kHz (1 channel mode)20 Spans from 98 mHz to 51.2 kHz (2 channel mode)Digital zoom with 244 µHz resolution throughoutthe 102.4 kHz frequency bands.Resolution100, 200, 400, 800 and 1600 linesWindowsHann UniformFlat Top Force/ExponentialMath+,-,*, / ConjugateMagnitude Real and ImaginarySquare Root FFT, FFT-1LN EXP*jωor /jω PSDDifferentiation A, B, and C weightingIntegration Constants K1 thru K5Functions F1 thru F5AnalysisLimit Test with Pass/FailData Table with Tabular ReadoutData EditingTime Capture FunctionsCapture transient events for repeated analysis in FFT, octave, order, histogram, or correlation modes (except swept-sine). Time-captured data may be saved to internal or external disk, or transferred over GPIB. Zoom on captured data for detailed narrowband analysis. Up to6 Msamples of data can be saved inthe standard unit.Data Storage FunctionsBuilt-in 3.5 in., 1.44-Mbyte flexible disk also supports 720-KByte disks, and 2 Mbyte NVRAM disk. Both MS-DOS® and HP-LIF formats are available. Data can be formatted as either ASCII or Binary (SDF). The 35670A provides storage and recall from the internal disk, internal RAM disk, internal NVRAM disk, or external GPIB disk for any of the following information: Instrument Setup States Trace DataUser-Math LimitDataTime Capture Buffers Agilent Instrument BASIC Waterfall Display Data ProgramsData Tables Curve Fit/Synthesis TablesInterfacesGPIB (IEEE-488.1 and 488.2)ParallelRS-232C SerialHard-Copy OutputTo Serial or Parallel HP-GL Plotters (PCL5e)To Raster PrintersTo Serial or Parallel HP-GL PrintersTo Disk File (Supports Raster Printer,HP-GL Plotter, and HP-GL Printer)Time StampGPIB CapabilitiesListener/Talker (Direct control of plotters, printers, disk drives)Conforms to IEEE 488.1/488.2Conforms to SCPI 1992Controller with Agilent Instrument Basic option Standard Data Format (SDF) Utilities Exchange data between virtually all Agilent Dynamic Signal AnalyzersEasy data transfer to spreadsheetsData transfer to MATRIX X and MatlabSDF utilities run in an external PCCalibration & MemorySingle or Automatic CalibrationBuilt-In Diagnostics & Service Tests Nonvolatile Clock with Time/DateTime/Date Stamp on Plots and Saved Data Files Online HelpAccess to Topics via Keyboard or IndexFanOn/OffMS-DOS®is a U.S. registered trademark ofMicrosoft Corporation.Summary of Featureson Standard InstrumentThe following features are standardwith the Agilent 35670A:Instrument ModesFFT Analysis Histogram/Time Correlation Analysis Time Capture MeasurementFrequency DomainFrequency Response Power SpectrumLinear Spectrum CoherenceCross Spectrum Power SpectralDensityTime Domain (oscilloscope mode)Time Waveform AutocorrelationCross-Correlation OrbitDiagram Amplitude DomainHistogram, PDF, CDFTrace CoordinatesLinear Magnitude Unwrapped PhaseLog Magnitude Real PartdB Magnitude Imaginary PartGroup Delay Nyquist DiagramPhase PolarTrace UnitsY-axis Amplitude: combinations of units, unit value, calculated value, and unit format describey-axis amplitudeUnits: volts, g, meters/sec2, inches/sec2,meters/sec, inches/sec, meters, mils, inches, pascals, Kg, N, dyn, lb, user-defined EUsUnit Value: rms, peak, peak-to-peakCalculated Value: V, V2, V2/Hz, √Hz, V2s/Hz (ESD)Unit Format: linear, dB’s with user selectable dB reference, dBm with user selectable impedance.Y-Axis Phase:degrees, radiansX-Axis:Hz, cpm, order, seconds, user-definedDisplay FormatsSingleQuadDual Upper/Lower TracesSmall Upper and Large LowerFront/Back Overlay TracesMeasurement StateBode DiagramWaterfall Display with Skew, -45 to 45 DegreesTrace Grids On/OffDisplay BlankingScreen SaverDisplay ScalingAutoscale SelectableReference Manual Scale Linear or Log X-Axis Input Range Tracking Y-Axis LogX & Y Scale Markers with Expand and Scroll Marker FunctionsIndividual Trace MarkersCoupled Multi-Trace MarkersAbsolute or Relative MarkerPeak SearchHarmonic MarkersBand MarkerSideband Power MarkersWaterfall MarkersTime Parameter MarkersFrequency Response Markers23Agilent 35670A Specifications* Option AY6 single channel maximum range extends to 102.4 kHz without anti-alias filter protection.** Show All Lines mode allows display of up to 131.1,65.5 and 32.7 kHz respectively. Amplitudes accuracy is unspecified and not alias protected.<-80 dBfs<-80 dBfs0 dBfs, ≤1 MHz 200 kHz with IEPE transducer power supply On)800 Hz Span-51 -41 -31 -21 -11 270.0028 0.0089 0.028 0.089 0.28022.4Amplitude Range (dBVrms / Vrms)51.2 kHz Span 6.4 kHz Span 456Computed Order Tracking - Option 1D0()Maximum Order x Maximum RPM≤60Online (Real Time) 1 Channel Mode 25,600 Hz2 Channel Mode 12,800 Hz4 Channel Mode 6,400 HzCapture Playback 1 Channel Mode 102,400 Hz2 Channel Mode 51,200 Hz4 Channel Mode 25,600 HzNumber of Orders ≤200 5 ≤RPM ≤491,519(Maximum useable RPM is limited byResolution, Tach Pulse Rate,Pulses/Revolutionand Average Mode Settings.)Delta Order1/128 to 1/1Resolution ≤400(Maximum Order) / (Delta Order)Maximum RPM Ramp Rate1000 RPM / second real-time (typical)1000 - 10,000 RPM Run UpMaximum Order 10Delta Order 0.1RPM Step 30 (1 Channel)60 (2 Channel)120 (4 Channel)Order T rack Amplitude Accuracy±1 dB (typical)Real Time Octave Analysis - Option 1D1Standards Conforms to ANSI Standard S1.11 - 1986,Order 3, Type 1-D, Extended and OptionalFrequency RangesConforms to IEC 651-1979 Type 0 Impulse ,and ANSI S1.4Frequency Ranges(at centers)Online (Real Time):Single Channel 2 Channel 4 Channel1/1 Octave 0.063 - 16 kHz 0.063 - 8 kHz 0.063 - 4 kHz1/3 Octave 0.08 - 40 kHz 0.08 - 20 kHz 0.08 - 10 kHz1/12 Octave 0.0997 - 12.338 kHz0.0997 - 6.169 kHz 0.0997 - 3.084 kHzCapture Playback:1/1 Octave 0.063 - 16 kHz 0.063 - 16 kHz 0.063 - 16 kHz1/3 Octave 0.08 - 31.5 kHz 0.08 - 31.5 kHz 0.08 - 31.5 kHz1/12 Octave 0.0997 - 49.35 kHz 0.0997 - 49.35 kHz 0.0997 - 49.35 kHzOne to 12 octaves can be measured and displayed.1/1-, 1/3-, and 1/12-octave true center frequencies related by the formula: f(i+1)/f(i) = 2^(1/n); n=1,3, or 12; Where 1000 Hz is the reference for 1/1, 1/3 Octave, and 1000*2^(1/24) Hz is the referencefor 1/12 octave. The marker returns the ANSI standard preferred frequencies.Accuracy1 Second Stable AverageSingle Tone at Band Center: ≤±0.20 dBReadings are taken from the Linear Total Power Spectrum Bin.It is derived from sum of each filter.1/3-Octave Dynamic Range > 80 dB (typical) per ANSI S1.11-19862 Second Stable AverageTotal power limited by input noise level7General SpecificationsSafety Standards CSA Certified for Electronic Test andMeasurement Equipment per CSAC22.2, NO. 231This product is designed for compliance to:UL1244, Fourth EditionIEC 348, 2nd Edition, 1978EMI / RFI Standards CISPR 11Acoustic Power LpA < 55 dB (Cooling Fan at High Speed Setting)< 45 dB (Auto Speed Setting at 25 °C)Fan Speed Settings of High, Automatic, and Off are available. The Fan Off setting can be enabledfor a short period of time, except at higher ambient temperatures where the fan will stay on. Environmental Operating RestrictionsOperating: Operating: Storage&Disk In Drive No Disk In Drive TransportAmbient Temp. 4 °C to 45 °C 0 °C to 55 °C -40 °C to 70 °C Relative Humidity(non-condensing)Minimum 20% 15% 5%Maximum 80% at 32 °C 95% at 40 °C 95% at 50 °C Vibrations 0.6 Grms 1.5 Grms 3.41 Grms(5 - 500 Hz)Shock 5G(10 mSec 1/2 sine) 5G (10 mSec 1/2 sine) 40G (3 mSec 1/2 sine) Max. Altitude 4600 meters 4600 meters 4600 meters(15,000 ft.) (15,000 ft.) (15,000 ft.)AC Power90 Vrms - 264 Vrms(47 - 440 Hz)350 VA maximumDC Power12 VDC to 28 VDC Nominal200 VA maximumDC Current at 12V standard: <10A typical4 channel: <12A typicalWarm-Up Time 15 minutesWeight 15 kg (33 lb) net29 kg (64 lb) shippingDimensions(Excluding Bail Handle and Impact Cover) Height 190 mm (7.5")Width 340 mm (13.4")Depth 465 mm (18.3")AbbreviationsdBVrms = dB relative to 1 Volt rms.dBfs = dB relative to full scale amplituderange. Full scale is approx. 2 dB below ADCoverload.Typical = typical, non-warranted, performancespecification included to provide generalproduct information.By internet, phone, or fax, get assistance with all your test & measurement needsOnline assistance:/find/assistPhone or FaxUnited States:(tel) 800 452 4844Canada:(tel) 877 894 4414(fax) 905 282 6495China:(tel) 800 810 0189(fax) 800 820 2816Europe:(tel) (31 20) 547 2323(fax) (31 20) 547 2390Japan:(tel) (81) 426 56 7832(fax) (81) 426 56 7840Korea:(tel) (82 2) 2004 5004(fax) (82 2) 2004 5115Latin America:(tel) (305) 269 7500(fax) (305) 269 7599Taiwan:(tel) 0800 047 866(fax) 0800 286 331Other Asia Pacific Countries:(tel) (65) 6375 8100(fax) (65) 6836 0252Email:*******************Product specifications and descriptions in this document subject to change without notice.© Agilent Technologies, Inc. 2003Printed in USA March 21, 20035966-3064E/find/emailupdatesGet the latest information on theproducts and applications you select.Agilent T&M Software and ConnectivityAgilent's Test and Measurement softwareand connectivity products, solutions anddeveloper network allows you to take timeout of connecting your instruments to yourcomputer with tools based on PCstandards, so you can focus on your tasks,not on your connections. Visit/find/connectivityfor more information.Test Equipment Connection Corporation is your single source test & measurement solution. We offer over 400 test equipment manufacturers including Agilent, Tektronix, Anritsu, Rohde & Schwarz, Advantest, Megger, LeCroy, Chroma and Fluke, plus thousands of New, Used, Second Hand, Pre-Owned, Demo, Refurbished, and Reconditioned test equipment products.For over 18 years, we have been providing high quality spectrum analyzers, mobile phone testers, oscilloscopes, network analyzers, service monitors, RF amplifiers, broadband amplifiers, signal generators, OTDR, fusion splicers, and digital multimeters at great savings to over 200,000 customers worldwide. Lease or rent from us, and we can help manage your idle assets using our consignment program. Trade in underutilized test equipment for cash or credit towards the test solutions you need today! TEC offers repair and calibration support for thousands of current and discontinued brands. TEC's GSA Contract #GS-07F-0358U provides lower cost test and measurement equipment to qualifying government contractors and agencies.Click Here to Request an Offer on Your Surplus Test and Measurement Assets Today。
HG-SOFTGPS07八通道多频GNSS中频信号采集器产品说明书

HG-SOFTGPS07八通道多频GNSS中频信号采集器V1.0MAX2771 x8架构,一步到位的采集器解决方案提供HG-RTSDR-L1/B1实时软件接收机可执行文件外部A/D:支持每个射频2bit或者3bit采样高速采集:总带宽可达261MB/s温补晶振支持:16.369MHz外部时钟输入:支持北京星源北斗导航技术有限责任公司2019 年 3 月 5 日表A 文档信息表更多详细信息请致电星源北斗咨询!公司地址:北京市海淀区温泉镇显龙山路19号北辰香麓雅庭A座218室电话及传真:************QQ:5024141邮箱:***************1 产品概述表1 产品价格表HG-SOFTGPS07是北京星源北斗导航技术有限责任公司基于最新的美信MAX2771射频芯片设计的采集器,通道数首次达到了8通道,基于USB3.0和DDR3技术做数据传输。
图1 HG-SOFTGPS07采集器图2 HG-SOFTGPS07采集器前面板图3 HG-SOFTGPS07采集器后面板MAX2771是下一代卫星导航信号接收芯片,覆盖E5/L5, L2, E6, E1/L1以及GPS, GLONASS, Galileo, QZSS, IRNSS和中国北斗三代系统。
MAX2771经过本公司4个月的验证测试,目前已经证实其在B3I,B2a频点上可用,相较于其他射频芯片信号质量优异,接口简单,功耗极低,是适合广泛使用的GNSS射频芯片产品。
HG-SOFTGPS07基于成熟的DDR3和USB3.0技术传输,在262MB/s数据率下仍然能保证稳定可靠的工作。
本公司已经使用HG-SOFTGPS07成功跟踪上B3I信号:图4 HG-SOFTGPS07采集数据跟踪B3I信号效果(波形显示去除了NH码影响)HG-SOFTGPS07的各射频的采样时钟取决于RF1的设置,可以设置为输入时钟的1倍频,2倍频,4倍频,甚至可以分频。
TLMW07说明书

TLMW07 全方位监测器1 产品简介该TLMW07是根据微波多普勒效应原理(也就是雷达基本原理)制作成的,可广泛应用于类似自动门控制开关、安全防范系统、A TM自动提款机的自动录像控制系统、以及其他需要自动感应控制的场所。
这种探测方式与其它探测方式相比具有如下的优点:1、非接触探测;2、不受温度、湿度、噪声、气流、尘埃、光线等影响,适合恶劣环境;3、抗射频干扰能力强;4、输出功率仅有5mW,对人体构不成危害。
安装及接线简单。
这和市场上常见的简易型微波感应控制器相比较,因为采用专用的微处理集成器,不但检测灵敏度度高,探测范围宽,而且工作非常可靠,误报率极低,能在-25~+45度的温度范围内稳定工作。
TLMW07开关量信号可设置,探测灵敏度、距离可调,报警时间、距离可设置,探测方向可调,穿透性能好。
输出周期为2秒-180秒可设置。
2 应用领域1.A TM、自动柜员机、A TM监控2.家庭3.商店4.工厂5. 宾馆、6.机关、7.其他防盗等安防装置8.A TM自动提款机3 产品特征电源:DC 6V~12V,微波探头感应有效距离:0~ 7M,模块尺寸:48mm*30mm*12mm,天线采用软质材料制成。
控制器的外形右图所示,面板上设置有灵敏度调整孔,可以使监控距离在0~7米范围内可调,可以通过电路板的可调电阻来调节探测距离。
此微波感应控制器工作非常可靠,一般没有误报,是以往红外线、超声波、热释电元件组成的报警电路以及常规微波电路所无法比拟的,是目前用于安全防范和自动监控以及自动感应的最佳产品。
4典型应用下面介绍运用高可靠微波感应控制器制作的实用电子装置,它们的共同特点是线路新颖简单,实用性强,制作容易,性价比高。
一、自动感应灯灯可以自动识别周围环境光的亮度,能够实现人来灯亮,人走灯灭,不会误动作,可靠性高,而且电路的工作状态不会受自身灯光的干扰,可以广泛地运用在走廊、卫生间、庭院等场合实现自动照明。
二、使用于A TM机器及其他自动化控制设备当微波探测器感应到人体后,将在信号线输出一个高电平信号,A TM主控机检测到这个信号后,将打开摄像机并将录像指令传给硬盘录像机,如果是晚上,还可以同步打开红外补光灯做摄像机的辅助照明。
动态信号分析仪安全操作及保养规程

动态信号分析仪安全操作及保养规程动态信号分析仪是一种被广泛应用于各类工业生产领域的高科技仪器设备,它能够通过采集物体振动的动态信号并将其进行分析,从而帮助用户检测出物体内部的缺陷和故障,辅助用户制定有效的维修和保养方案。
为了更好地保证动态信号分析仪的正常使用和延长其使用寿命,以下将为您介绍它的安全操作和保养规程。
安全操作1. 操作员应具备一定的技术知识在进行动态信号分析仪的操作时,操作员应具备一定的技术知识,了解其原理和工作方式。
如果是初次操作,操作员应事先进行相关的培训和指导,跟随有经验的人员参与实操,熟悉仪器的使用方法和操作流程,确保技能水平和安全意识符合要求。
2. 正确连接电源和信号线在接入电源前,应检查电源和电压是否符合动态信号分析仪的电气参数要求,避免供电不足或过大,导致设备损坏。
接线时应注意线路接法是否正确,电源线和信号线要分别接在相应的接口上,以免设备受到电击或触电事故发生。
3. 使用过程中应注意安全防护措施操作过程中应佩戴防静电手套,并注意保护设备不受损伤,设备外壳应经常擦拭,避免受到外界污染。
保持操作现场清洁、整洁、安全,避免绊倒、滑倒等意外事故的发生。
在设备运转时,应保持身体稳定,防止摇摆和跌倒。
4. 关闭设备前,应注意操作步骤在关闭设备之前,应先关闭设备的软件,在断开电源之前,给设备一定的停机时间,保证设备内的部件安全、准确、稳定地停止运转,然后再关掉电源,避免短路和电流浪涌对设备的损害。
保养规程1. 定期清理设备动态信号分析仪的频率转换器、计算机等部件上会积累灰尘、油污和异物,影响设备正常工作,因此需要定期进行清洗。
清洁时应避免使用含有酸性、碱性、易挥发的化学药品,轻微的灰尘可以用柔软的毛刷或清洁布擦拭。
2. 注意电源接口的保养动态信号分析仪的电源口很容易受到污染,长时间不进行干净的保养和维护,会使电源接口损坏,该接口损坏后会影响设备使用,因此要定期进行检查和清洁。
3. 驱动器的保养动态信号分析仪中的驱动器是重要部件,如果不注意保养就会出现摩擦、磨损等情况。
信号分析仪2篇

信号分析仪2篇第一篇:信号分析仪使用介绍信号分析仪是一种用于测试、测量和分析各种电子、电信信号的仪器。
它可以应用于无线电通信、电视、电影、音频、雷达等领域,分析各种信号的频率、幅度、相位、脉宽、调制方式等多项参数,为工程师提供有效的测试和优化工具。
信号分析仪的使用可以帮助工程师定位和解决电信网络的故障,优化通信信号的传输质量,提高网络性能。
本文将详细介绍信号分析仪的使用方法,包括信号采集、信号分析和数据处理等多个方面。
一、信号采集信号分析仪通过连接到待测信号的输入端,将待测信号采集到计算机中进行分析。
信号采集需要注意以下几点:1.选择合适的输入端口,根据待测信号的类型和参数选择信号分析仪的输入端口。
2.设置合适的信号输入电平。
对于待测信号的输入电平应根据信号分析仪的相关参数和性能指标进行调整,以确保正确的信号采集。
3.选择合适的采样率。
采样率指的是每秒采集的样本数,如果采样率太低,就会丢失信号中的细节信息,影响信号分析的准确性。
二、信号分析信号分析是信号分析仪最重要的功能之一,通过信号分析可以得到信号的频谱、功率谱、脉冲特征等信号参数。
1.频谱分析。
频谱分析是信号分析仪最基本的功能,通过它可以得到信号的频率分布信息,帮助工程师判断信号的合法性和干扰情况。
频谱分析可以选择窄带和宽带两种测量方式。
2.功率谱分析。
功率谱分析是对频率分布信息进行细化,得到每一分频率下信号的功率大小。
3.脉冲测量。
脉冲测量包括脉宽、上升时间、下降时间、峰值等参数的测量,可以在雷达、卫星通信等领域中应用。
三、数据处理信号分析仪通过连接到计算机,将采集到的信号进行处理,得到最终的测试结果。
数据处理需要注意以下几点:1.数据处理软件的选择。
不同厂家的信号分析仪有不同的软件,工程师需要选择合适的软件进行数据处理。
2.数据预处理。
在进行数据处理前需要进行数据预处理,对数据进行滤波、去噪等操作,提高数据的可靠性和准确性。
3.数据分析。
动态信号分析仪的特点都有哪些呢

动态信号分析仪的特点都有哪些呢动态信号分析仪是用于测量和分析机械和电子设备中的振动、震动和噪音等动态信号的精密仪器。
它具有高精度、高速度、高灵敏度和高可靠性等特点。
本文将对动态信号分析仪的特点进行详细介绍。
1. 高精度动态信号分析仪采用了高精度、高速度的模数转换技术,可以对微弱的信号进行高精度的测量和分析。
它能够在高噪声环境下进行信号采集和分析,提高数据的可靠性和准确性。
同时,其具有高辨析度和高灵敏度,能够准确地检测和诊断机械设备中的故障和缺陷。
2. 高速度动态信号分析仪具备高速度的数据采集和处理能力,可以在短时间内采集和处理大量数据。
其采用了实时监测技术,能够对设备运行状态进行持续监测和分析,及时捕捉故障信号,快速反应和解决设备故障,有效提高设备的可靠性和安全性。
3. 多功能性动态信号分析仪具有多种功能,可以进行振动分析、频谱分析、时间频率分析、谐波分析、共振测试、幅值分析、相位分析等多项功能。
它能够满足不同范围的检测要求,适用于各种机械和电子设备中的振动、震动和噪音分析。
4. 易于操作动态信号分析仪采用了人性化的操作界面和简便的操作方式,可以快速上手操作。
同时,其具有自动化测试和诊断功能,能够自动识别和分析故障信号,提高工作效率和准确性。
此外,动态信号分析仪还支持远程监控和控制,使得远程工程师可以通过互联网等远程通信手段对设备进行监控和诊断。
5. 高可靠性动态信号分析仪采用了高品质的元器件和制造工艺,具有高可靠性和长寿命。
其外壳采用高强度、防水、防尘、防腐蚀的材料,能够在恶劣环境下工作。
同时,其具有自诊断和自校准功能,能够保证设备的稳定性和准确性。
6. 可拓展性动态信号分析仪具有良好的可拓展性,可以与其他测试设备、数字信号处理器等设备相连接,实现更为精细的检测和分析。
其支持多种接口和通讯协议,具有较高的兼容性和可扩展性。
综上所述,动态信号分析仪具有高精度、高速度、高灵敏度、高可靠性、多功能性、易于操作和可拓展性等多项特点,是工业领域中进行振动、震动和噪音分析的理想设备之一。
动态信号分析仪简介

Agilent Technologies 35670A Dynamic Signal AnalyzerProduct OverviewThe Agilent 35670A is a portable two- or four-channel dynamic signal analyzer with the versatility to be several instruments at once. Rugged and portable, it’s ideal for field work. Yet it has the performance and functionality required for demanding R&D applications. Optional features optimize the instrument for troubleshooting mechanical vibration and noise problems, characterizing control systems, or general spectrum and network analysis.Take the Agilent 35670Awhere it’s needed!Whether you’re moving an instrument around the world or around the lab, portability is a real benefit. Small enough to fit under an airplane seat, the 35670A goes where it’s needed. But there’s more to portability than size. Like a nominal 12- to 28-Volt DC power input and self-contained featuresthat do not require externalhardware, such as built-inpiezoelectric integrated circuitpower supply, analog trigger andtachometer inputs, and optionalcomputed order tracking.Versatile enough to beyour only instrument forlow frequency analysisWith the 35670A, you carry severalinstruments into the field in onepackage. Frequency, time, andamplitude domain analysis are allavailable in the standardinstrument. Build on that capabilitywith options that either add newmeasurement capability or enhanceall measurement modes.Versatile two- or four-channel high-performanceFFT-based spectrum/network analyzer122 µHz to 102.4 kHz 16-bit ADCKey SpecificationsFrequency Range:102.4 kHz 1 channel51.2 kHz 2 channel25.6 kHz 4 channelDynamic Range:90 dB typicalAccuracy:±0.15 dBChannel Match:±0.04 dB and ±0.5 degreesReal-time Bandwidth: 25.6 kHz/1 channelResolution:100, 200, 400 & 800 linesTime Capture:0.8 to >6 Msamples (option UFC)Source Types:Random, Burst random,Periodic chirp, Burst chirp, Pinknoise, Sine, Swept-Sine (option1D2),Arbitrary (option 1D4)The Agilent 35670Ashown with fourchannels (option AY6)AY6Add Two Channels (Four Total)1D0Computed Order Tracking1D1Real-Time OctaveMeasurementsUK4Microphone Adapter andPower Supply1D2Swept-Sine Measurements1D3Curve Fit and Synthesis1D4Arbitrary Waveform Source1C2Agilent Instrument BASIC1001D0 - 1D4 bundle2Agilent 35670ADynamic Signal AnalyzerShown with option AY6 - Add Two ChannelsInput Channels•Analog A-weighted fil-ters (switchable)•Transducer sensitivity input•Engineering units: g, m/s 2, m/s, m, in/s 2, in/s, in, mil, kg, dyn, lb,N, and pascals •Built-in 4 mAconstant current power supply(17 cm) display Display area is not compromised by portabilityPrecisionMeasurements •16-bit ADC•±0.15 dB spectrum amplitude accuracy •±0.04 dB, ±0.5degrees channel match (full scale)•90 dB dynamic range (typical)•130 dB dynamic range with swept-sine (option 1D2)•Up/Down autorange •Up only autorangeMath FunctionsPowerful math and data editing functions to quickly modify meas-urement results. (Curve fit and frequency responsesynthesis available with option 1D3.)Built-In 3.5 inch Flexible Disk Drive Store instrument states,programs, time captured data, waterfall data,trace data, limits, math functions, data tables,and curve fit/synthesis tables.Supported disk formats are HP-LIF andMS-DOS. Internal RAM may also beformatted as storage disk.Powerful Markers Extract information from measurement data with trace and special markers:•Individual Trace •Coupled Trace•Absolute or Relative •Peak Search •Harmonic •Band•Sideband Power •Waterfall•Time Parameter •Frequency and DampingVersatileMeasurement Modes Standard and optionalmeasurement modes include:•FFT Analysis•Real-Time Octave Analysis (option 1D1)•Order Analysis (option 1D0)•Swept-Sine (option 1D2)•Correlation Analysis •Histogram Analysis •Time CaptureAll measurement options may be retrofitted.RPM Display Read RPM in any measurement modeAgilent Instrument BASIC (Option 1C2)Develop a customuser-interface, integrate several instruments and peripherals into a system using the 35670A as the system controller, or simply automate measurements.Online Help Applications oriented help is just a few keystrokes away.Source Types •Random Noise •Burst Random Noise •Periodic Chirp •Burst Chirp •Pink Noise •Fixed Sine •Arbitrary Waveform Source (Option 1D4)•Swept-Sine Source (Option 1D2) Note: The source is located on the front panel of a standard two-channel 35670A.GPIB ConnectorIntegrate the35670A with otherinstruments andperipherals forsystem operationor printing/plotting.System controllerfor GPIB (IEEE-488.1and 488.2) compati-ble instrumentationvia AgilentInstrument BASIC(option 1C2).Provides direct con-trol of GPIB printers,plotters,and HP SS80 diskdrives.Serial PortPlot to HP-GLplotters or print toHP-GL and rasterprinters.Parallel PortPlot to HP-GL plottersor print to HP-GL andraster printers.DC PowerAccepts 12 to 28 voltsdc (nominal). Use the35250A power cable forDC power source con-nection, or the 35251Apower cable with ciga-rette-lighter adapter.Low Noise FanFan may be turnedoff for acousticapplications.Running speed dependsonambienttemperature.External MonitorDrive a VGA monitorfor remote viewing bylarge groups.Tachometer(42 Volt Peak Max)No external signalconditioning hardwarerequired. Readsfrequency (RPM) onselected levelsbetween ±20 Volts.External Trigger(42 Volt Peak Max)No external signalconditioning hardwarerequired. Triggers onselected levelbetween ±10 Volts.KeyboardUse a standard PCkeyboard to title data,edit Agilent InstrumentBASIC programs,or to operate theinstrument.Power SelectSwitch betweenAC and DC powersources withoutinterrupting instru-ment operation.AC PowerUniversal powersupply will operatewith anycombination ofvoltage between100 and 240 VACand line frequencybetween 47 and440 Hz. Themaximum powerrequirement is350 VA.34Laboratory-qualitymeasurements in the fieldObtain all of the performance of your bench-top analyzer in a portable instrument.Ease-of-usePortability, versatility, and perfor-mance are valued attributes, but to be really valuable an instrument must also be easy to use. The 35670A has a friendly front panel,plus online help that’s alwaysavailable to answer your questions.An interactive measurement state lets you configure the instrumentsetup from a single display.Two spectrums of road induced vibration measured at different speeds are comparedusing the front/back modeof the Agilent 35670A.FFT-based spectrum analyzers, such as the 35670A, are ideal for measuring the spectra of low-frequency signals like speech or mechanical vibration. Transient components,usually missed with swept-frequency analyzers, are easily measured and displayed at speeds fast enough to follow trends. The 35670A has both the performance and features required to take full advantage of this technology.16-Bits for High PerformanceWith a 16-bit ADC (90 dB typical dynamic range) and a real-time bandwidth of 25.6 kHz, you can be sure nothing will be missed. Resolve signals using 100 to 1600 lines resolution, or for really close-in analysis, use frequency zoom to resolve signals with up to 61 µHz resolution. Use time or RPM arming to develop waterfalls of sequential vibration spectra for trend analysis or for an overview of device vibration.Power and Linear SpectrumsMatch your spectrum measurement mode to the signal being tested. Use linear spectrum analysis to measure both the amplitude and phase of periodic signals such as the spectra of rotating machinery.Power spectrum analysis is provided for averaging nonrepetitive signals.AveragingVarious averaging modes let you further refine spectrum analysis measurements. Time averaging extracts repetitive signals out of the noise while rms averagingreduces the noise to its mean value.Exponential averaging, available for both time and rms averaging, is useful for reducing the noise while following changing signals—tracking the resonance shifts in a fatiguing structure for example.Spectrum Analysis5Time DomainUse your spectrum analyzer as alow-frequency oscilloscope or view signals in the time and frequency domains simultaneously. (Note: anti-alias filters can be switched off.) Special markers for time-domain data facilitate extraction of key control system performance parameters: overshoot, rise time,setting time, and delay time.Data TableUse a tabular format to keep track of key frequencies in the spectra of rotating machinery. The amplitude and frequency of the signal and a 16-character entry label field are listed for each selected point.Automatic Units ConversionDisplay vibration data in the units of your choice. Select g, m/sec 2, in/sec 2, m/s, in/s, m, mil, inch, Kg, lb, N, dyn,or pascals as appropriate for your application.The instrument automatically converts frequency-domain data from specified input transducer units to the units you select for display. For example, accelerometer data is automatically converted and displayed as mils when mils are selected. Of course, dB, dBV, dBm and volts are available for electrical applications.MarkersMarkers streamline analysis by helping you select and display specific data. Marker functions include marker to peak, next right peak, and coupled markers for selecting points in multiple data displays. Markers readouts are absolute or relative to your selected reference.Special MarkersThree special marker functions facilitate analysis of your spectral data. Sideband markers aid analysis of modulation signals. Use thisfunction to quickly locate sidebands in the complicated spectra of rotating machines. A band-power marker reads the total power in a selected band of frequencies and a total harmonic distortion marker lets you calculate total harmonic distortion without including the effects of noise.Measurement results at key frequencies can be labeled and listed using data table.Harmonic markers are used to calculate the THD of a signal without including the effects of noise.Simultaneousdisplay of frequency and time domain data facilitates analysis of gear mesh vibration.6The 35670A has the flexibility to make measurements of both electrical networks and mechanical devices. FFT-based network analysis is fast enough to allow real-time adjustments of circuit parameters while the swept-sine option provides exacting measurements over more than six frequency decades, and a 130 dB dynamic range.SourceSelect the optimum stimulus for each application—random noise,periodic chirp, pink noise, fixed sine, burst random, and burst chirp.For zoomed network analysismeasurements, the source is band-translated to match the zoom span at frequencies up to 51.2 kHz. An optional arbitrary source lets you test your product using real-world signals. A ±10 Volt DC source offset facilitates tests of control systems.Impact TestingForce and exponential windows allow impact testing for modal and structural analysis. Quality measurements are ensured using preview and accept/reject during averaging. A 4 mA constant current transducer power supply is built-in for true portability.Frequency ResponseMeasurementsLimits are used for go/no go testing in production. The response of an accelerometer is being checked inthis example.Characteristics of a selected resonance are automatically calculated from an impact measurement using the frequency and damping marker.LimitsTest network measurements against preset limits. Up to 800 separate line segments are available for setting upper and lower limits.Limits are also used for testing spectrum measurements.Four Channels (option AY6)Test up to three devicessimultaneously with a four-channel 35670A. Channel one is the common reference channel and two, three,and four are the response channels.Alternatively, select channels one and three as reference channels for two totally independent network measurements. See option AY6 description for more information.7MarkersA frequency and damping marker provides the resonant frequency and the damping ratio of single-degree-of-freedom frequency response measurements.Gain and phase margin markers extract key frequency-domain stability data from frequency response measurements of control systems.Signal Injection for Control LoopsUse one of three Agilent signal injection devices for testing control loops. The 35280A summing junction provides convenient DC to 1 MHz signal injection for most control loops. Use the 35281A clip-on transformer when it is not possible to temporarily open the loop, or use the 35282A signal injection transformer when secondary voltages are up to 600 Vpk.Capture transient events or time histories for complete analysis in any measurement mode (except swept-sine). Use either the entire time-capture record or a selected region of interest for repetitive analysis in the FFT, octave, order track, correlation or histogram instrument modes.Standard 16 Mbytes of memory for deep time-capture capability.Time CaptureAn interval of time-capture data has been selected for analysis in the octave mode.8Taking the measurement is only half the job. Raw measurement data must be stored, recalled, printed,plotted, integrated with other data for analysis, and reported. The 35670A has a variety of tools to help you finish the job.Enhanced Data Transfer Utilities for PCsStandard Data Format (SDF)Utilities, provided with the 35670A,allow you to easily move data from the instrument to wherever it’s needed:Using Measurement ResultsSelf-contained—no ratio synthesizer or tracking filter required Order Maps Order Tracking RPM or Time Trigger Display RPM ProfileTrack Up to Five Orders/Channel Up to 200 Orders Composite Power RPM MeasurementsOrder tracking facilitates evaluation of spectra from rotating machines by displaying vibration data as a function of orders (or harmonics)rather than frequency.All measurement spectra is normalized to the shaft RPM.Now you can have order tracking without compromising portability.Traditional analog order tracking techniques require external tracking filters and ratio synthesizers. With Agilent’s computed order tracking algorithm, external hardware is gone.Because order tracking isimplemented in the software, data is more precise and your job is easier. Compared to traditional analogorder tracking techniques, computed order tracking offers:Computed Order Tracking(Option 1D0)The slice marker feature is used to select and display an order or suborder from an order map.•For general digital signal processingand filtering , translate data files to formats compatible with MATLAB and MATRIX X , Data Set 58, or ASCII for use in popular spreadsheets.•For specific applications, useapplication software that reads SDF files directly, such as STARModal and STARAcoustics from SMS and CADA-PC from LMS.•Transfer data to and from the 35665A, 3566A, 3567A, 3562A,3563A.•Use the viewdata feature to display data on your PC or to convert to the HP-GL format for transfer to Microsoft’s Word for Windows or Lotus’ AMI PRO word processing software.•Convert between HP-LIF and MS-DOS ®formats.•Read data files into a program.Documented ResultsThe 35670A supports a variety of GPIB, serial and parallel printers and plotters for direct hardcopy output.The internal 3.5 inch flexible disk drive stores data, instrument states,HP-GL plots and Agilent Instrument BASIC programs in HP-LIF or MS-DOS formats for future recall or use on HP workstations or a personal computer.Entire display screens can be import-ed directly into your word processing program by plotting HP-GL files to your named DOS file. HP-GL files are interpreted and displayed directly by Microsoft’s Word for Windows and AMI PRO from Lotus Development Corp.•Improved dynamic range athigh orders•More accurate tracking of rapidly changing shaft speeds•Accurate RPM labeled spectra with exact RPM trigger arm •Wide 64:1 ratio of start to stop RPMsOrder MapUse order maps for an overview of vibration data versus RPM or time.Display the amplitude profile of individual orders and suborders using the slice marker function. Alternatively, use trace markers to select individual traces for display.MS-DOS and Microsoft are U.S. registered trademarks of Microsoft Corp.9Order TrackingMeasure only the data you need.Order tracking lets you measure the amplitude profile of up to five orders plus composite power simultaneously on each channel. Up to four orders or three orders and composite power can be dis-played simultaneously.RPM ProfileUse RPM profile to monitor the variation of RPM with time during order tracking measurements.Composite PowerComposite power provides the total signal power in a selected channel as a function of RPM.Run-Up and Run-Down MeasurementsRun-up and run-down measurements of any order are made using external trigger as the phase reference.Display the results as bode or polar plots; both are available.Markers allow convenient notation of important shaft speeds.OrbitsObtain oscilloscope-quality orbit measurements with your 35670A.Unlike traditional FFT analyzers, the 35670A equipped with computed order tracking displays a selected number of loops (usually one) as theshaft RPM is varied.Order tracking is used to simultaneously display up to four orders or a combination of orders,composite power and RPM profile.Markers are used to annotate shaft speeds at selected points in a run-up measurement.Oscilloscope-quality orbit diagrams mean you carry only one instrument onto the shop floor.10Real-Time Third Octave to 40 kHz ANSI S1.11-1986 Filter Shapes Microphone Inputs and Power A-Weighted Overall SPLRPM or Time-Triggered Waterfalls Eliminate the expense and inconvenience of multiple instruments in the field. With optional real-time octave analysis,and the optional microphoneadapter and power supply, you have a complete real-time octave analyzer added to your 35670A at a fraction of the cost of a second instrument.Now you can carry both your FFT and real-time octave analyzers to the job site in the same hand.Real-Time 1/3-Octave to 40 kHz on One ChannelWith two input channels of1/3-octave real-time measurements at frequencies up to 20 kHz, you get all of the information you’ll ever need to understand the noise performance of your product. No misinterpreted measurementsbecause transient components were missed. When the frequency range requirement is 10 kHz or less, use four channels to characterize spatial variations. For those exceptional circumstances, use 1/3-octave resolution at frequencies up to 40 kHz on a single channel.Resolutions of 1/1- and 1/12-octave are also available.Real-Time Octave Measurements (Option 1D1)Microphone Adapter and Power Supply (Option UK4)Overall sound pressure level and A-weighted sound pressure level can be displayed with the octave bands individually, together, or not at all.A fan-off mode lets you use the instrument in the sound field being measured.ANSI S1.11-1986All octave filters comply with filter shape standards ANSI S1.11-1986(Order 3, type 1-D), DIN 45651, and IEC 225-1966. An 80 dB dynamic range for the audio spectrumprovides the performance required by acousticians. Switchable analog A-weighting filters in the input channels comply fully with bothANSI S1.4-1983 and IEC 651-1979 Type 0.Advanced AnalysisUse waterfall displays of octave data for an overview of device noise versus time or RPM. Display individual frequency bands as a function of RPM or time using the slice marker function. Alternatively,use trace markers to select individual traces for display.A pink noise source is available for testing electro-acoustic devices.Sound LevelMeter MeasurementsPeak hold, impulse, fast, slow, and L eq are all provided with optional Real-time Octave Measurements. All measurements conform toIEC 651-1979 Type 0 - Impulse.Real-time 1/3-octave measurements at frequenciesup to 40 kHz.T his waterfall display of a flyover test can be analyzed trace-by-trace or by selecting time slices along thez-axis.Agilent 35670A with option UK4 microphone adapter and power supply.11130 dB Dynamic Range Logarithmic or Linear Sweeps “Auto” Frequency Resolution While FFT-based network analysis is fast and accurate, swept-sine measurements are a better choice when the device under test has a wide dynamic range or coversseveral decades of frequency e swept-sine measurements to extend the network measurement capabilities of the 35670A.Network Analysis Over a 130 dB RangeWith traditional swept-sine, the 35670A is optimally configured to measure each individual point in the frequency response. The result is a 130 dB dynamic range. With FFT-based network analysis, all frequency points are stimulated simultaneously and the instrument configures itself to measure thehighest amplitude response—thereby limiting the dynamic range.Characterize Nonlinear NetworksUse the auto-level feature to hold the input or output amplitude constant during a sweep. This provides the device response for a specific signal amplitude. With FFT-based network analysis using random noise, the randomamplitudes of the stimulus tend to “average out” the non-linearities and therefore does not capture thedependency of the response on the stimulus amplitude.Logarithmic SweepTest devices over more than six decades of frequency range using logarithmic sweep. In this mode,the frequency is automatically adjusted to provide the same resolution over each decade offrequency range. With FFT-network analysis, resolution is constant—not a problem when measuring over narrow frequency ranges.FlexibleMake the measurement your way.Independently select logarithmic or linear sweep, sweep up or down,automatic or manual sweep, and autoresolution.Automatic Frequency ResolutionUse autoresolution to obtain the fastest sweep possible without sacrificing accuracy. With autoresolution, the 35670Aautomatically adjusts the frequency step according to the deviceresponse. High rates of amplitude and phase change are matched with small frequency steps. Low rate-of-change regions are quickly measured with larger frequency steps.Test Multiple Devices SimultaneouslyIncrease throughput in production.Swept-sine measurements up to 25.6 kHz can be made on three devices simultaneously using swept-sine on a four-channel 35670A. Channel one is the common reference channel for these measurements.Alternatively, channels one and three can be designated asindependent reference channels for two totally independent swept-sine measurements.Swept-Sine Measurements(Option 1D2)The stability of a control loop is quickly character-ized using the gain and phase margin marker function.12Agilent Instrument BASIC (Option 1C2)Realize the advantages of using your instrument with a computer without sacrificing portability. Agilent Instrument BASIC provides the power of a computer inside your 35670A.Keystroke RecordingMost program development begins with keystroke recording. Each keystroke is automatically saved as a program instruction as you set up your measurement using the front panel. The recorded sequence can be used as the core of asophisticated program or run as an automatic sequence.Program entry and editing Program debugging Memory allocation Relation operators General math Graphics control Graphics plotting Graphics axes and labeling Program controlBinary functions Trigonometric operations String operations Logical operators GPIB control Mass storage Event initiated branching Clock and calendar General device I/O Array operationsOver 200 Agilent InstrumentBASIC Commands13Add Two Channels (Option AY6)Curve Fit and Synthesis (Option 1D3)51.2 kHz Frequency Range On One and Two Channels 25.6 kHz Frequency Range On Four ChannelsOne or Two Reference Channels Enhance your productivity by adding two additional inputchannels to your portable analyzer.Having four channels often means the difference between solving a problem in the field and having to schedule time in a test bay.Monitor four signals simultaneously or use channel one as thereference channel for up to three simultaneous cross-channel measurements. Two totally independent cross-channel measurements are made by selecting channels one and three as independent reference channels.All channels are sampled e triaxial measurements to simul-taneously characterize the motion of mechanical devices in three axes. For control systems, simultaneously measure several points in a single loop.20 Poles/20 Zeros Curve Fitter Frequency Response Synthesis Pole/Zero, Pole/Residue and Polynomial FormatUse curve fit and synthesis in the 35670A to take the guesswork out of your design process. The 20-pole and 20-zero multiple-degree-of-freedom curve fitter calculates a mathematical model of your system or circuit from measured frequency response data.The model can be expressed in pole/zero, pole/residue, orpolynomial format.Curve fit provides an exact mathematical model of your circuit or device.Transfer the circuit model to the synthesis function to experiment with design modifications. Add and delete poles and zeros, change gain factors, time delays, or frequency scaling, then synthesize the frequen-cy response from the modified model. Design modifications are tested without ever touching a sol-dering iron.14Standard 16 Mbytes RAMArbitrary Waveform Source (Option 1D4)Expand the data storage and time-capture capacity of your 35670A.Frequency or Time Domain Entry Data EditStore Up to Eight Arbitrary WaveformsTest your products using real-world signals. Measure a signal in either the time or frequency domain, then output it via the arbitrary waveform source. Use math functions and data edit to obtain precisely the output waveform you need. An arbitrary waveform may be output once or repeatedly.Standard source types can beoptimized for specific applications.For example, random noise can be shaped to improve the effectivedynamic range of your measurement.Alternatively, you can use data edit and math functions to create an arbitrary waveform.Use time capture as a digital tape recorder, then playback captured signals through the arbitrarywaveform source.Math functions are used to optimize a burst chirp signal for a frequency response measurement.Expand the data storage and time-capture capacity of your 35670A.Number of Spectra Stored Per ChannelStandard 16 MbyteFFT - 1 Channel 11400FFT- 2 Channels 2600FFT - 4 Channels 33001/3-Octave Spectra 448000Time Capture 1>6 MSamplesStandard 2 Mbyte Nonvolatile RAMUse the 2 Mbyte nonvolatile RAM in environments too harsh for the 3.5inch flexible disk drive. The memory functions as a high-speed disk for storage of the following information.•Instrument Setup States •Trace Data•User Math Definitions •Limit Data•Time Capture Buffers•Agilent Instrument BASIC Programs •Waterfall Display Data •Curve Fit/Synthesis Tables •Data TablesInformation stored in nonvolatile RAM is retained when the power is off.1Conditions: Preset with instrument mode switched to 1 channel.2Conditions: Preset3Conditions: Preset with instrument mode switched to 4 channels.4Conditions: Preset with instrument mode switched to octave.。
- 1、下载文档前请自行甄别文档内容的完整性,平台不提供额外的编辑、内容补充、找答案等附加服务。
- 2、"仅部分预览"的文档,不可在线预览部分如存在完整性等问题,可反馈申请退款(可完整预览的文档不适用该条件!)。
- 3、如文档侵犯您的权益,请联系客服反馈,我们会尽快为您处理(人工客服工作时间:9:00-18:30)。
– 信号源参数:信号类型(随机、正弦、瞬态)和输
出电平
• 测量分析参数设置
– 窗函数 – 平均方式与平均次数
• 显示参数 • 数据存盘或输出
Ha=
1 2
(1−
cos
2πt T
)
Wh (t)
=
1 2
(1 −
cos
2πt T
)
主要用于随机信号分析
T = 1/ ∆f
∆f
fm
=
N 2.56
⋅ ∆f
• 信号长度有限(如瞬态信号),应优先选择记录时间T
∆f = 1/ T
T
fm
=
N 2.56
/T
设置动态信号分析仪的参数
• 数据采集参数设置
– 输入参数:通道量程,输入模式(电压、电荷、
ICP),耦合方式(DC或AC),传感器灵敏度等
– 触发参数:触发方式(输入触发、信号源触发、外
抗混滤波器的截止频率 采样频率Fs
• 参数相互关系
Fs = 2.56 fm ∆t =1/ Fs T = N ⋅ ∆t ∆f = 1/ T
– 采样点数N :一般为1024、2048、4096 – 谱线数:等于N/2.56,一般为400、800、1600
• 为了减小频率分析结果的偏度误差,应优先考虑 ∆f
汉宁窗效果说明
指数窗
主要用于锤击法的脉冲激励信号分析
动态 信号分析仪
接口总线
外触发 信号输入
动态信号分析仪主要功能
• 时域分析:时间波形、相关函数、脉冲响应函数等 • 频域分析:线性谱、功率谱(均方谱)、频率响应
函数、相干函数等
动态信号分析仪的三种测量模式
• FFT分析模式(FFT ANALYSIS)
– 时间波形与线性谱 – 功率谱密度与相关函数 – 频率响应函数与脉冲函数 – 时域和频域互为FFT关系
动态信号分析仪及其使用
动态信号分析仪简介
• 将动态信号采集、显示、 存储、分析集成一体
• 一般有2~4个输入通道,1 个信号源通道。每个输入 通道由程控放大器、抗混 滤波器、采样/保持器和模 数转换器组成
• 含有CPU、DSP、FPP、 RAM、控制软件、计算分 析软件
动态信号分析仪示意图
信号源 显示、存储
• 正弦扫频模式(SWEPT SINE)
– 采用正弦扫频激励,相关积分计算频率响应函数
• 时间捕捉模式(TIME CAPTURE)
– 将一批数据存储于内部缓存,可调出该数据做再分析
动态信号分析仪使用
• 关键问题
– 根据测量分析目的,正确合理地选择和设置测量、 分析参数
• 优先选择参数
– 频率范围 fm – 频率分辨率 ∆f – 记录长度 T