IEEE Xplore Full-Text PDF_
IEEExplore_Compatible_Template IEEE标准模板
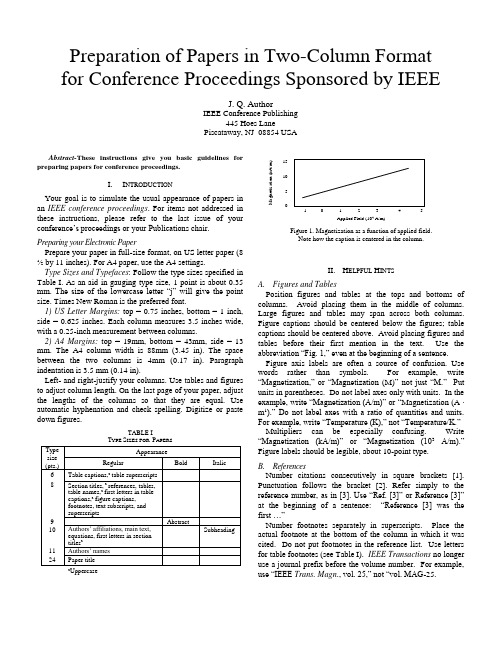
Preparation of Papers in Two-Column Format for Conference Proceedings Sponsored by IEEEJ. Q. AuthorIEEE Conference Publishing445 Hoes LanePiscataway, NJ 08854 USAAbstract-These instructions give you basic guidelines for preparing papers for conference proceedings.I.I NTRODUCTIONYour goal is to simulate the usual appearance of papers in an IEEE conference proceedings. For items not addressed in these instructions, please refer to the last issue of your conference’s proceedings or your Publication s chair. Preparing your Electronic PaperPrepare your paper in full-size format, on US letter paper (8 ½ by 11 inches). For A4 paper, use the A4 settings.Type Sizes and Typefaces: Follow the type sizes specified in Table I. As an aid in gauging type size, 1 point is about 0.35 mm. The size of the lowercase letter “j” will give the point size. Times New Roman is the preferred font.1) US Letter Margins: top = 0.75 inches, bottom = 1 inch, side = 0.625 inches. Each column measures 3.5 inches wide, with a 0.25-inch measurement between columns.2) A4 Margins:top = 19mm, bottom = 43mm, side = 13 mm. The A4 column width is 88mm (3.45 in). The space between the two columns is 4mm (0.17 in). Paragraph indentation is 3.5 mm (0.14 in).Left- and right-justify your columns. Use tables and figures to adjust column length. On the last page of your paper, adjust the lengths of the columns so that they are equal. Use automatic hyphenation and check spelling. Digitize or paste down figures.TABLE IT YPE S IZES FOR P APERSa Uppercase15105-1 0 1 2 3 4 5Applied Field (104 A/m)Figure 1. Magnetization as a function of applied field.Note how the caption is centered in the column.II.H ELPFUL H INTSA.Figures and TablesPosition figures and tables at the tops and bottoms of columns. Avoid placing them in the middle of columns. Large figures and tables may span across both columns. Figure captions should becentered below the figures; table captions should be centered above. Avoid placing figures and tables before their first mention in the text. Use the abbreviation “Fig. 1,” even at the beginning of a sentence. Figure axis labels are often a source of confusion. Use words rather than symbols. For example, write “Magnetization,” or “Magnetization(M)” not just “M.” Put units in parentheses. Do not label axes only with units. In the example, write “Magnetization (A/m)” or “Magnetization (A m1).” Do not label axes with a ratio of quantities and units. For example, write “Temperature (K),” not “Temperature/K.”Multipliers can be especially confusing. Write “Magnetization (kA/m)” or “Magnetization (103A/m).” Figure labels should be legible, about 10-point type.B.ReferencesNumber citations consecutively in square brackets [1]. Punctuation follows the bracket [2]. Refer simply to the reference number, as in [3]. Use “Ref. [3]” or Reference [3]” at the beginning of a sentence: “Reference [3] was the first …”Number footnotes separately in superscripts. Place the actual footnote at the bottom of the column in which it was cited. Do not put footnotes in the reference list. Use letters for table footnotes (see Table I). IEEE Transactions no longer use a journal prefix before the volume number. For example, use “IEEE Trans. Magn., vol. 25,” not “vol. MAG-25.Magnetization(kA/m)Give all authors’ names; use “et al.” if there are six authors or more. Papers that have not been published, even if they have been submitted for publication, should be cited as “unpublished” [4]. Papers that have been accepted for publication should be cited as “in press” [5]. In a paper title, capitalize the first word and all other words except for conjunctions, prepositions less than seven letters, and prepositional phrases.For papers published in translated journals, first give the English citation, then the original foreign-language citation [6].C.Abbreviations and AcronymsDefine abbreviations and acronyms the first time they are used in the text, even if they have been defined in the abstract. Abbreviations such as IEEE, SI, MKS, CGS, sc, dc, and rms do not have to be defined. Do not use abbreviations in the title unless they are unavoidable.D.EquationsNumber equations consecutively with equation numbers in parentheses flush with the right margin, as in (1). To make your equations more compact, you may use the solidus ( / ), the exp function, or appropriate exponents. Italicize Roman symbols for quantities and variables, but not Greek symbols. Use an en dash (–) rather than a hyphen for a minus sign. Use parentheses to avoid ambiguities in denominators. Punctuate equations with commas or periods when they are part of a sentence, as ina +b = c. (1) Symbols in your equation should be defined before the equation appears or immediately following. Use “(1),” not “Eq. (1)” or “equation (1),” except at the beginning of a sentence: “Equation (1) is …”E.Other RecommendationsThe Roman numerals used to number the section headings are optional. If you do use them, do not number A CKNOWLEDGMENT and R EFERENCES, and begin Subheadings with letters. Use two spaces after periods (full stops). Hyphenate complex modifiers: “zero-field-cooled magnetization.” Avoid dangling participles, such as, “Using (1), the potential was calculated.” Write instead, “The potential was calculated using (1),” or “Using (1), we calculated the potential.”Use a zero before decimal points: “0.25,” not “.25.” Use “cm3,” not “cc.” Do not mi x complete spellings and abbreviations of units: “Wb/m2” or “webers per square meter,” not “webers/m2.” Spell units when they appear in text: “…a few henries,” not “…a few H.” If your native language is not English, try to get a native English-speaking colleague to proofread your paper. Do not add page numbers.III.U NITSUse either SI (MKS) or CGS as primary units. (SI units are encouraged.) English units may be used as secondary units (in parentheses). An exception would be the use of English units as ident ifiers in trade, such as “3.5-inch disk drive.”Avoid combining SI and CGS units, such as current in amperes and magnetic field in oersteds. This often leads to confusion because equations do not balance dimensionally. If you must use mixed units, clearly state the units for each quantity that you use in an equation.IV.S OME C OMMON M ISTAKESThe word “data” is plural, not singular. The subscript for the permeability of vacuum0is zero, not a lowercase letter “o.” In American English, periods and commas are within quotation marks, like “this period.” A parenthetical statement at the end of a sentence is punctuated outside of the closing parenthesis (like this). (A parenthetical sentence is punctuated within the parentheses.) A graph within a graph is an “inset,” not an “insert.” The word alternatively is preferred to the word “alternately” (unless you mean something that alternates). Do not use the word “essentially” to mean “approximately” or “effectively.” Be aware of the different meanings of the homoph ones “affect” and “effect,” “complement” and “compliment,” “discreet” and “discrete,” “principal” and “principle.” Do not confuse “imply” and “infer.” The prefix “non” is not a word; it should be joined to the word it modifies, usually without a hyphen. There is no period after the “et” in the Latin abbreviation “et al.” The abbreviation “i.e.” means “that is,” and the abbreviation “e.g.” means “for example.” An excellent style manual for science writers is [7].A CKNOWLEDGMENTThe preferred spelling of the word “acknowledgment” in America is without an “e” after the “g.” Try to avoid the stilted expression, “One of us (R. B. G.) thanks …” Instead, try “R.B.G. thanks …” Put sponsor acknowledgments in the unnumbered footnote on the first page.R EFERENCES[1] G. Eason, B. Noble, and I.N. Sneddon, “On certain integrals ofLipschitz-Hankel type involving products of Bessel functions,” Phil.Trans. Roy. Soc. London, vol. A247, pp. 529-551, April 1955.[2] J. Clerk Maxwell, A Treatise on Electricity and Magnetism, 3rd ed., vol.2. Oxford: Clarendon, 1892, pp.68-73.[3] I.S. Jacobs and C.P. Bean, “Fine particles, thin films and exchangeanisotropy,” in Magnetism, vol. III, G.T. Rado and H. Suhl, Eds. New York: Academic, 1963, pp. 271-350.[4] K. Elissa, “Title of paper if known,” unpublished.[5] R. Nicole, “Title of paper with only first word capitalized,” J. NameStand. Abbrev., in press.[6] Y. Yorozu, M. Hirano, K. Oka, and Y. Tagawa, “Electron spectroscopystudies on magneto-optical media and plastic subst rate interface,” IEEE Transl. J. Magn. Japan, vol. 2, pp. 740-741, August 1987 [Digests 9th Annual Conf. Magnetics Japan, p. 301, 1982].[7] M. Young, The Technical Writer’s l Valley, CA:University Science, 1989.。
IEEE 1547.1 - 2005

IEEE Std 1547.1™-20051 July 2005Print: SH95346PDF: SS95346The Institute of Electrical and Electronics Engineers, Inc.3 Park Avenue, New York, NY 10016-5997, USACopyright © 2005 by the Institute of Electrical and Electronics Engineers, Inc.All rights reserved. Published 1 July 2005. Printed in the United States of America.IEEE is a registered trademark in the U.S. Patent & Trademark Office, owned by the Institute of Electrical and Electronics Engineers, Incorporated.Print: ISBN 0-7381-4736-2 SH95346PDF: ISBN 0-7381-4737-0 SS95346No part of this publication may be reproduced in any form, in an electronic retrieval system or otherwise, without the prior written permission of the publisher.IEEE Std 1547.1™-2005IEEE Standard Conformance Test Procedures for Equipment Interconnecting Distributed Resources with Electric Power SystemsSponsorIEEE Standards Coordinating Committee 21 onFuel Cells, Photovoltaics, Dispersed Generation, and Energy StorageApproved 9 June 2005IEEE-SA Standards BoardAbstract: This standard specifies the type, production, and commissioning tests that shall be performed to demonstrate that the interconnection functions and equipment of the distributed re-sources (DR) conform to IEEE Std 1547™.Keywords: distributed resources, interconnection, test proceduresIEEE Standards documents are developed within the IEEE Societies and the Standards Coordinating Committees of the IEEE Standards Association (IEEE-SA) Standards Board. The IEEE develops its standards through a consensus development process, approved by the American National Standards Institute, which brings together volunteers representing varied viewpoints and interests to achieve the final product. Volunteers are not necessarily members of the Institute and serve without compensation. While the IEEE administers the process and establishes rules to promote fairness in the consensus development process, the IEEE does not independently evaluate, test, or verify the accuracy of any of the information contained in its standards.Use of an IEEE Standard is wholly voluntary. The IEEE disclaims liability for any personal injury, property or other damage, of any nature whatsoever, whether special, indirect, consequential, or compensatory, directly or indirectly resulting from the publication, use of, or reliance upon this, or any other IEEE Standard document.The IEEE does not warrant or represent the accuracy or content of the material contained herein, and expressly disclaims any express or implied warranty, including any implied warranty of merchantability or fitness for a specific purpose, or that the use of the material contained herein is free from patent infringement. IEEE Standards documents are supplied “AS IS .”The existence of an IEEE Standard does not imply that there are no other ways to produce, test, measure, purchase, market,or provide other goods and services related to the scope of the IEEE Standard. Furthermore, the viewpoint expressed at the time a standard is approved and issued is subject to change brought about through developments in the state of the art and comments received from users of the standard. Every IEEE Standard is subjected to review at least every five years for revision or reaffirmation. When a document is more than five years old and has not been reaffirmed, it is reasonable to conclude that its contents, although still of some value, do not wholly reflect the present state of the art. Users are cautioned to check to determine that they have the latest edition of any IEEE Standard.In publishing and making this document available, the IEEE is not suggesting or rendering professional or other services for, or on behalf of, any person or entity. Nor is the IEEE undertaking to perform any duty owed by any other person or entity to another. Any person utilizing this, and any other IEEE Standards document, should rely upon the advice of a competent professional in determining the exercise of reasonable care in any given circumstances.I nterpretations: Occasionally questions may arise regarding the meaning of portions of standards as they relate to specific applications. When the need for interpretations is brought to the attention of IEEE, the Institute will initiate action to prepare appropriate responses. Since IEEE Standards represent a consensus of concerned interests, it is important to ensure that any interpretation has also received the concurrence of a balance of interests. For this reason, IEEE and the members of its societies and Standards Coordinating Committees are not able to provide an instant response to interpretation requests except in those cases where the matter has previously received formal consideration. At lectures, symposia, seminars, or educational courses, an individual presenting information on IEEE standards shall make it clear that his or her views should be considered the personal views of that individual rather than the formal position, explanation, or interpretation of the IEEE.Comments for revision of IEEE Standards are welcome from any interested party, regardless of membership affiliation with IEEE. Suggestions for changes in documents should be in the form of a proposed change of text, together with appropriate supporting comments. Comments on standards and requests for interpretations should be addressed to:Secretary, IEEE-SA Standards Board445 Hoes LanePiscataway, NJ 08854USAAuthorization to photocopy portions of any individual standard for internal or personal use is granted by the Institute of Electrical and Electronics Engineers, Inc., provided that the appropriate fee is paid to Copyright Clearance Center. To arrange for payment of licensing fee, please contact Copyright Clearance Center, Customer Service, 222 Rosewood Drive,Danvers, MA 01923 USA; +1 978 750 8400. Permission to photocopy portions of any individual standard for educational classroom use can also be obtained through the Copyright Clearance Center.NOTE −Attention is called to the possibility that implementation of this standard may require use of subject matter covered by patent rights. By publication of this standard, no position is taken with respect to the existence or validity of any patent rights in connection therewith. The IEEE shall not be responsible for identifying patents for which a license may be required by an IEEE standard or for conducting inquiries into the legal validity or scope of those patents that are brought to its attention.IntroductionThis introduction is not part of IEEE Std 1547.1-2005, IEEE Standard Conformance Test Procedures for Equip-ment Interconnecting Distributed Resources with Electric Power Systems.IEEE Std 1547.1 is one of a series of standards developed by Standards Coordinating Committee 21 (SCC21) concerning distributed resources (DR) interconnection. The titles of the additional documents in that series follow:—IEEE Std 1547, IEEE Standard for Interconnecting Distributed Resources with Electric Power Systems a—IEEE P1547.2™, Draft Application Guide for IEEE Std 1547, Interconnecting Distributed Resources with Electric Power Systems [B6]b—IEEE P1547.3™, Draft Guide for Monitoring, Information Exchange, and Control of Distributed Resources Interconnected with Electric Power Systems [B7]—IEEE P1547.4™, Draft Guide for Design, Operation, and Integration of Distributed Resource Island Systems with Electric Power Systems [B8]—IEEE P1547.5™, Draft Technical Guidelines for Interconnection of Electric Power Sources Greater Than 10 MVA to the Power Transmission Grid [B9]—IEEE P1547.6™, Draft Recommended Practice for Interconnecting Distributed Resources with Electric Power Systems Distribution Secondary Networks [B10]The root standard, IEEE Std 1547, defines a set of uniform requirements for the interconnection of DR to the distribution segment of the electric power system (EPS). IEEE Std 1547 is an outgrowth of the changes in the environment for production and delivery of electricity and builds on prior IEEE recommended practices and guidelines developed by SCC21.IEEE Std 1547 includes requirements relevant to the operation of the interconnection. It generally defines limitations and set points for various parameters that must be satisfied prior to the connection of a DR unit to the EPS, at the instant of connection, and for the separation of such resources from the EPS for abnormal conditions.IEEE Std 1547.1 provides conformance test procedures to establish and verify compliance with the requirements of IEEE Std 1547. When applied, the IEEE 1547.1 test procedures can provide a means for manufacturers, utilities, or independent testing agencies to confirm the suitability of any given interconnec-tion system (ICS) or component intended for use in the interconnection of DR with the EPS. Such certification can lead to the ready acceptance of confirmed equipment as suitable for use in the intended ser-vice by the parties concerned. While this standard defines test procedures, it does not specify measurement techniques. Suitable measurement techniques can be found in various technical publications including, but not limited to, IEEE Std 120™ [B13].It is beyond the scope of IEEE 1547.1 to specify the design and performance criteria for ICSs or compo-nents. It is left to the parties concerned to determine that the equipment manufacturer’s specifications and confirmed performance satisfy the technical needs of the EPS distribution circuit to which the DR unit is to be connected. Similarly, this standard does not address the local electrical power system technical needs nor load requirements for the facility or premises where the point of DR connection is made.a Information on references can be found in Clause2.b The numbers in brackets correspond to the numbers of the bibliography in Annex B.Copyright © 2005 IEEE. All rights reserved.iiiiv Copyright © 2005 IEEE. All rights reserved.Notice to usersErrata Errata, if any, for this and all other standards can be accessed at the following URL: /reading/ieee/updates/errata/index.html. Users are encouraged to check this URL for errata periodically.Interpretations Current interpretations can be accessed at the following URL: /reading/ieee/interp/index.html.PatentsAttention is called to the possibility that implementation of this standard may require use of subject matter covered by patent rights. By publication of this standard, no position is taken with respect to the existence or validity of any patent rights in connection therewith. The IEEE shall not be responsible for identifying patents or patent applications for which a license may be required to implement an IEEE standard or for con-ducting inquiries into the legal validity or scope of those patents that are brought to its attention.ParticipantsAt the time this standard was completed, the SCC21 had the following membership:Richard DeBlasio , ChairSteve Chalmers , Vice ChairThomas S. Basso , SecretaryAt the time this standard was completed, the DR Interconnection Conformance Test Procedures Working Group (P1547.1 WG) of the SCC21 had the following membership. These members also composed the indi-vidual balloting committee that voted on this standard. Balloters may have voted for approval, disapproval,or abstention.James M. Daley , ChairCharles Whitaker , Vice ChairBenjamin Kroposki , SecretaryJerry AndersonJay ChamberlinJames M. DaleyDouglas C. DawsonWilliam E. Feero N. Richard Friedman Frank Goodman Kelvin Hecht Barry Hornberger Joseph L. KoepfingerBenjamin Kroposki Robert McConnell John Stevens John Wiles John Wohlgemuth Timothy P. ZgonenaWilliam J. AckermanJ. Reese AdomaitisBrij AggarwalPaul BarnhartDavid BassettThomas BassoMichael BehnkeVijay Bhavaraju Kenneth Birt William Brooks Gary Brownfield Ted Burse Eldridge R Byron Simon Cheng Keith Chow Stephen P. Conrad Terry Conrad William Cook Dave M. Costyk Matthew Davis Richard DeBlasio Joseph Debs Guru Dutt Dhingra Kevin DonahoeCopyright © 2005 IEEE. All rights reserved.vThe following working group members participated in finalizing the development of this standard with working group inputs and in facilitating the development of those inputs throughout the standards develop-ment process:When the IEEE-SA Standards Board approved this standard on 9 June 2005, it had the following membership:Steve M. Mills, ChairRchard H. Hulett, Vice ChairJudith Gorman, Secretary*Member Emeritus Neil DowlingMichael EddsLynnda EllDoug EdwardsGary R. EngmannThomas (Tom) W. ErnstWilliam E. FeeroDavid FrankN. Richard (Dick) FriedmanJoseph (Joe) GaldoAndris GarsilsS. (Dave) GohilManuel GonzalezFrank GoodmanTom GordonRandall GrovesNancy GundersonJames GurneyRonald D. HartzelSteven HensleyClark G. HochgrafDonald L. HornakRaymond M. HudsonMichael J. HylandSteven JochumsVinod JohnJohn R. KennedyYuri KhersonskyJoseph L. KoepfingerScott Lacy Frank Lambert Richard (Rick) Langley Gerald Lee James W. Lemke David Lemmerman Jason Lin Guoliang Liu Kevin Loving Vahid Madani Scott Malinowski Sylvain Martel Frank Mayle Anthony Mazy Walter McCannon Peter McNutt Nigel McQuin G. Michel Anne Morgan Charles Morse Pratap Mysore Arun Narang T. W. Olsen Gary Olson Gregory Olson Ronald Onate Miklos Orosz Michael Pehosh Lisa Potter Stan Pukash Robert RalloCharles Rogers Bob Saint Carl Schneider Gary W. Scott Gary Seifert Kent Sheldon H. Jin Sim Andrew Skok Cameron Smallwood Dehn Stevens David Stone Paul Sullivan Craig Taborsky Chand Tailor Rao Thallam Elisabeth (Betty) A. Tobin Mohammad Vaziri Hemant Vora Tim (Carl T.) Wall Simon Wall Reigh A. Walling Randall (Randy) West Ron Westfall John S. Wheat John Wiles Robert Wills Thomas Wind Zhihong Ye Timothy P. Zgonena Donald (Don) W. Zipse Ahmed ZobaaJames M. DaleyBenjamin Kroposki Richard Langley Kevin LovingGary L. Olson Charles Whitaker Timothy P. ZgonenaMark D. BowmanDennis B. BrophyJoseph BruderRichard CoxBob DavisJulian Forster*Joanna N. GueninMark S. HalpinRaymond HapemanWilliam B. Hopf Lowell G. Johnson Herman Koch Joseph L. Koepfinger*David J. Law Daleep C. Mohla Paul Nikolich T. W. Olsen Glenn Parsons Ronald C. Petersen Gary S. Robinson Frank Stone Malcolm V. Thaden Richard L. Townsend Joe D. Watson Howard L. WolfmanAlso included are the following nonvoting IEEE-SA Standards Board liaisons:Satish K. Aggarwal, NRC RepresentativeRichard DeBlasio, DOE RepresentativeAlan H. Cookson, NIST RepresentativeMiche l le D. TurnerIEEE Standards Project Editorvi Copyright © 2005 IEEE. All rights reserved.Contents1.Overview (1)1.1Scope (1)1.2Purpose (1)1.3Limitations (2)2.Normative references (2)3.Definitions and acronyms (3)3.1ICS boundaries (3)3.2Definitions (3)3.3Acronyms (5)4.General requirements (5)4.1Test result accuracy (5)4.2Testing environment (5)4.3Measurement accuracy and calibration of the testing equipment (5)4.4Product information (6)4.5Test reports (6)4.6Testing equipment requirements (6)5.Type tests (7)5.1Temperature stability (8)5.2Test for response to abnormal voltage conditions (9)5.3Response to abnormal frequency conditions (13)5.4Synchronization (15)5.5Interconnection integrity (23)5.6Limitation of dc injection for inverters without interconnection transformers (24)5.7Unintentional islanding (25)5.8Reverse power (for unintentional islanding) (32)5.9Open phase (33)5.10Reconnect following abnormal condition disconnect (34)5.11Harmonics (35)5.12Flicker (38)6.Production tests (38)6.1Response to abnormal voltage (39)6.2Response to abnormal frequency (39)6.3Synchronization (40)6.4Documentation (41)missioning test (41)7.1General (41)7.2Verifications and inspections (42)7.3Field-conducted type and production tests (42)7.4Unintentional islanding functionality test (42)Copyright © 2005 IEEE. All rights reserved.vii7.5Cease-to-energize functionality test (43)7.6Revised settings (44)8.Periodic interconnection tests (44)Annex A (normative) Test signals (45)A.1Magnitude test (ramp function)—general (45)A.2Time test (step function)—general (48)A.3Reverse-power magnitude test (ramp function) (48)A.4Reverse-power time test (step function) (50)Annex B (informative) Bibliography (53)viii Copyright © 2005 IEEE. All rights reserved.IEEE Standard ConformanceTest Procedures forEquipment Interconnecting Distributed Resources withElectric Power Systems1. OverviewThis standard provides tests and procedures for verifying conformance of interconnection systems (ICSs) to IEEE Std 1547™.1 It is recognized that an ICS can be a single device providing all required functions or an assembly of components, each having limited functions. Components having limited functions shall be tested for those functions in accordance with this standard. Conformance may be established through combi-nation of type (referred to as “design” tests in IEEE Std 1547), production, and commissioning tests. Additionally, conformance to IEEE Std 1547 requires interconnection installation evaluation and periodic tests.This standard also includes Annex A, which describes test signals and ramp functions used in conducting some tests. Additionally, a bibliography is included as Annex B; it lists documents that are referred to in this standard for informative purposes, but that are not required to implement the procedures defined in this standard.1.1 ScopeThis standard specifies the type, production, and commissioning tests that shall be performed to demonstrate that the interconnection functions and equipment of the distributed resources (DR) conform to IEEE Std1547.1.2 PurposeInterconnection equipment that connects DR to an electric power system (EPS) must meet the requirements specified in IEEE Std 1547. Standardized test procedures are necessary to establish and verify compliance with those requirements. These test procedures must provide both repeatable results, independent of test location, and flexibility to accommodate the variety of DR technologies.1Information on references can be found in Clause2.Copyright © 2005 IEEE. All rights reserved.1Std 1547.1-2005IEEE STANDARD CONFORMANCE TEST PROCEDURES FOR EQUIPMENT 1.3 LimitationsThis standard does not cover testing for safety.Although this standard does not define a certification process, these tests may be used as part of such a process.2. Normative referencesThe following referenced documents are indispensable for the application of this standard. For dated refer-ences, only the edition cited applies. For undated references, the latest edition of the referenced document (including any amendments or corrigenda) applies.The applicability of the following standards is determined by the specific requirements stated in this stan-dard, such as requiring certain sections.ANSI C37.06, American National Standard for AC High-Voltage Circuit Breakers Rated on a Symmetrical Current Basis—Preferred Ratings and Related Required Capabilities.2ANSI C84.1, American National Standard for Electric Power Systems and Equipment—Voltage Ratings (60Hz).IEEE C37.09™, IEEE Standard Test Procedure for AC High-Voltage Circuit Breakers Rated on a Symmet-rical Current Basis.3, 4IEEE Std C37.90.1™, IEEE Standard for Surge Withstand Capability (SWC) Tests for Relays and Relay Systems Associated with Electric Power Apparatus.IEEE Std C37.90.2™, IEEE Standard for Withstand Capability of Relay Systems to Radiated Electromag-netic Interference from Transceivers.IEEE Std C62.41.2™, IEEE Recommended Practice on Characterization of Surges in Low-Voltage (1000 V and Less) AC Power Circuits.IEEE Std C62.45™, IEEE Recommended Practice on Surge Testing for Equipment Connected to Low-Voltage (1000 V and Less) AC Power Circuits.IEEE Std 1547™, IEEE Standard for Interconnecting Distributed Resources with Electric Power Systems. NEMA MG-1, Motors and Generators.52ANSI publications are available from the Sales Department, American National Standards Institute, 25 West 43rd Street, 4th Floor, New York, NY 10036, USA (/).3IEEE publications are available from the Institute of Electrical and Electronics Engineers, 445 Hoes Lane, Piscataway, NJ 08854, USA (/).4The IEEE standards or products referred to in this clause are trademarks of the Institute of Electrical and Electronics Engineers, Inc. 5NEMA publications are available from Global Engineering Documents, 15 Inverness Way East, Englewood, Colorado 80112, USA (/).3. Definitions and acronymsFor purposes of this standard, the following terms and definitions apply. The Authoritative Dictionary of IEEE Standards Terms [B5] should be referenced for terms not defined in this clause.3.1 ICS boundariesAn ICS consists of system controls, electrical protection, and steady-state control and may include energy conversion and/or generator. The DR may include all or part of the ICS. Figure1 shows the boundary between the ICS, the EPS, and the energy source.Figure 1—Boundaries between the ICS, the EPS, and the DR3.2 Definitions3.2.1 area electric power system (EPS): An EPS that serves local EPSs. Note that, typically, an area EPS has primary access to public rights-of-way, priority crossing of property boundaries, etc., and is subject to regulatory oversight.3.2.2 clearing time: The time between the start of the abnormal condition and the distributed resources’(DR’s) ceasing to energize the area electric power system (EPS). It is the sum of the detection time, any adjustable time delay, the operating time for any interposing devices (if used), and the operating time for the interrupting device (used to interconnect the DR with the area EPS).3.2.3 commissioning test: A test conducted when the equipment is installed to verify correct operation. 3.2.4 design test:See:type test.3.2.5 detection time: The minimum length of time from the inception of the abnormal condition to the change in state of the device or function dedicated to controlling the interrupting device. Syn: processing time.3.2.6 distributed generation (DG): Electric generation facilities connected to an area electric power system (EPS) through a point of common coupling (PCC); a subset of distributed resources (DR).Std 1547.1-2005IEEE STANDARD CONFORMANCE TEST PROCEDURES FOR EQUIPMENT 3.2.7 distributed resources (DR): Sources of electric power that are not directly connected to a bulk power transmission system. DR includes both generators and energy storage technologies.3.2.8 electric power system (EPS): Facilities that deliver electric power to a load. Note that EPS may include generation units. See also:area electric power system (EPS); local electric power system (EPS).3.2.9 interconnection system (ICS): the collection of all equipment and functions, taken as a group, used to interconnect a distributed resources (DR) unit to an area electric power system (EPS).3.2.10 interrupting device: A device capable of being opened and reclosed whose purpose is to interrupt faults and restore service or disconnect loads. These devices can be manual, automatic, or motor-operated. Examples include circuit breakers, motor-operated switches, and electronic switches.3.2.11 inverter: A machine, device, or system that changes dc power to ac power.3.2.12 island: A condition in which a portion of an area electric power system (EPS) is energized solely by one or more local EPSs through the associated points of common coupling (PCCs) while that portion of the area EPS is electrically separated from the rest of the area EPS.3.2.13 local electric power system (EPS): An EPS contained entirely within a single premises or group of premises.3.2.14 nominal: The value or range of a parameter being within expected norms or being the normal operat-ing level of that parameter.3.2.15 paralleling device: A device (e.g., circuit breaker) operating under the control of a synchronizing function to electrically connect two energized power sources together.3.2.16 point of common coupling (PCC): The point where a local electric power system (EPS) is con-nected to an area EPS.3.2.17 point of distributed resources (DR) connection: The point where a DR unit is electrically con-nected in an electric power system (EPS).3.2.18 production test: A test conducted on every unit of equipment prior to shipment.3.2.19 signal injection test methods: Test methods where signals are injected into the sense terminals of the equipment under test (EUT). These methods include both primary injection test methods and secondary injection test methods.3.2.20 simulated area electric power system (EPS): An assembly of voltage and frequency test equipment replicating a utility power source. Where appropriate, the actual area EPS can be used as the simulated area EPS.3.2.21 simulated utility:See:simulated area electric power system (EPS).3.2.22 total rated-current distortion (TRD): The total root-sum-square of the current harmonics created by the distributed resources (DR) unit operating into a linear balanced load divided by the greater of the test load current demand IL or the rated-current capacity of the DR unit Irated.3.2.23 trip time: The interval that begins at the leading zero-crossing of the first half cycle of the voltage waveform in which the measured parameter (e.g., frequency, voltage, power) exceeds the trip limit and ends when the equipment under test (EUT) responds as required.3.2.24 type test: Test of one or more devices made to a certain design to demonstrate that the design meets certain specifications. Syn: design test.3.3 AcronymsCT current transformerd.p.f.displacement power factorDR distributed resourcesEMI electromagnetic interferenceEPS electric power systemEUT equipment under testICS interconnection systemPCC point of common couplingp.f.power factorPUT parameter under testRLC resistance, inductance, and capacitancerms root mean squareTHD total harmonic distortionTRD total rated-current distortionVT voltage transformer4. General requirementsImplementation of these test procedures shall be conducted in accordance with appropriate safety proce-dures, sequences, and precautions.4.1 Test result accuracyThe test results shall verify that the equipment under test (EUT) meets the requirements of IEEE Std 1547 within the manufacturer’s specified accuracy.4.2 Testing environmentThe manufacturer shall specify the range of environmental conditions for the EUT. Therefore, tests shall be conducted in an environment that is within the manufacturer’s specified environmental operating conditions.4.3 Measurement accuracy and calibration of the testing equipmentMeasurement equipment used to confirm performance of an EUT shall have calibration traceablity. The accuracy of the measuring equipment shall be suitable for the test being conducted.Std 1547.1-2005IEEE STANDARD CONFORMANCE TEST PROCEDURES FOR EQUIPMENT 4.4 Product informationThe setting of limits and the structure of this standard are based on the understanding that the installer and user are responsible for following the installation recommendations of the manufacturer.The manufacturer shall supply the EUT tester with documentation necessary for the correct installation into a typical system or process in the intended environment. A functional description and a definition of specifi-cation limits for the acceptance criteria shall be provided by the manufacturer and noted in the test report. Any external devices or equipment or special connection requirements necessary to conduct the tests shall be clearly stated (including rationale) in the user documentation. Special requirements can include the amount of network impedance, voltampere burden of the EUT, the use of shielded or special cables, maxi-mum cable length, the use of filters, and the correct bonding to functional earth (grounding). If different devices or connection requirements apply in different environments, this shall also be stated. A list of auxil-iary equipment (e.g., options or enhancements) that can be added to the EUT and that can impact the result of EUT tests shall be made available. This information shall also be covered in the test report to clarify the as-tested arrangement(s).Accuracy and tolerances of device parameters shall be stated by the manufacturers.4.5 Test reportsThe test results shall be documented in a test report. The report shall clearly and unambiguously present all relevant information of the tests (e.g., load conditions, conductor type or routing, functional description, acceptance criteria).Within the test report, test procedures, as performed, shall be detailed; and engineering considerations, including test modifications and exemptions, shall be justified. When used in conjunction with this standard, the test report shall include sufficient critical operating information to rerun the test and reproduce the results.Each test method shall be specified; and engineering considerations, including range of operating condi-tions, shall be justified.4.6 Testing equipment requirements4.6.1 Simulated area EPS (utility) source requirementsWhere testing allows the use of a simulated area EPS source, the following requirements shall be met: —The simulated area EPS source shall be capable of confirming the manufacturer’s stated performance.—The voltage harmonics of the simulated area EPS source shall be less than 2.5% total harmonic dis-tortion (THD).—The individual voltage harmonics of the simulated utility shall be less than 50% of the limits in Table 3 of IEEE Std 1547.—During the tests, the steady-state voltage of the simulated area EPS source shall not vary by more than ± 1% of the nominal voltage.—For voltage trip magnitude tests, the voltage change resolution of the simulated utility source shall be within 0.5a of the nominal voltage, where a is the manufacture’s stated accuracy.—For frequency trip magnitude tests, the frequency change resolution of the simulated utility source shall be within 0.5a of the nominal frequency, where a is the manufacture’s stated accuracy.。
第六讲-IEL-INSPEC-ACM-lNCS

图表说明
:直接在INSPEC查找文献; :查找JCT(Journal, Classification & Thesaurus); :回到选择直接进入INSPEC或JCT的页面; :查看本次登陆执行的检索命令,用户 LOGOFF后检索历史将清除,点击现在查询将重新查 看检索结果; :查看在线帮助; :退出系统
6.高级检索(Advanced) .高级检索(Advanced)
1) 在输入框内输入检索式 检索式构成: 检索词1 逻辑算符……检索词n <in> 字段名1,……字段名n 2) 选择限制条件*; 3) 点击"Start Search"按钮,开始检索; 4) 系统列出符合检索条件的文献,点击每篇文献 下方的[Abstract]或[PDF Full-Text]可浏览文摘 或原文; 注:(1) 逻辑算符:and(与),or(或),not (非) (2) 常用字段名:ab:文摘 au:作者 ct: 会议名称 is:期刊卷期号 jn:期刊名 cy: 会议日期 ti:文献标题 de:主题词
(3) 截词 *:表示任意个字符,如:electro* 可检索出 含electron,electrons,electronic,electronics, electromagnetic,electromechanical及electrolyte的文献. ?:表示一个字符,如:cable? 可检索出cables或 cabled的文献,但不包括cable(?必须是一个字符). *限制条件: 1) 文献类型:文献类型有三种,期刊,会议,标准,打 钩为选中,默认状态为全选. 2) 检索年限:根据需要选择起始,终止年限,默认状态 为1988年-present. 3) 检索结果排序:检索结果可按时间(Year),文献标题 (By Publication Title),相关度(Score)进行升降序排列. 4) 每页显示的文献数量可选择:15,25,50. 当查出的文献数量超过已定义的每页显示的文献数时, 可通过画面下方的数字及[Prev],[Next]按钮翻页.
IEL数据库

IEL和IEEE XploreIEEE/IEE Electronic Library (IEL) 数据库提供美国电气电子工程师学会(IEEE)和英国电气工程师学会(IEE)出版的205种期刊、6500余种会议录、1480余种标准的全文信息。
多数出版物提供1988年以后的全文数据,但有IEEE学会下属的13个技术学会的18种出版物可以看到更早的全文。
校园网的用户均可通过连接INTERNET访问美国IEL主页,采用IP地址限定用户范围,不需要帐号和口令。
电话拨号连接校园网的用户,请参见信息中心拨号连网说明。
由于数据库的并发用户数限制在15个,会出现“All available online seats are currently being occupied”的信息,并提示输入用户名和帐号。
请用户检索之后尽快退出,以便他人能够联通。
美国电气电子工程师学会(IEEE)和英国电气工程师学会(IEE)的电子期刊美国电气电子工程师学会(Institute of Electrical and Electronics Engineers,简称IEEE)和英国电气工程师学会(Institute of Elecrical Engineers,简称IEE)自1988年以来出版有100多种电子期刊,数据库名称为IEEE/IEE Electronic Library(简称IEL),系统名称为IEEE Xplore,主要涉及学科有计算机、电气电子、信息科学、物理学等。
IEL即The IEEE/IEE Electronic Library,它提供了可以获取当今世界上三分之一的关于电子工程和计算机科学文献之入口,这些文献都是来自the Institute of Electrical and Electronics Engineers (IEEE) 和the Institution of Electrical Engineers (IEE)..IEL包括的具体内容有:•IEEE和IEE的专业期刊、杂志、学报、以及会议论文,现行的IEEE标准-总超过一亿条的全文文档。
IEEE Xplore信息技术数据库用户指南说明书

Phone +1 800 701 IEEE (4333) (in the U.S.)+1 732 981 0060 (worldwide)***************************Aerospace and Defense Organizations Innovate with IEEE InformationWhether you’re researching biological and germ warfare, intelligence surveillance, sensor networks, or any other aerospace and defense technology, IEEE is your gateway to the most vital information in the industry today. With the intuitive IEEE Xplore ® digital library, you’ll find the journal articles, conference proceedings, and standards needed to lead aerospace and defense innovation.IEEE Information Drives Technology PatentsToday ’s aerospace and defense organizations deliver new patented technologies at an ever-increasing pace, based on research that is at the forefront of the industry. Organizations like Boeing, Raytheon, BAE, Honeywell, Harris, Airbus, and the U.S.Air Force all cite high proportions of IEEE literature in patents for new technology.Patent references to IEEE papers have increased 896% since 1997 and recent studies of the top patenting companies show that IEEE scientific and technical articles are cited over 3 times more often than any other publisher .Patent References from the Top 5 PublishersSource: 1790 Analytics LLC, Copyright 2016Essential IEEE Content in Aerospace and Defense TechnologyIEEE content remains crucial to the aerospace and defense industry —providing research in a wide variety of topics through the IEEE Xplore digital library.Biometrics/Biometry/Bioinformatics35,300+ documents Robot/Robotics 155,000+ documents Failure Analysis 24,000+ documents Systems Engineering22,100+ documents Autonomous/Unmanned Vehicles/Drone3,900+ documents Sensor Networks 29,400+ documents Remote Sensing 69,400+ documents Intelligent Agents 12,100+ documents Network Security12,500+ documents Avionics9,800+ documents Cloud Computing25,900+ documents Satellite Communications13,400+ documentsCounts are accurate as of March 2016 and include IEEE/IET content/innovate9 of the top 10 A e r o s p a c e a n d D e f e n s ePhone +1 800 701 IEEE (4333) (in the U.S.)+1 732 981 0060 (worldwide)***************************IEEE Leads Aerospace and DefenseIEEE enables innovation as a leading developer and producer of content across a wide range of industries, from standards to conferences, eBooks, and eLearning courses for aspiring individuals and growing organizations. Below is a sampling of IEEE content.Journals—IEEE Transactions on Aerospace and Electronic Systems — #2 in Aerospace Engineering—IEEE Aerospace and Electronic Systems Magazine —Journal of Lightwave Technology—IEEE Nanotechnology Magazine —IEEE Security & Privacy Magazine —IEEE Sensors Journal—IEEE Transactions on Vehicular TechnologySource: 2014 Thomson Reuters Journal Citation Reports, published June 2015ConferencesIEEE AUTOTESTCONIEEE Avionics, Fiber-Optics, and Photonics Technology Conference IEEE International Symposium on Phased Array Systems and Technology IEEE National Aerospace and Electronics Conference IEEE Radar ConferenceIEEE/AIAA Digital Avionics Systems ConferenceIntegrated Communications, Navigation, and Surveillance Conference International Conference on Recent Advances in Space Technologies International IEEE Conference on Microwaves, Communications, Antennas, and Electronic SystemsStandards1672 IEEE Standard for Ultrawideband Radar Definitions —Corrigendum 1 1554 IEEE Recommended Practice for Inertial Sensor Test Equipment, Instrumentation, Data Acquisition, and Analysis1293IEEE Standard Specification Format Guide and Test Procedure for Linear , Single-Axis, Nongyroscopic Accelerometers Corrigendum 1: Changes to Annex K and Annex L802 IEEE Standard for Local and Metropolitan Area Networks: Overview and Architecture671IEEE Standard Specification Format Guide and Test Procedure for Nongyroscopic Inertial Angular Sensors: Jerk, Acceleration, Velocity, and Displacement Corrigendum 1: 4.7.2.6 Short-Term Stability and Annex A Sensor Dynamic Block DiagramsFor more information about our content types, please visit /digitalsubscriptionsLearn which IEEE subscription option is right for your organization.Visit /innovateThe IEEE Xplore ® Digital LibraryFind a subscriptionthat’s right for you —from tailored journal collections A e r o s p a c e a n d D e f e n s e14-P I M -146a A 4 3/16。
IEEE standard definitions of terms for antennas 145-1993
The Institute of Electrical and Electronics Engineers, Inc. 345 East 47th Street, New York, NY 10017-2394, USA Copyright © 1993 by the Institute of Electrical and Electronics Engineers, Inc. All rights reserved. Published 1993. Printed in the United States of America ISBN 1-55937-317-2
IEEE Std 145-1993
(Revision of IEEE Std 145-1983)
IEEE Standard Definitions of Terms for Antennas
Sponsor
Antenna Standards Committee of the IEEE Antennas and Propagation Society
Approved March 18, 1993
IEEE Standards Board
Abstract: Definitions of terms in the field of antennas are provided. Keywords: antennas, definitions, propagation, terminology
IEEE Standards documents are adopted by the Institute of Electrical and Electronics Engineers without regard to whether their adoption may involve patents on articles, materials, or processes. Such adoption does not assume any liability to any patent owner, nor does it assume any obligation whatever to parties adopting the standards documents.
IEEE文献
Effective Wind Farm Sizing Method for Weak Power Systems Using Critical Modes of V oltage Instability Ala A.Tamimi,Member,IEEE,Anil Pahwa,Fellow,IEEE,and Shelli Starrett,Senior Member,IEEEAbstract—Current methods for determining wind farm max-imum sizes which do not consider voltage stability margins may result in reducing the overall levels of windin a system.In this paper,new methods have been developed to increase wind penetration level by placing new wind generation at voltage stability strong wind injection buses.Placing new generation at these buses has the least impact on not only in the vicinity of new wind generation,but also throughout the power system.The new methods provide a comprehensive methodology for the identification of system weaknesses for each wind penetration level.The new methods incorporate modal anal-ysis as well as traditional voltage stability methods(Q-V curves) in sizing and placing new wind farms.The study shows that the location of SVCs is also key to increasing wind penetration.Wind penetration can be increased when placing SVCs at the weakest buses in the system instead of only locating them at the wind generation buses.Index Terms—Modal analysis,Q-V curves,voltage collapse, voltage stability margin.I.I NTRODUCTIONV OLTAGE instability is characterized by a slow decrease in voltage levels at one or more buses in the power system. Both static and dynamic approaches can be used to study voltage stability limits[1]–[3].Since in most cases,voltage collapse progress slowly,practical voltage stability analysis can be ef-fectively analyzed using a static approach instead of a dynamic approach.Steady-state voltage stability analysis allows system planners to use readily available steady-state powerflow models to conduct voltage stability studies.V oltage stability margins can be calculated at any system operating point with a high degree of certainty when generation resources are available to meet load requirements [1],[2].However,when generation schedules change to accom-modate new wind power generation units in addition to meeting load demands,calculating becomes more complicated due to difficulties in predicting the output of wind generators. Several references have shown that an increase in wind pen-etration results in greater demands on reactive power,which ifManuscript received August09,2011;revised November11,2011;accepted December20,2011.Date of publication February06,2012;date of current ver-sion July18,2012.Paper no.TPWRS-00752-2011.A.A.Tamimi is with Sunflower Electric Power Corporation,Hays,KS67601 USA(e-mail:atamimi@sunfl).A.Pahwa and S.Starrett are with the Department of Electrical and Com-puter Engineering,Kansas State University,Manhattan,KS66506USA(e-mail: pahwa@;starret@).Color versions of one or more of thefigures in this paper are available online at .Digital Object Identifier10.1109/TPWRS.2011.2182527not met by the existing power system,may lead to voltage in-stability[2]–[8].With the increase of wind generation penetra-tion and their reactive power demand in power systems,voltage stability limitations are becoming one of the most limiting fac-tors in increasing wind generation penetration in power sys-tems.Maximum wind penetration levels depend on the avail-able of the existing power system[3]–[5]. Currently,there are three popular types of wind turbine gen-erators used in the wind turbine industry.These are:squirrel cage induction generators(SCIG),doubly-fed induction gener-ators(DFIG),and direct drive synchronous generators(DDSG) [9],[10].While less expensive,the SCIG wind turbines act as reactive power loads.The newer wind turbines with power elec-tronics can improve system voltage stability and allow for larger wind turbines to connect directly to weak power systems with minimal system reinforcements[6].Most of the current wind generation sizing methods are based on two main factors.Thefirst factor is the available wind re-sources at the wind generation site.The second factor is the available transmission capacity as determined by thermal limits at the point of interconnection between the wind generation and the transmission grid[5],[6].These two factors do not include the impact of new wind generation on the overall system which may result in limiting future wind development in other areas.In practice,many factors,including economics,politics,land-scape,ownership,right-of-way,and system operating concerns can influence the best location and size of wind farms.Although we have not explicitly addressed these issues,they can be in-cluded in the approach that we have presented,which could result in a sub-optimal solution.This paper presents an argu-ment and methods for including voltage stability concerns in the debate.The point is made that by including these system ef-fects early and systematically in the growth of wind power in a system,the overall result can result in more wind penetration. In recent papers[7]and[8],the authors of this paper de-veloped a voltage-stability-based method for sizing new wind farms in weak power systems.Reference[7]introduces an iterative method which can be used to determine wind farm maximum sizes(assuming location isfixed)while minimizing the negative impact on power system voltage stability margins .A new method for assessing the impact of increasing wind farm sizes above the maximum sizes found in[7]is presented in[8].This method assumes wind curtailment may be needed for critical conditions.This paper is a continuation to this previous work and it fo-cuses on using voltage stability analysis tools maximize wind penetration based on knowledge of reactive power resources.0885-8950/$31.00©2012IEEEFig.1.Q-V curve method with voltage stability regions identified.By carefully selecting wind injection sites away from buses strongly linked to critical voltage stability modes,the overall system wind penetration is increased due to preserving avail-able reactive power support.However,wind injection locations in any power system cannot be determined solely based on the voltage stability strength or on the available system reactive power margins.Thus,the results of this work represents one more factor to be considered in the selection and approval of wind farm sites and sizes.The paper is organized as follows.Section II presents two methods for measuring voltage stability for systems with high wind penetrations.New methods for sizing wind farms based on modes of voltage instability are presented in Section III. Sections IV and V present the simulation model formulation and simulation results,respectively.Finally,Section VI pro-vides conclusions and possible future work.II.V OLTAGE S TABILITY A SSESSMENTThe Q-V curve method and the voltage stability modal method are the two methods used in this paper to mea-sure voltage stability[11]–[13]for systems with high wind penetration.The Q-V method has the advantage of simple implementation with powerflow software,while the advan-tage of modal analysis is its system-wide viewpoint.A brief description of both methods follows.A.Q-V Curve MethodThe Q-V curve method has been described in[2]and[3].This method can be used to measure a at any bus in the power system.The at any bus is defined as the distance from the bottom of the Q-V curve(the critical point)to the zero reactive power injection point(current load point)as shown in Fig.1. Basically the Q-V curve VSM is the largest reactive power load that can be added at the bus of interest without the system be-coming unstable.B.Voltage Stability Modal Analysis MethodV oltage stability assessment using modal analysis has been described in[2],[3],and[13].The most general algorithm to solve the powerflow program is the Newton-Raphson method which involves iteration using thefirst term of a Taylor se-ries.The Newton-Raphson method solves the partitioned matrix equation shown in the following:(1) where is the change in real power,is the change in reac-tive power,is the unknown voltage magnitude,the voltage angle is denoted by,and is the Jacobian matrix which consists of partial derivatives terms.By expanding the Jacobian matrix a full matrix equation can be written for the general al-gorithm to solve powerflow as shown in(2):(2) When the focus in solving the powerflow is reactive power by letting,(2)can be written as(3) Solving for(4) From Equation(6.2),solving for and substituting for gives(5)(6) From Equation(6.5)(7) The modes of instability can be defined by the eigenvalues and eigenvectors of.Assuming whereright eigenvector matrix of;diagonal eigenvalue matrix of;left eigenvector matrix of.Taking the inverse of both sides for results in(8) Substituting for from(8)in(7)results in(9):(9) Equation(9)can be written(10)where corresponds to each th mode of stability.Let be the th eigenvalue of,be the th column right eigenvector of ,and be the th row left eigenvector of.The relationship between the eigenvalues and voltage sta-bility can be seen from(10).The sensitivity of V-Q at each bus in the system is related to the eigenvalues of the system.Ifis positive,system is voltage stable since changes in system re-active power result in positive changes in modal voltage.When magnitude becomes close to zero,any changes in reactive power produce large changes in bus voltage.If the magnitude of is equal to zero,the system is on the verge of voltage insta-bility and voltage collapse may occur.If is negative,system is voltage unstable since changes in system reactive power re-sult in negative changes in modal voltage.Bus participation factor for bus j can be written as[2](11) The magnitude of determines if bus contributes signifi-cantly to mode of instability.III.N EW M ETHOD FOR S IZING W IND F ARMS B ASED ON C RITICAL M ODES OF V OLTAGE I NSTABILITYA new method is developed and presented in this section for maximizing wind farm sizes in weak power systems using modes of voltage instability.The introduction of large amounts of wind generation has the potential to change the modes of in-stability in power systems.Placing new wind farms at locations with high contributions to voltage instability can result in lim-iting wind penetrations.It is assumed that wind injection sites considered have similar wind patterns and similar transmission interconnection facilities.If desired,the list of potential sites (buses)could be developed based on other considerations,and then this analysis could be used to select the most favorable of those sites.This method performs wind farm sizing using voltage stability methods.The proposed method is summarized in the following steps.1)From the available seasonal loadflow cases,select the peakload powerflow case as the base case before wind injec-tion.The peak load powerflow case is the case which in-cludes the peak load month.2)Specify proposed wind injection buses and maximum windinjection desired.Wind is to be injected from these buses based on their contribution to voltage insta-bility modes and their available.3)Rank all of the proposed wind injection buses based ontheir contribution to voltage instability modes using modal analysis.Modal analysis can be used to calculate bus par-ticipation factors(eigenvectors)for modes of instability at each wind penetration e the results of the modal analysis to determine which of the proposed wind injec-tion buses has high contribution to modes of instability (weak buses for wind injection).Buses with low contri-bution to modes of instability are considered strong wind injection buses.A strong wind injection bus has a partici-pation factor value near zero.4)Perform Q-V curve analysis to compute at thebuses identified as weak and strong buses for wind in-jection.This analysis is required to verify modal analysis results.5)Compare the wind injection bus ranking results using(3)and(4)and select strong buses to install new wind farms.Only buses with high ranking in both methods are selected.A wind injection bus which has high ranking in the Q-Vcurve method but low ranking in the modal method will not be selected as a strong wind injection bus.If the modal ranking results do not agree with the Q-V ranking,it in-dicate that the system is stressed and calculated using the Q-V curve method are too close to be used in the ranking.6)Specify the type of wind turbines to be used(SCIG,DFIG,or DDSG)and construct the wind farm power curve for each wind injection bus.A wind farm power curve(wind speed versus active power and wind speed versus reactive power)is generated based on the wind turbines manufac-ture data and[16].7)Uniformly increase wind farm sizes from all of the strongbuses until reaching the maximum wind penetration level without any system enhancements.For each incremental increase in wind generation,perform modal and Q-V curve analysis to determine if significant change has occurred to the voltage instability modes.If no significant changes, continue increasing the wind generation until reaching the collapse point.The maximum wind generation level right before reaching the collapse point sets the maximum size of the wind farms.8)To further increase wind penetration levels to meet themaximum desired level,a gradually increase of wind farm maximum sizes is necessary.However,further size increases will result in voltage collapse.In this step,wind farm maximum sizes are increased gradually above their maximum values found in(7)while adding SVCs as nec-essary to prevent voltage instability.From the last modal analysis performed in(7),determine the best location and the size of SVCs needed for a further increase in wind farm sizes.The effectiveness of SVC location is evaluated according to the resulting improvement in system margins and hence increasing wind farm sizes.Different SVC locations yield different VSM improvements[17].SVCs should be placed at the most participating bus to modes of instability at every wind penetration level.9)After adding thefirst set of SVCs in step(8),increase windfarm maximum sizes until reaching the desired wind pene-tration level or the collapse point.If the collapse point oc-curs before reaching the desired penetration level,a second set of SVCs is placed at the weakest bus found using modal analysis.The second set of SVCs is determined by per-forming modal analysis near the collapse point to identify best buses for the second set of SVCs.The process is re-peated until reaching the desired wind penetration level. The process involved in sizing new wind farms based on crit-ical modes of voltage instability for steps1through7is shown in Fig.2.A secondflow chart shown in Fig.3is for steps8and 9.These steps are necessary when the desired maximum windFig.2.Flow chart of steps 1through 7for sizing new wind farms based on critical modes of voltage instability.injection levels cannot be reached without the installation of ad-ditional voltage support equipment installed.IV .S IMULATION M ODEL F ORMULATIONThe western Kansas region has been characterized as one of the best wind power resources in the USA [14].However,western Kansas power system is a weak power system charac-terized by long,high impedance and low capacity transmissionlines.Fig.3.Flow chart of steps 8and 9for using SVCs to increase wind penetration.The western Kansas power system consist of 300buses of interconnected system with five transmission voltage levels,speci fically 69kV ,115kV ,138kV ,230kV ,and 345kV and 12conventional generation units.The western Kansas region is part of Southwest Power Pool (SPP).The western Kansas 2010peak July load was 1200MW.This load is served from 12conventional generation units with the largest unit is a coal power plant located in Holcomb,Kansas.The proposed method for sizing wind farms has been applied to the power system in western Kansas and results are shown in the next section.The study identi fies six possible buses for wind power injection into the western Kansas power system.All six locations have similar transmission connection facilities at the 115-kV voltage level.The six buses are referred to in this study by bus numbers.Fig.4.Participation factors for mode of instability before wind injections Bus numbers95,105,110,115,119,and123are the buses in the power system were wind generation can be injected from. The six locations are located far from each other.It is assumed that wind speed patterns in all of the six locations are similar due toflat terrain in the western Kansas area[14].The PSS/E software package,version32was used for loadflow analysis and to generate Q-V curves to calculate[15].The modal analysis is done using a simplified system with a tool box in Matlab[16].Due to space limitation,only the DFIG type of wind farm is analyzed in this paper.Each wind farm is modeled as seen from the system.The individual wind turbines are lumped in to equivalent wind turbines represented at the collector bus where the wind farm interconnect the transmission system.This level of modeling is used in power system studies where the focus of the study is the effect of wind injection on system voltage stability and internal wind farm conditions do not need to be determined[17],[18].V.S IMULATION R ESULTSIn order to assess the impact of wind injections,modal and Q-V curve analysis was performed for different wind injection scenarios.Modal and Q-V analysis were conducted for each wind level.Modal eigenvalue,bus particptaion factors and Q-V curve were calculated for each wind penetration level.A.Case I:Base Case—No Wind InjectionModal analysis was performed on the2010peak July load case before any new wind injections to determine best buses to start injecting wind generation.Results of the modal analysis indicated that the system is voltage stable with the most critical eigenvalue0and the highest participa-tion factor at bus number95.Due to its high participation in the mode of instability“”,bus95is considered a weak bus for wind injection.All other normalized bus participation factors to are shown in Fig.4and a list of the normalized participation factors are shown in Table I.Buses105,110,and119had no participation in,and they are considered strong buses for wind injections.However,buses 95,115,and123have significantly high participation in,and they are considered weak buses for wind injections.As shown inR ANKING AND C LASSIFICATION OF THE P ROPOSED B USES B ASED ON T HEIR P ARTICIPATION TO M ODE OF I NSTABILITY B EFORE W IND INJECTIONSTABLE IIM AXIMUM W IND I NJECTION P ER B US B EFORER EACHING THE C OLLAPSE POINTTable I and with no wind injections,results of the classification of the six buses as strong or weak for wind injections obtained using modal analysis and using Q-V curve method are identical.B.Case II:Wind Injected From Each Individual BusIn this case,wind was injected from each of the six buses sep-arately.This is done to verify that ranking buses based on the maximum amount of wind injections from each bus is incon-sistent with the bus ranking for wind injection obtained using modal analysis and the Q-V curve method.1)Calculations for the maximum wind injection levels fromeach bus.The maximum wind injections per bus are cal-culated using modal analysis and a summary of the results is shown in Table II.Wind was injected from each bus in increments until reaching the collapse point.To determine the maximum wind injection right before reaching the col-lapse point,the wind injection value at which the system collapse was reduced by1-MW increments and powerflow is solved repeatedly until reaching a stable solution.The first maximum wind injection value at which the system reaches a stable solution is the maximum value of wind in-jection reported in Table II.Buses which were classified by the modal and the Q-V analysis as weak buses resulted in significantly lower maximum wind injections.The highest wind injection was156MW from bus105and the lowest was45MW from bus95.2)Calculations of the eigenvalues using modal analysis.Forevery wind injection level,modal analysis was performedFig.5.Impact on eigenvalues “”of increasing wind injection from each of the weakbuses.Fig.6.Impact on eigenvalues “”of increasing wind injection from each of the strong buses.after each wind increase and modes of voltage instability (eigenvalues)are determined to evaluate if the system stays voltage stable after each wind injection increase.Results of the modal analysis of the impact on system eigenvalues after each increase of wind generation from the weak buses are shown in Fig.5.Results show that system eigenvalues were very sensitive to the amount of wind injected from the weak buses.When the weak buses wind injection level was lower than 2/3of the maximum wind injection values shown in Table II,eigenvalues became more positive and hence system voltage stability had improved.This is due to the fact that at low wind penetration the reactive power re-quired to deliver the small amount of wind to the load was available and system was strong to absorb this wind levels.However,when the wind injected levels exceeded 2/3of the maximum wind injection limit,system critical eigen-values has decreased and the system became less stable due to lack of reactive power support.Increasing wind injection from the strong buses had no sig-ni ficant impact on the system critical eigenvalues.System eigenvalues were not sensitive to increasing wind injection from these buses until the system was operated very close the collapse point as shown in Fig.6.3)Calculations of the participation factors using modal analysis.Table III shows the system participation factors (eigenvector)for all buses as wind injection gradually increased from each wind injection bus.From the results shown in Table III,as wind injections increased from the weak buses,the bus with most contribution to instability modes did not change.4)Calculation of the impact of increasing wind injections on VSMs using Q-V curve method.Results of the Q-V curve analysis showed that the system are impacted by increases in wind injection from both weak and strong buses.versus wind injection levels from all of theB US P ARTICIPATION F ACTORS FOR A LL S IX B USES AS W INDI NJECTION G RADUALLY I NCREASED F ROM E ACH BUSFig.7.Impact on voltage stability marginsof increasing wind injec-tions using the Q-V curve method.TABLE IVM AXIMUM W IND I NJECTIONS IN MW FOR C OMBINED W IND I NJECTION CASEbuses considered in this study are shown in Fig.7.From Fig.7,the Q-V curve bus ranking was exactly in the same order as the modal analysis ranking shown in Table II.C.Case III:Combined Bus Wind InjectionCombined wind injection from the top three ranked buses (strong buses)and the lower three buses (weak buses)has been investigated.Several combinations of wind injections have been analyzed using modal analysis to calculate maximum wind in-jection before reaching the collapse point.For each combina-tion,wind power was injected equally from each bus in the com-bination.Each combination of wind injections and their max-imum wind injection results are provided in Table IV.Fig.8.Impact on system eigenvalues of increasing wind injections from the combination of the three strong and three weakbuses.Fig.9.Impact on voltage stability margins of increasing wind injec-tions from the combination of the three and three weak buses.Results of the analysis indicated that the strong bus combi-nations resulted in signi ficantly higher wind injections than the weak bus combinations.For the strong bus combinations,the highest wind injection was 321MW using all three strong buses.The impact on system eigenvalues “”of increasing wind injec-tions from the combined three-bus wind injection scenarios are shown in Fig.8.The impact of combining wind injections on the systemhas been analyzed for both of the combined threestrong and three weak buses.Wind injection increases using the three strong buses had no signi ficant impact onuntil the combined strong bus wind injection exceeded 300MW as indicated by results of the Q-V curve analysis shown in Fig.9.were signi ficantly impacted when the combined weak bus wind injection exceeded 60MW as shown in Fig.9.This con firms the maximum wind injection results found using modal analysis for the combined wind injection scenarios.D.Case IV:Increasing Wind Penetration Using Static Var Compensators (SVCs)From the 3-Bus Strong and Weak Combined CasesModal analysis was used to determine best location for adding shunt compensation to increase wind penetration above the maximum of 321MW found using the 3-strong bus com-bined wind injection scenario.The desired maximum wind generated from the combined bus is 410MW.This will provide a wind penetration of approximately 35%of the peak system load.Two methods have been used to locate new SVCs for in-creasing wind penetration.The first method (Method I)is to place SVCs only at the wind injection sites which have the highest contribution to instability modes.The second methodL OCATING NEW SVCs TO I NCREASE W IND P ENETRATION (M ETHODI)TABLE VIL OCATING N EW SVC S TO I NCREASE W IND P ENETRATION (M ETHODII)(Method II)was to place SVCs at the buses with the highest contribution factors to instability modes.The modal analysis process and the results for the first SVC placement method (Method I)are shown in Table V.After adding the first 25-Mvar SVC at bus 119in iteration 1,modal analysis resulted in unstable solution.In the second iteration a second 25-Mvar SVC was added to bus 119but modal analysis resulted in unstable solution.Steps are repeated for the next increase of wind injections from300MW to360MW.To reach the desired maximum wind in-jection of“MW”,it required the installation of 225Mvar of SVCs as shown in Table V.The second method for locating new SVCs was to place them at buses which have the highest participation factors to modes of instability regardless if they were a wind injection buses or not. Table VI is a summary of the modal analysis used to place new SVCs to reach the410MW of wind injection using Method II.VI.C ONCLUSIONSThis paper has shown that,if new wind farms are placed at buses with low contribution to modes of instability,system wind penetration can be increased without using additional voltage support equipment.The paper also describes a comprehensive methodology using the modal and the Q-V curve analysis for the identification of system weaknesses in a systematic manner, which is both theoretically sound and validated with practical real power system.The paper also presented two methods for increasing wind penetration levels by placing voltage support equipment like SVCs.SVCs where used to improve critical modes of voltage instability at high wind penetration levels.The location of SVCs was a key to increasing wind penetration.Placing SVCs at the weakest buses in the system instead of the wind genera-tion buses provided the most effective wind penetration.R EFERENCES[1]Transmission Reliability Evaluation of Large-Scale Systems(TRELSS),EPRI research Project3833-1,Oct.1994,Final Rep.[2]B.Gao,G.K.Morrison,and P.Kundur,“V oltage stability evalua-tion using modal analysis,”IEEE Trans.Power Syst.,vol.7,no.4,pp.1529–1542,Nov.1992.[3]C.Taylor,Power System Voltage Stability.New York:McGraw-Hill,1994.[4]N.T.Linh and T.T.Chuong,“V oltage stability analysis of gridsconnected wind generators,”in Proc.4th IEEE Conf.IndustrialElectronics and Applications(ICIEA2009),May25–27,2009,pp.2657–2660.0.[5]G.Coath and M.Al-Dabbagh,Effect of Steady State Wind TurbineGenerator Models on Power Flow Convergence and V oltage Sta-bility Limit.[Online].Available:.au/~aupec/aupec05/AUPEC2005/V olume1/S113.[6]M.Chinchilla,S.Arnalte,J.C.Burgos,and J.L.Rodrigues,“Powerlimits of grid-connected modern wind energy system,”Renew.Energy,pp.1455–1470,Sep.2005.[7]A.A.Tamimi,A.Pahwa,S.Starrett,and N.Williams,“Maximizingwind penetration using voltage stability based methods for sizing andlocating new wind farms in power system,”presented at the2010IEEE/PES General Meeting,Minneapolis,MN,Jul.2010,Paper20105590060.[8]A.A.Tamimi,A.Pahwa,and S.Starrett,“Method for assessing systemimpact of increasing wind farm sizes above their maximum limits,”presented at the IEEE2011PES General Conf.,Detroit,MI,acceptedfor publication.[9]GE Energy,Modeling of GE Wind Turbine-Generators for GridStudies,ver.3.4b,Mar.2005.[10]Y.A.Kazachkov,J.W.Feltes,and R.Zavadil,“Modeling wind farmsfor power system stability studies,”in Proc.2003IEEE/PES GeneralMeeting,Paper Print0-7803-7989-6.[11]M.K.Pal,“V oltage stability:Analysis needs,modeling requirementand modeling adequacy,”Proc.Inst.Elect.Eng.,C,vol.140,no.4,pp.279–286,Jul.1993.[12]B.Gao,G.K.Morison,and P.Kundur,“Towards the developmentof systematic approach for voltage stability assessment of large-scalepower systems,”presented at the IEEE/PES Summer Meeting,Jul.23–27,1995,paper95SM526-4PWRS.[13]P.Kundur,Power System Stability and Control.New York:Mc-Graw-Hill,1994.[14]Kansas Energy Information Network October2009.[Online].Avail-able:/.[15]PSS/E Program,ver.31,Siemens Power Transmission&Distribu-tion,Inc.,Power Technologies International(PTI).[Online].Available:/pti/software/.[16]Matlab,The MathWorks,Inc.[Online].Available:http://www.math-\.[17]S.K.Salman and A.L.J.Teo,“Windmill modeling consideration andfactors influencing the stability of a grid-connected wind power-basedembedded generator,”IEEE Trans.Power Syst.,vol.18,no.2,pp.793–802,May2003.[18]CIGRE Technical Brochure on Modeling the Dynamic Behavior ofWind Generation as it Relates to Power System Control and DynamicPerformance,Working Group01,Advisory Group6,Study CommetteeC4,Draft Rep.,Aug.2006.Ala A.Tamimi(M’11)received the B.S.degree in electrical engineering from Jordan University of Science and Technology,Irbid,in1990,the M.S.degree in electrical engineering from Wichita State University,Wichita,KS,in1993, and the Ph.D.degree in electrical engineering from Kansas State University, Manhattan,KS,in2011.Since2001,he has been employed with Sunflower Electric Power Corpo-ration,Hays,KS,where presently he is Transmission&Distribution Planning Engineering Supervisor.Dr.Tamimi is a member of Southwest Power Pool Economic Study Working Group and Transmission Working Group,Phi Kappa Phi,and the Golden Key International Honor Society.He has been a registered Professional Engineer in the State of Kansas since2005.Anil Pahwa(M’78–F’03)received the B.E.(honors)degree in electrical en-gineering from Birla Institute of Technology&Science,Pilani,India,in1975, the M.S.degree in electrical engineering from University of Maine,Orono,in 1979,and the Ph.D.degree in electrical engineering from Texas A&M Univer-sity,College Station,in1983.Since1983,he has been with Kansas State University,Manhattan,where presently he is Professor in the Electrical and Computer Engineering Depart-ment.Shelli Starrett(SM’08)received the B.S.and M.S.degrees from the University of Missouri,Rolla,in1988and1990,respectively,and the Ph.D.degree from Iowa State University,Ames,in1994.She joined the Faculty of Electrical Engineering at Kansas State University, Manhattan,in1994,where she is an Associate Professor.。
文献管理软件EndNote入门(论文写作必备)
在电脑上选择分区和文件夹
命名自己的library
将已下载的全文导入到EN
在本地模式或混合模式下,选中 mygroup,鼠标右键,新建group
EN的group set是顶层文件夹 类似于NE的“数据库” 但EN的group set下只能建立一级 子文件夹(即group) group下是不支持建子文件夹。
为什么是RIS?
• RIS后缀的文件示例2
• • • • • • • • • • • • • • • • • TY - JOUR ID - TN_cqvip11141483 T1 - —个基于组件技术的分布式知识发现系统设计 AU - 张晓刚 N2 - 提出了一个基于组件技术的可扩展性的分布式知识发现系统设计框架。 KW - 组件技术 KW - 知识发现系统 KW - 分布式 KW - 数据挖掘 JF - 湖北成人教育学院学报 VL - 9 IS - 5 SP - 50 EP - 51 SN - 1673-3878 A1 - 张晓刚 ER -
•
•
科睿唯安于1995年发布了windows版本。
此后的二十多年间,历经二十余次大版本更新,EN的功能越来越完善,软件的稳定性也越来越高, 目前已经成为世界范围内毫无争议的最主流的文献管理软件。EN在国内的主要用户有中科院、清华、 北大等科研院校。
• • • •
目前最新版的EN是2018年8月发布的X9(我馆购买了X8和X9) X9个人版售价为$299,国内代理商售价为¥1818。 我管购买的免费版下载地址:需使用校园网 图书馆主页外文数据库A-Z 翻到第二页 EndNote单机版文献管理软件 使用说明:在endnote界面,按F1,或者menuhelponline user guided
IEEEIEEELECTRONICLIBRARY(IEL)简介及使用指南
FIND A OR B NOT C
检索举例
假设您想查找一份由F.Leonard撰写,标题为 “First-Order Optimal Reduced Delay Sample-Data Holds”,刊载在IEEE Transactions on Automatic Control 1999年7 月号的文章,可以输入以下检索条件: “sample data holds” in: “Title” “And” “automatic control” in:”Journal Name” “And” “Leonard” in “Author”
数据库简介
IEL涵盖学科及领域: ◆电工 ◆电子 ◆计算机科学 ◆电信 ◆微电子 ◆光学 ◆自动化 ◆声学 ◆信息系统 ◆商业 ◆专业通讯 ◆量子电子 ◆医学成像 ◆土木工程 ◆物理 ◆遥感
◆计算机工程
◆航空航天 ◆机器人
◆工业工程
◆控制论 ◆等离子科学 ◆生物医学工程 ◆运输
……
数据库简介
其中在计算机、自动化及控制系统、工 程、机器人技术、电信、运输科技、声 学、纳米、新材料、应用物理、生物医 学工程、能源、教育、核科技、遥感等 许多专业领域位居世界第一或前列。 IEL的用户遍布全球,世界排名前列的 半导体公司、计算机公司、航空公司、 电子公司和电信公司以及22家全美排名 前25的工程学院都采用了IEL。
数据库简介
包括从1988年以来的文摘和全文以及精选的 自1950年出版的IEEE期刊, 学报和杂志, IEEE会议录,IEE期刊,IEE会议录以及当前 的IEEE标准 。 IEL更新速度很快,一般每周更新一次,每月 增加25,000余篇最新文献。而且,每年IEEE 还会有新的出版物加入到IEL中去。 用户通过检索可以浏览、下载或打印与原出 版物版面完全相同的文字、图表、图像和照 片的全文信息。
pdf文献阅读
pdf文献阅读
PDF文献阅读是指通过阅读和分析PDF格式的学术文献来获
取相关知识。
下面是一些进行PDF文献阅读的步骤:
1. 确定研究主题:根据自己的需求和兴趣,确定所要阅读的文献的研究领域和主题。
2. 检索文献:通过学术搜索引擎(如Google学术、PubMed等)或学术数据库(如Web of Science、IEEE Xplore等)搜索相关的文献。
使用关键词和筛选条件来缩小搜索范围。
3. 选择文献:根据摘要和标题预览,选择与自己研究主题相关且具有可信度的文献。
4. 下载文献:下载选定的文献,并保存为PDF格式。
5. 阅读文献:打开PDF文献,开始阅读。
可以使用PDF阅读
器(如Adobe Acrobat Reader、Foxit Reader等)来方便地进行
注释、高亮、书签等操作。
6. 精读与略读:根据需要,对文献进行精读或略读。
精读是指认真阅读整篇文献并理解其内容,略读是指快速阅读文献的关键部分,获取基本信息。
7. 笔记与总结:在阅读过程中,做好笔记记录关键点、重要观点、研究方法、实验结果等。
阅读完一篇文献后,总结文献的主要内容和结论。
8. 查找引用文献:如果文献中有引用其他相关文献的地方,可以通过查找引文来进一步获取相关文献。
9. 交流和讨论:通过参加学术会议、写作论文或与同行交流等方式,与其他研究者讨论和分享所阅读的文献,获得更多的见解和反馈。
10. 整理与归档:将阅读过的文献整理归档,以备将来阅读和引用使用。
以上是进行PDF文献阅读的一般步骤,但具体的阅读方法和技巧因个人而异,可以根据个人需求和习惯进行调整和优化。