Reliability-based service life prediction of existing concrete structures under marine environment
【风力发电机齿轮箱可靠性优化设计文献综述4200字】

风力发电机齿轮箱可靠性优化设计文献综述【可参考以下写作提纲】1.前言(简要说明阅读文献背景、目的和范围以及选题的发展现状及争论焦点,不少于800字)随着社会经济的不断发展,人们对能源的需求也越来越大,而不可再生资源在不断消耗,寻求新的可再生资源成为当务之急。
至此,风力发电机应运而生,其装机灵活、基建周期短、环境效益高的诸多优点,促使风力发电成为国家新能源开发的关键技术[1]。
“中国制造2025”新能源装备实施方案指出,要在2025 年前,新能源装备制造业形成完善的产业体系,有效支撑新能源发展[2]。
世界风能协会(World Wind Energy Association, WWEA)统计,截止到2019 年底,全球安装的所有风力发电机的总容量达到6508GW。
2019年增加了59667MW,所有已安装的风力发电机可以满足全球6%以上的电力需求。
中国和美国都表现出强劲的增长势头,分别有275GW 和91GW 的新装机容量,均为近五年来最大的市场容量。
在取得令世界瞩目成绩的同时,也必须正视中国风电产业快速发展过程中所面临的各种问题。
风力发电机一般安装在偏远的户外或者海上,长时间在数十米高空服役,长期运行在振动、潮湿、沙尘、腐蚀、变速、制动等复杂恶劣环境中,各类故障频发且难以提前预警,带病运行将导致设备损坏、风场停机,维护维修成本提高[3]。
风力发电机运行在复杂的环境中,包括多套复杂的子系统。
齿轮箱是风力发电机实现增速的关键子系统,其健康运行关系着风力发电机的健康状态。
齿轮箱内部结构复杂,由多组齿轮、轴承、齿轮轴及润滑冷却系统组成,长期受到交变载荷、冲击载荷的作用,齿轮箱在恶劣的环境下运行,容易发生故障[4]。
目前,大型风力发电机的设计寿命要求不低于20 年,机组的年可利用率不小于97%[5]。
齿轮箱是风力发电机实现增速功能的关键所在,齿轮箱的寿命直接影响着风力发电机的寿命,齿轮箱能安全可靠的运行是风力发电机可靠的必要条件。
不同高温条件下中性斯蒂芬酸铅的寿命预测

第19卷 第2期 装 备 环 境 工 程2022年2月EQUIPMENT ENVIRONMENTAL ENGINEERING ·27·收稿日期:2022-01-14;修订日期:2022-01-26 Received :2022-01-14;Revised :2022-01-26作者简介:牛磊(1993—),男,博士研究生,主要研究方向武器装备可靠性分析与寿命评估。
Biography :NIU Lei (1993—), Male, Doctoral candidate, Research focus: reliability analysis and life evaluation of weapon equipment. 通讯作者:董海平(1969—),男,博士,副教授,主要研究方向武器装备可靠性技术。
Corresponding author :DONG Hai-ping (1969—), Male, Doctor, Associate professor, Research focus: weapon equipment reliability techno-logy.引文格式:牛磊, 董海平, 叶耀坤, 等. 不同高温条件下中性斯蒂芬酸铅的寿命预测[J]. 装备环境工程, 2022, 19(2): 027-032.NIU Lei, DONG Hai-ping, YE Yao-kun, et al. Life Prediction of Neutral Lead Styphnate under Different High Temperature Conditions[J]. Equipment Environmental Engineering, 2022, 19(2): 027-032.不同高温条件下中性斯蒂芬酸铅的寿命预测牛磊1,董海平1,叶耀坤2,吕智星3,高鑫4,张楠4,杨立欣5,严楠1(1.北京理工大学 爆炸科学与技术国家重点实验室,北京 100081;2.北京空间飞行器总体设计部, 北京 100049;3.中国兵器工业火炸药工程与安全技术研究院,北京 100053;4.辽宁北方华丰特种化工有限公司,辽宁 抚顺 113000;5.北京空间机电研究所,北京 100094)摘要:目的 获得中性斯蒂酚酸铅(N-LTNR )在不同高温条件下的贮存寿命,建立一种基于N-LTNR 表观活化能和某恒定温度加速性能退化试验的贮存寿命预测模型。
Life-365 Service Life Prediction Model
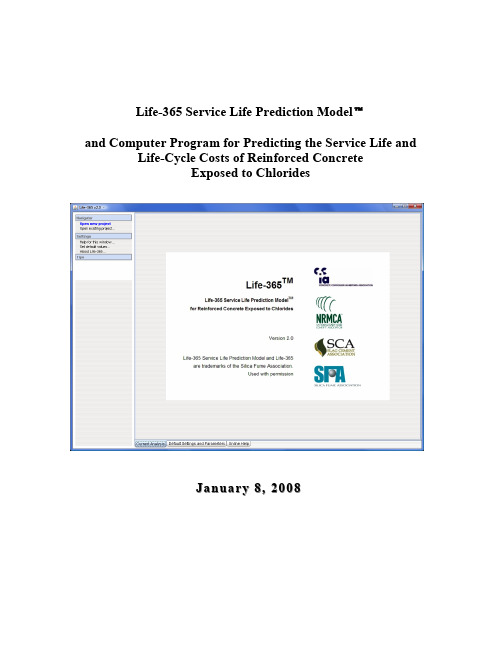
Life-365 Service Life Prediction Modeland Computer Program for Predicting the Service Life and Life-Cycle Costs of Reinforced ConcreteExposed to ChloridesJanuary8,2008Life-365TM CreditsThe previous Life-365 v1.0 program and manual were written by E. C. Bentz and M. D.A. Thomas under contract to the Life-365 Consortium I, which consisted of W. R. Grace Construction Products, Master Builders, and the Silica Fume Association. The Life-365 v2.0 program and manual are adaptations of these, and were written by M. A. Ehlen under contract to the Life-365 Consortium II, which consists of the Concrete Corrosion Inhibitors Association, the National Ready Mix Concrete Association, the Slag Cement Association, and the Silica Fume Association.“Life-365 Service Life Prediction Model” and “Life-365” are trademarks of the Silica Fume Association. These trademarks are used with permission in the program and in this manual.Table of Contents1 Introduction 62 Life-365 Model Description 82.1 Predicting the Initiation Period 82.1.1 Predicting Chloride Ingress due to Diffusion 82.1.2 Input Parameters for Predicting the Initiation Period 92.1.3 Solution Procedure 142.2 Predicting the Propagation Period 152.3 Repair Schedule 152.4 Probabilistic Predictions of Initiation Period 152.5 Estimating Life-Cycle Costs 162.6 Calculating Life-Cycle Costs 163 Life-365 Users Manual 173.1 Installing Life-365 v2.0 173.2 Starting Life-365 173.3 Project Tab 193.4 Exposure Tab 203.5 Concrete Mixes 223.6 Individual Costs 263.7 Life-Cycle Costs 273.8 Service Life and Life-Cycle Cost Reports 313.9 Supporting Features 323.9.1 Default Settings and Parameters 323.9.2 Online Help 333.10 Advanced Analysis: Service Life Uncertainty 343.11 Special Applications 393.11.1 Epoxy-Coated Rebars for the Top Reinforcing Only 394 Life-365 Background Information 414.1 Service-Life Estimate 414.1.1 Initiation Period 424.2 Input Parameters for Calculating the Service Life (Time to First Repair) 434.2.1 Surface Concentration 454.2.2 Diffusion Coefficient 474.2.3 Diffusion Decay Index (m) 504.2.4 Chloride Threshold 534.2.5 Propagation Period 544.2.6 Temperature 554.3 Input Parameters for Calculating Life-cycle costs 554.4 Summary 55 References 57 Appendix A. Test Protocols for Life-365 Input Parameters 61List of FiguresFigure 1. Examples of Concrete Surface History and Environmental Temperatures (10)Figure 2. Relationship Between D28 and w/c (11)Figure 3. Effect of Silica Fume on D SF (11)Figure 4. Effects of Fly Ash and Slag on D t (12)Figure 5. Effects of Membranes and Sealers (14)Figure 6. Startup Screen (18)Figure 7. Project Tab (19)Figure 8. Exposure Tab (21)Figure 9. Concrete Mixes Tab (22)Figure 10. Service Lives Tab (24)Figure 11. Cross-section Tab (24)Figure 12. Concrete Initiation Graphs (25)Figure 13. Concrete Characteristics Tab (25)Figure 14. Individual Costs Tab (26)Figure 15. Default Concrete and Repair Costs (26)Figure 16. Life-Cycle Costs Tab (28)Figure 17. Life-Cycle Costs: Timelines Tab (29)Figure 18. Life-Cycle Costs: Sensitivity Analysis Tab (30)Figure 19. Service Life (SL) Report (31)Figure 20. LCC Report (32)Figure 21. Default Settings and Parameters Tab (33)Figure 22. Online Help (34)Figure 23. Concrete Mixes Tab: Initiation Time Uncertainty Tab (35)Figure 24. Uncertainty Prompt (36)Figure 25. Probability of Service Life Years, by Year (36)Figure 26. Cumulative Probability of Service Life, by Year (37)Figure 27. Life-cycle Costs Tab with Modify Uncertainty Panel (38)Figure 28. Modify Uncertainty Panel (39)Figure 29. Default and Modified Steel Costs for Hybrid Epoxy/Black Steel Slab (40)Figure 30. Components of Concrete Service Life (41)Figure 31. Chloride Levels, by Region of North America (46)Figure 32. Effects of w/cm on Diffusion Coefficient (48)Figure 33. Effects of Silica Fume on Diffusion Coefficient (49)Figure 34. Effects of Age on Diffusivity (52)List of TablesTable 1. Effects of Slag and Fly Ash on Diffusion Coefficients (12)Table 2. Effects of CNI on Threshold (13)Table 3. Build-up Rates and Maximum %, Various Chloride Zones (45)Table 4. Build-up Rates and Maximum %, by Structure Type (47)Table 5. Values of m, Various Concrete Mixes (50)Table 6. Doses and Thresholds, Various Inhibitors (54)Table 7. Model Inputs and Test Conditions (67)Life-365 DisclaimerThis Computer Program and accompanying Manual are intended for guidance in planning and designing concrete construction exposed to chlorides in service. These items are intended for the use of individuals who are competent to evaluate the significance and limitations of their content and recommendations and who will accept responsibility for the application of the material it contains. The members of the consortium responsible for the development of these materials shall not be liable for any loss or damage arising there from.Performance data included in the Computer Program and the Manual are derived from publications in the concrete literature and from manufacturers’ product literature. Specific products are referenced for informational purposes only.Users are urged to thoroughly read this Manual to understand the capabilities and limitations of the Computer Program.1IntroductionThe corrosion of embedded steel reinforcement in concrete due to the penetration of chlorides from deicing salts, groundwater or seawater is the most prevalent form of premature concrete deterioration worldwide and costs billions of dollars a year in terms of infrastructure repair and replacement. There are currently numerous strategies available for increasing the service life of reinforced structures exposed to chloride salts; these include the use of:•low-permeability (high-performance) concrete,•chemical corrosion inhibitors,•protective coatings on steel reinforcement (e.g. epoxy-coated or galvanized steel), •corrosion-resistant steel (e.g. stainless steel),•non-ferrous reinforcement (e.g. fiber-reinforced plastics),•waterproofing membranes or sealants applied to the exposed surface of the concrete,•cathodic protection (applied at the time of construction), and•combinations of the above.Each of these strategies has different technical merits and costs associated with their use. Selecting the optimum strategy requires the means to weigh all associated costs against the potential extension to the life of the structure. Life-cycle cost analysis (LCCA) is being used more and more frequently for this purpose. LCCA uses estimated initial construction costs, protection costs, and future repair costs to compute the costs over the design life of the structure. Many concrete protection strategies may reduce future repair costs by reducing the extent of future repairs or by extending the time between repairs. Thus, even though the implementation of a protection strategy may increase initial costs, it may still reduce life-cycle costs.A number of models for predicting the service life of concrete structures exposed to chloride environments or for estimating life-cycle costs of different corrosion protection strategies have been developed recently and some of these are available on a commercial basis. The approaches adopted by the different models vary considerably and consequently there can be significant variances between the solutions produced by individual models. This has caused some concern among the engineering community and in response to this, in May 1998 the Strategic Development Council (SDC) of the American Concrete Institute (ACI) identified the need to develop a “standard model” and recommended that a workshop be held to investigate potential solutions. In November 1998, such a workshop, entitled “Models for Predicting Service Life and Life-Cycle Cost of Steel-Reinforced Concrete”, was sponsored by the National Institute of Standards and Technology (NIST), ACI, and the American Society for Testing and Materials (ASTM). A detailed report of the workshop is available from NIST (Frohnsdorff, 1999). At this workshop a decision was made to attempt to develop a “standard model” under thejurisdiction of the existing ACI Committee 365 “Service Life Prediction.” Such a model would be developed and maintained following the normal ACI protocol and consensus procedure for producing committee documents.In order to expedite the process, a consortium was established under ACI’s SDC to fund the development of an initial life-cycle cost model based on the existing service life model developed at the University of Toronto (see Boddy et al., 1999). The funding members of this consortium, known as the Life-365 Consortium, were Master Builders Technologies, Grace Construction Products and the Silica Fume Association. Life-365 Version 1.0 was released in October 2000, and later revised as Version 1.1 in December 2001 to incorporate minor changes.The current version has many limitations in that a number of assumptions or simplifications have been made to deal with some of the more complex phenomena or areas where there is insufficient knowledge to permit a more rigorous analysis. Users are encouraged to run various “user-defined scenarios” in tandem with the Life-365 prediction with minor adjustments to the values (e.g. D28, m, C t, C s, t p)selected by Life-365. This will aid in the development of an understanding of the roles of these parameters and the sensitivity of the solution to their values.It is intended that Life-365 will eventually be handed over to ACI Committee 365 for review and possible adoption as an initial “standard” model, and that continued refinement and validation be carried out under the auspices of that committee.This manual is divided into four parts:Life-365 Model™ Description.This section provides a detailedexplanation of how the model, Life-365, estimates the service life (time tocracking and first repair) and the life-cycle costs associated with differentcorrosion protection strategies. The mathematical equations and empiricalrelationships incorporated in the model are presented in this section.Life-365 Users Manual. This section is an operator’s manual that givesinstructions on how to use Life365 v2.0, the input parameters required,and the various options available to the user.Background Information.This section presents published and otherinformation to support the relationships and assumptions used in themodel to calculate the service life and life-cycle costs. A discussion of thelimitations of the current model is also presented.Appendix A.This section provides recommended protocols fordetermining some of the input parameters used in Life-365.2 Life-365 Model DescriptionThe analyses carried out within Life-365 can be split into four separate steps:• Predicting the time to the onset of corrosion, commonly called the initiation period, t i ;• Predicting the time for corrosion to reach an unacceptable level, commonly called the propagation period, t p ; (Note that the time to first repair, t r , is the sum of these two periods: i.e. t r = t i + t p )• Determining the repair schedule after first repair; and• Estimating life-cycle costs based on the initial concrete (and other protection) costs and future repair costs.2.1 Predicting the Initiation PeriodThe initiation period, t i , defines the time it takes for sufficient chlorides to penetrate the concrete cover and accumulate in sufficient quantity at the depth of the embedded steel to initiate corrosion of the steel. Specifically, it represents the time taken for the critical threshold concentration of chlorides, C t , to reach the depth of cover, x d . Life-365 uses a simplified approach based on Fickean diffusion that requires only simple inputs from the user. It is intended that future versions of Life-365 will be capable of accounting for the combined effects of diffusion and convection, and also of chloride binding by the products of hydration. These capabilities have been implemented in more complex service life models (e.g., Boddy et al., 1999).2.1.1 Predicting Chloride Ingress due to DiffusionThe model predicts the initiation period assuming diffusion to be the dominant mechanism. Fick’s second law is the governing differential equation:22dxC dD dt dC !=, Eqn. 1 whereC = chloride content,D = apparent diffusion coefficient,x = depth (from the exposed surface), and t = time.The chloride diffusion coefficient is a function of both time and temperature, and Life-365 uses the following relationship to account for time-dependent changes in diffusion:()m ref ref t t D t D !!"#$$%&'=, Eqn. 2where D(t)= diffusion coefficient at time t , D ref= diffusion coefficient at time t ref (= 28 days in Life-365), and m = constant (depending on mix proportions).Life-365 selects values of D ref and m based on the mix design details (i.e., water-cementitious material ratio, w/cm , and the type and proportion of cementitious materials) input by the user. In order to prevent the diffusion coefficient decreasing with time indefinitely, the relationship shown in Eqn. 2 is only valid up to 25 years. Beyond this time, the value at 25 years (D 25) calculated from Eqn. 2 is assumed to be constant throughout the rest of the analysis period.Life-365 uses the following relationship to account for temperature-dependent changes in diffusion:()!!"#$$%&''()**+,-..=T T R U D T D ref ref 11exp , Eqn. 3where D(T) = diffusion coefficient at time t and temperature T ,D ref = diffusion coefficient at time t ref and temp. T ref ,U = activation energy of the diffusion process (35000 J/mol), R = gas constant, andT = absolute temperature.In the model, t ref = 28 days and T ref = 293K (20°C). The temperature T of the concrete varies with time according to the geographic location selected by the user. If the required location cannot be found in model database, the user can input the necessary temperature data.The chloride exposure conditions (e.g., rate of chloride build up at the surface and maximum chloride content) are selected by the model based on the type of structure (e.g., bridge deck, parking structure), the type of exposure (e.g., to marine or deicing salts) and the geographic location. Alternatively, the user can input data for these parameters.The solution is carried out using a finite difference implementation of Fick’s second law (Eqn. 1) where the value of D is modified at every time step using Eqns. 2 and 3.2.1.2 Input Parameters for Predicting the Initiation PeriodThe following general user inputs are required for each project:• Geographic location;• Type of structure and nature of exposure;• Depth of clear concrete cover to the reinforcing steel (x d ), and•Details of each protection strategy scenario such as water-cement ratio, type and quantity of mineral admixtures or corrosion inhibitors, type of steel and coatings, presence of membranes or sealers.From these input parameters the model selects the necessary coefficients for calculating the time to corrosion, as detailed above.Surface Chloride Build UpThe model determines a maximum surface chloride concentration, C s, and the time taken to reach that maximum, t max, based on the type of structure, its geographic location, and exposure as selected by the user. For example, if the user selected a bridge deck in an urban area of Moline, Illinois, the model would use the surface concentration profile shown in Figure 1. Alternatively, the user can input the maximum.Figure 1. Examples of Concrete Surface History and Environmental TemperaturesTemperature ProfileThe model determines yearly temperature profiles based on the user’s input for geographical location using a database compiled from meteorological data. For example, if the user selected Moline, Illinois, the model would use the temperature profile and make the necessary adjustments to the diffusion coefficient using Eqn. 3. Alternatively the temperature profile can be defined by the user.Base Case Concrete MixThe base case concrete mix assumed by the model is plain Portland cement concrete with no special corrosion protection applied. For the base case, the following values are assumed:D 28 = 1 x 10(-12.06 + 2.40w/c ) m 2/s, m = 0.20, andC t = 0.05% (by mass of concrete).The relationship between D 28 and the water-cementitious materials ratio (w/c ) is based on a large database of bulk diffusion tests. The nature of the relationship is shown opposite (corrected to 20°C). The value of m is based on data from the University of Toronto and other published data, and the value of C t is commonly used for service-life prediction purposes (and is close to a value of 0.40% chloride based on the mass of cementitious materials for a typical structural concrete mix).It should be noted that these relationships pertain to concrete produced with aggregates of normal density and may not be appropriate for lightweight concrete.Effect of Silica FumeThe addition of silica fume is known to produce significant reductions in thepermeability and diffusivity of concrete.Life-365 applies a reduction factor to thevalue calculated for Portland cement,D PC , based on the level of silica fume (%SF ) in the concrete. The following relationship, which is again based on bulk diffusion data, is used:D SF = D PC ·e -0.165·SF .The relationship is only valid up toreplacement levels of 15% silica fume.The model will not compute diffusionvalues (or make service life predictions)for higher levels of silica fume.Figure 2. Relationship Between D 28 andw/c Figure 3. Effect of Silica Fume on D SFLife-365 assumes that silica fume has no effect on either C t or m .Effect of Fly Ash and SlagNeither fly ash nor slag are assumed to effect the early-age diffusion coefficient, D 28, or the chloride threshold, C t . However, both materials impact the rate of reduction in diffusivity and hence the value of m . The following equation is used to modify m based on the level of fly ash (%FA ) or slag (%SG ) in the mix:m = 0.2 + 0.4(%FA /50 + %SG /70).The relationship is only valid up to replacement levels of 50% fly ash or 70% slag, and thus m ≤ 0.60. The modelwill not compute diffusion values (ormake service life predictions) for higherlevels of these materials.Figure 4 shows the effect of m for threemixes with w/cm = 0.40 and with (i) plain Portland cement (PC), (ii) 30% slag, and (iii) 40% fly ash. These mix proportions yield the coefficients listed in Table 1.Table 1. Effects of Slag and Fly Ash on Diffusion Coefficientsm(<=0.60) D 28(x 10-13m 2/s) D 10y(x 10-13m 2/s) D 25y(x 10-13m 2/s) PC 0.20 79 30 25 30% SG 0.37 79 13 9.3 40% FA0.52796.33.9Effect of Corrosion InhibitorsThe model accounts for two chemical corrosion inhibitors with documented performance: calcium nitrite inhibitor (CNI) and Rheocrete 222+ (a proprietary product from Master Builders; in the Life-365 software, it is referred to as “A&E,” for “amines and esters”). It is intended that more inhibitors be included when appropriate documentation of their performance becomes available.Figure 4. Effects of Fly Ash and Slag on D tFive dosage levels of 30% solution calcium nitrite are permitted in Life-365. The inclusion of CNI is assumed to have no effect on the diffusion coefficient, D28, or the diffusion decay coefficient, m. The effect of CNI on the chloride threshold, C t, varies with dose as shown in the following table.Table 2. Effects of CNI on ThresholdCNI Dose litres/m3gal/cy Threshold, C t (% wt. conc.)0 0 0.0510 2 0.1515 3 0.2420 4 0.3225 5 0.3730 6 0.40A single dose of Rheocrete 222+ (or amines and esters, as it is referred to in the software) is permitted in the model; the dose is 5 litres/m3 concrete. This dose of the admixture is assumed to modify the corrosion threshold to C t= 0.12% (by mass of concrete). Furthermore, it is also assumed that the initial diffusion coefficient is reduced to 90% of the value predicted for the concrete without the admixture and that the rate of chloride build up at the surface is decreased by half (in other words it takes twice as long for C s to reach its maximum value). These modifications are made to take account of the pore modifications induced by Rheocrete 222+ (or amines and esters), which tend to reduce capillary effects (i.e. sorptivity) and diffusivity.Effect of Membranes and SealersMembranes and sealers are dealt with in a simplified manner: it is assumed that both membranes and sealers only impact the rate of chloride build-up. Membranes start with an efficiency of 100%, which deteriorates over the lifetime of the membrane; the default lifetime is 20 years. This means that the rate of build-up starts at zero and increases linearly to the same rate as that for an unprotected concrete at 20 years. In the example shown in Figure 5, the surface chloride for unprotected concrete increases at a rate of 0.04% per annum and reaches a maximum concentration of 0.60% at 15 years. Both the initial efficiency and the lifetime of the membrane can be changed by the user. Also the membrane can be reapplied at regular intervals in the same manner as sealers (described below).Figure 5. Effects of Membranes and SealersSealers are dealt with in the same way, except that the default lifetime is only 5 years. The example in Figure 5 shows the effect of reapplying the sealer every 5 years. Each time the sealer is applied, the build-up rate is reset to zero and then allowed to build up back to the unprotected rate (0.04% per annum in the example) at the selected lifetime of the sealer (5 years in the example). Membranes and sealers can only be reapplied up to the time of the first repair.Effect of Epoxy-Coated SteelThe presence of epoxy-coated steel does not affect the rate of chloride ingress in concrete, nor would it be expected to impact the chloride threshold of the steel at areas where the steel is unprotected. Consequently, the use of epoxy-coated steel does not influence the initiation period, t i. However, it is assumed in the model that the rate of damage build up is lower when epoxy-coated steel is present and these effects are dealt with by modifying the propagation period, t p (see below).Effect of Stainless SteelIn the current version of Life-365 it is assumed that grade 316 stainless steel has a corrosion threshold of C t= 0.50% (i.e., ten times black steel).2.1.3Solution ProcedureThe Life-365 Computer Program uses a finite difference implementation of Fick's Second Law, the general advection-dispersion equation. Implicit in the model are the following assumptions:•The material under consideration is homogeneous (e.g. no surface effects);•The surface concentration is constant around the concrete member at any given time;•The properties of the elements are constant during each time step, calculated at the start of each time step; and•The diffusion constant is uniform over the depth of the element.2.2Predicting the Propagation PeriodThe propagation period, t p, is fixed at 6 years. In other words, the time to repair, t r, is simply given by t r = t i + 6 years. The only protection strategy that influences the duration of the propagation period is the use of epoxy-coated steel, which increases the period to t p = 20 years. The propagation period can be changed by the user.2.3Repair ScheduleThe time to the first repair, t r, is predicted by Life-365 from a consideration of the properties of the concrete, the nature of any corrosion protection strategy and details of the environmental exposure. The cost and extent of this first repair (i.e., the percentage of area to be repaired) and the cost, extent, and schedule of future repairs are estimated by the user.2.4Probabilistic Predictions of Initiation PeriodLife-365 includes probabilistic calculations using the method explained in a recent paper (Bentz 2003); see the paper for details. This method applies the following steps:a)Estimate time to first corrosion for average values of all input.b)For each of the five input variables of relevance (D ref, C s, m, C t, x d), perform fiveadditional deterministic calculations with each of the variable sequentiallyadjusted by 10%.c)From the results of step b) compared to the result from step a), estimate thederivative of corrosion initiation time with respect to each of the five variables.This determines the sensitivity of the results to variations in each of the inputvariables.d)Use the results from step c) to estimate the single parameter of variability, similarto a standard deviation, for the log-normal assumed variation of time to corrosion initiation. Thus the distribution of time to first corrosion is assumed to follow alog-normal distribution, shown by Bentz to work well. The average value of thisdistribution is taken from the deterministic analysis in step a). The variability ofthis assumed distribution is determined from the results of steps b) and c).2.5Estimating Life-Cycle CostsPrice InformationThe user is responsible for providing the following cost information to be used in the life cycle cost analysis:•Cost of concrete mixes (including corrosion inhibitors) for the various strategies under consideration,•Cost of repairs,•Inflation rate, i, and•Real discount rate, r.Life-365 provides the following default costs for various rebar protection strategies: •Black steel = $1.00/kg ($0.45/lb)•Epoxy-coated rebar = $1.33/kg ($0.60/lb)•Stainless steel = $6.60/kg ($2.99/lb)The costs of these materials can be changed by the user.2.6Calculating Life-Cycle CostsPresent Worth CalculationsThe total life-cycle costs are calculated as the sum of the initial construction costs and the discounted future repair costs over the life of the structure.The initial construction costs are simply the cost of the concrete + the cost of the steel (or other reinforcement) plus the cost of any surface protection (membrane or sealer). These costs are expressed on the basis of a unit area of the structure (e.g. $/m2).Future repair costs are calculated on a “present worth” basis using the inflation rate, i, and the real discount rate, r, both provided by the user. The present worth, PW, of a future cost c ($/m2) at time t (years) is given by the formula:!PW=c1+i1+r"#$%&'tEqn. 4All the predicted future repair costs over the entire design life of the structure are calculated in this manner and added to the initial construction costs to give the total life-cycle costs.3Life-365 Users ManualThe concrete service life and life-cycle costing methodologies described in Chapter 2 are implemented in the Life-365 computer program in a way that allows for easy input of the environmental, concrete, and economic parameters, and for rapid sensitivity analysis of the parameters that most influence concrete service life and life-cycle cost. This chapter first describes the basic characteristics of approach and the software, and then describes optional additional features designed for experienced practitioners.3.1Installing Life-365 v2.0Life-365 runs on personal computers, including those running Microsoft Windows, Apple OS X, and Linux. It requires Java 1.5 (or higher), which comes preinstalled with current versions of Windows and Mac OS X, or can be installed from the Java website.1To install Life-365 itself:•From the Life-365 CD: In Windows, select “InstallWindows.bat”; on other operating systems, select “InstallNonWindows.jar.”•From the Life-365 installation zip file: download and then unzip the file on your desktop, enter the folder of contents, and then make the Windows or non-Windows selection you would above.3.2Starting Life-365Installing Life-365 puts a start menu item, “Life-365,” in your Windows Programs folder (accessible from the Start button in the lower left-hand corner of your screen); it will typically also put an icon on your desktop. (Other platforms such as Apple OS X may not, depending on your Java settings). To start Life-365, simply select this menu item or the desktop icon.When Life-365 starts, your screen should look like Figure 6. This screen has two components. On the left-hand side there is a navigation menu that, under the Navigator section, lets you open new or existing Life-365 project files; under the Settings section, lets you change the default settings and get help with particular screens; and under the Tips section, displays text that gives you information and tips on using the software.1 Java 1.5 is produced by Sun Microsystems, Inc., and can be installed by downloading from/javase/downloads/index.jsp (accessed September 18, 2007).。
北京交通大学土木建筑工程学院硕导介绍:杜进生

11. Du JS, Xiang XY, Mosallam A. Analysis of shrinkage and creep effects on the widening of highway bridges, Proceeding of Shanghai International Conference on Technology of Architecture and Structure (ICTAS 2009), Shanghai, China, October 15-17, 2009, pp.425-431.
9. Ayman S. Mosallam, Medhat Khorshid, Ibrahim Eldemirdash, Jinsheng Du. The use of recycled and hybrid environmentally friendly composite materials, Proceedings of fiber reinforced polymer (FRP) composites for infrastructure applications conference, November 4-6, 2009, San Francisco California, USA.
北京交通大学人才基金项目 “碳纤维(CFRP)预应力混凝土桥梁设计方法研 究”,负责人。
香港研究资助局项目(RGC-HKU710207E) “Ductility and deformability of high-strength concrete beams partially prestressed with conventional and non-conventional unbonded tendons”,主要参加人(负责人为香港大 学土木系的区达光博士)。
土木工程外文翻译
原文Construction and Building MaterialsVolume 21, Issue 5 , May 2007, Pages 1052-1060An approach to determine long-term behavior of concrete members prestressed with FRP tendonsAbstractThe combined effects of creep and shrinkage of concrete and relaxation of prestressing tendons cause gradual changes in the stresses in both concrete and prestressing tendons. A simple method is presented to calculate the long-term prestress loss and the long-term change in concrete stresses in continuous prestressed concrete members with either carbon fiber reinforced polymer (CFRP) or aramid fiber reinforced polymer (AFRP) tendons. The method satisfies the requirements of equilibrium and compatibility and avoids the use of any empirical multipliers. A simple graph is proposed to evaluate the reduced relaxation in AFRP tendons. It is shown that the prestress loss in FRP tendons is significantly less than that when using prestressing steel, mainly because of the lower moduli of elasticity of FRP tendons. The long-term changes in concrete stresses and deflection can be either smaller or greater than those of comparable girders prestressed with steel tendons, depending on the type of FRP tendons and the initial stress profile of the cross-section under consideration.Keywords: Creep; FRP; Long-term; Prestress loss; Prestressed concrete; Relaxation; ShrinkageNomenclatureA area of cross sectiond vertical distance measured from top fiber of cross sectionE modulus of elasticityage-adjusted elasticity modulus of concretef pu ultimate strength of prestressing tendonh total thickness of concrete cross sectionI second moment of areaO centroid of age-adjusted transformed sectiont final time (end of service life of concrete member)t0concrete age at prestressingy coordinate of any fiber measured downward from Oχaging coefficientχr reduced relaxation coefficientαratio of modulus of elasticity of FRP or steel to that of concreteΔεc(t,t0) change in concrete strain between time t0 and tΔεO change in axial strain at the centroid of age-adjusted transformed section OΔσc(t,t0) stress applied gradually from time t0 to its full amount at time tΔσpr intrinsic relaxationreduced relaxationΔσp total long-term prestress lossΔψchange in curvatureεcs shrinkage strain of concrete between t0 and tεc(t0) instantaneous strain at time t0) creep coefficient between t0 and t(t, tσc(t0) stress applied at time t0 and sustained to a later time tσp0initial stress of prestressing tendonρreinforcement ratioψcurvatureΩthe ratio of the difference between the total prestress loss and intrinsic relaxation to the initial stressSubscripts1 transformed section at t0c concretecc net concrete sectionf FRP reinforcement or flangep prestressing FRP tendonps prestressing steel tendons steel reinforcementArticle OutlineNomenclature1. Introduction2. Relaxation of FRP prestressing tendons3. Proposed method of analysis3.1.Initial steps3.2. Time-dependent change in concrete stress3.3. Long-term deflection4. Application to continuous girders5. Development of design aids6. Illustrative example7. SummaryAcknowledgementsReferences1. IntroductionThe use of fiber reinforced polymer (FRP) tendons as prestressing reinforcements have been proposed in the past decade and a few concrete bridges have already been constructed utilizing fiber reinforced polymer (FRP) tendons. Compared to conventional steel prestressing tendons, FRP tendons have many advantages, including their noncorrosive and nonconductive properties, lightweight, and high tensile strength. Most of the research conducted on concrete girders prestressed with FRP tendons has focused on the short-term behavior of prestressed members; research findings on the long-term behavior of concrete members with FRP tendons are scarce in the literature. The recent ACI Committee report on prestressing concrete structureswith FRP tendons (ACI 440.4R-04 [1]) has pointed out that: “Research on thelong-term loss of prestress and the resultant time-dependent camber/deflection is needed …” Most of the research an d applications of FRP tendons in concrete structures have adopted either carbon fiber reinforced polymer (CFRP) or aramid fiber reinforced polymer (AFRP) tendons. The use of glass fiber reinforced polymers (GFRP) has mostly been limited to conventional reinforcing bars due to their relatively low tensile strength and poor resistance to creep. Therefore, this paper focuses on prestressed members with either CFRP or AFRP tendons.Creep and shrinkage of concrete, and relaxation of prestressing tendons, causelong-term deformations in concrete structures. While it is generally accepted that long-term losses do not affect the ultimate capacity of a prestressed concrete member, a reasonably accurate prediction of these losses is important to ensure satisfactory performance of concrete structures in service. If prestress losses are underestimated, the tensile strength of concrete can be exceeded under full service loads, causing cracking and unexpected excessive deflection. On the other hand, overestimating prestress losses can lead to excessive camber and uneconomic design.The error in predicting the long-term prestress losses can be due to: (1) inaccuracy in estimation of the long-term material characteristics (creep and shrinkage of concrete and relaxation of prestressing tendons); and (2) inaccuracy of the method of analysis used. The objective of this paper is to address the second source of inaccuracy by presenting a simple analytical method to estimate the time-dependent strains and stresses in concrete members prestressed with FRP tendons. The method satisfies the requirements of equilibrium and compatibility and avoids the use of empirical equations, which in general show loss in accuracy to enable generality. The inaccuracy in the material characteristics used can be mitigated by varying the input material parameters and establishing upper and lower bounds on the analysis results.For the purpose of this paper, and to avoid confusion, a consistent sign convention is used. Axial force N is positive when it is tensile. Bending moment, M, that producestension at the bottom fiber of a cross section and the associated curvature ψ are positive. Stress, σ, and strain, ε, are positive for tension and elongation, respectively. Downward deflection is positive. It follows that shrinkage, εcs, is negative quantity. The loss in tension in prestressing reinforcement due to relaxation Δσpr or due to the combined effects of creep, shrinkage, and relaxation, Δσp, is negative quantity. The analysis considered herein focuses on a prestressed concrete section with its centroidal principal y-axis in vertical direction with the coordinate y of any concrete fiber or steel layer being measured downward from a given reference point.2. Relaxation of FRP prestressing tendonsSimilar to concrete and steel, AFRP prestressing tendons exhibit some creep if subjected to sustained strains. CFRP tendons typically display insignificant amount of creep, which can be neglected for most practical applications. When a prestressing tendon is stretched between two points, it will be subjected to a constant strain. Because of creep, the stress in the tendon decreases (or relaxes) with time to maintain the state of constant strain. This reduction in stress is known as intrinsic relaxationΔσpr. While steel tendons subjected to stresses less than 50% of the yield stress do not exhibit appreciable amount of relaxation, tests on AFRP tendons have shown that they display relaxation under very low stresses. The level of relaxation of AFRP tendons depends upon many factors, including ambient temperature, environment (e.g., air, alkaline, acidic, or salt solutions), ratio of initial stress, σp0, to its ultimate strength, f pu, and time t lapsed after initial stressing. Based on extensive experimentation on relaxation properties of AFRP tendons, Saadatmanesh and Tannous [2] suggested a relationship of the form:(1) where λ = σp1/f pu. σp1 is the stress in the tendon 1 h after stress release. Ratios of σp1/σp0 in their tests varied between 0.91 and 0.96, with an average of 0.93. Tabulated values of the variables a and b were provided for λ = 0.4 and λ = 0.6, and for differenttemperature levels and solution types. For AFRP tendons in air at a temperature of25 °C, relationships for a and b were proposed [2] as(2) In a prestressed concrete member, the two ends of the prestressing tendon constantly move toward each other because of creep and shrinkage of concrete, thereby reducing the tensile stress in the tendon. This reduction in tension has a similar effect to that when the tendon is subjected to a lesser initial stress. Thus, a reduced relaxation value,, should be used in the analysis of long-term effects in prestressed members, such that(3) where χr is a dimensionless coefficient less than unity. Following an approach previously suggested by Ghali and Trevino [3] to evaluate χr for prestressing steel tendons, χr for AFRP tendons can be calculated as (log t in Eq. (1) is taken equal to 5 for 100,000 h):(4) where(5) and ζ is a dimensionless time function defining the shape of the tendon stress–time curve. The value of ζ increases from 0 to 1 as time changes from initial prestress time t0 to final time t. Ω is the ratio of the difference between the total prestr ess loss Δσps(t) and intrinsic relaxation Δσpr(t) to the initial stress σp0, expressed as(6)Fig. 1 shows the variation of χr with Ω for σp0/f pu = 0.4, 0.5, and 0.6, which represents the common values of initial prestressing ratios [1]. As will be shown in a later section, Ω typically varies between 0.1 and 0.2 and a value of χr = 0.95 can be assumed for practical purposes.(20K)Fig. 1. Reduced relaxation coefficient χr for AFRP.3. Proposed method of analysisThe analysis follows the four generic steps proposed by Ghali et al. [4] and depicted schematically in Fig. 2. The procedure can be developed considering an arbitrary section consisting of a simple type of concrete, subjected at time t0 to both prestressing and dead loads. The method will result in a simple equation that is easy to use by practicing engineers instead of lengthy matrix analysis that could only be used in special-purpose computer programs. In addition to the initial strain profile of the cross section, the equation is only a function of four dimensionless coefficients that can be easily calculated (or interpolated from graphs) and the creep coefficient and shrinkage.(56K)Fig. 2. Four steps of analysis of time-dependent effects (after Ghali et al. [4]).3.1. Initial stepsStep 1: Instantaneous strains. At any fiber, the strain and the curvature at time t0 due to the dead load and prestressing effects (primary + secondary) can be calculated. Alternatively, at this stage, the designer may have determined the stress distribution at t0 to verify that the allowable stresses are not exceeded. In this case, the strain diagram at t0 can be obtained by dividing the stress values by the modulus of elasticity of concrete at t0, E c(t0).Step 2: Free creep and shrinkage of concrete. The distribution of hypothetical free change in concrete strain due to creep and shrinkage in the period t0 to t is defined by its value (Δεcc)free at the centroid of the area of the net concrete section, A c (defined as the gross area minus the area of the FRP reinforcement, A f, minus the area of the prestressing duct in the case of post-tensioning, or minus the area of the FRP tendons, A p, in case of pretensioning) at y = y cc as shown in Fig. 3, such that(Δεcc)free=εcc(t0)+εcs(7) where yis the y coordinate of the centroid of the net concrete section, is the creepcoefficient for the period t0 to t, and εcs is the shrinkage in the same period and εcc(t0) is the strain at the centroid of the net concrete section given byεcc(t0)=ε1(t0)+(y cc-y1)ψ(t0) (8) where y1 is the centroid of the transformed area at t0, and ψ(t0) is the curvature (slope of the strain diagram) at t0. Also free curvature isΔψfree=ψ(t0) (9)(15K)Fig. 3. Typical prestressed concrete section and the strain diagram immediately after transfer.Step 3: Artificial restraining forces. The free strain calculated in Step 2 can be artificially prevented by a gradual application of restraining stress, whose value at any fiber y is given by(10)where is the age-adjusted modulus of concrete [5] and [6], used to account for creep effects of stresses applied gradually to concrete and is defined as(11) The artificial restraining forces, ΔN at the reference point O (which is the centroid of the age-adjusted transformed section), and ΔM, that can prevent strain changes due to creep, shrinkage and relaxation can be defined as(12) and(13)where I c, y p, and are the second moment of A c about its centroid, y coordinate of the centroid of the FRP tendons, and the reduced relaxation stress between times t0 and t. It should be noted that if the section contains more than one layer of prestresssing tendons, the terms containing A p or y p A p should be substituted by the sum of the appropriate parameters for all layers.Step 4: Elimination of artificial restraint. The artificial forces ΔN and ΔM can be applied in reversed direction on the age-adjusted transformed section to give the true change in strain at O, ΔεO , and in curvature, Δψ, such that(14a)(14b) whereis the second moment of about its centroid and is the area ofage-adjusted transformed section defined as(15) where E f and E p are the moduli of elasticity for the FRP reinforcement and tendons,respectively, and the is as defined in Eq. (11).Substituting Eqs. (12) and (13) into Eqs. (14a), (14b) and (15) gives(16) and(17)where(18)The time-dependent change in strain in prestressing tendons Δεp can then be evaluated using Eq. (19) and the time-dependent change in stress in prestressing tendons (described by Eq. (20)) is the sum of E p Δεp and the reduced relaxation.Δεp=ΔεO+y pΔψ(19)(20)Substitution of Eqs. (16) and (17) into Eq. (20) gives an expression for the long-term prestress loss, Δσp, due to creep, shrinkage, and relaxation as(21)It should be noted that the last term in Eq. (21), , is zero in the case of prestressed members using CFRP tendons.(23)(24)4. Application to continuous girdersPrestressing of continuous beams or frames produces statically indeterminate bending moments (referred to as secondary moments). As mentioned previously, ε1(t0) andψ(t0) (Eqs. (7), (8) and (9)) represent the strain parameters at a section due to dead load plus the primary and secondary moments due to prestressing. Thetime-dependent change in prestress force in the tendon produces changes in these secondary moments, which are not included in Eq. (21). This section considers the effect of the time-dependent change in secondary moments on the prestress loss.Step 1: Considering a two-span continuous beam, as shown in Fig. 4(a) where the variation of the tendon profile is parabolic in each span, the statically indeterminate beam can be solved by any method of structural analysis (such as the force method) to determine the moment diagram at time t0 due to dead load and prestressing.(14K)Fig. 4. Two-span continuous prestressed girder. (a) Dimensions and cable profile; (b) Locations of integration points (sections).Step 2: The time-dependant sectional analysis can be performed as shown previously for each of the three sections shown in Fig. 4(b) an d determine (Δψ)i for each section, where i = A, B and C.Step 3: Use the force method to determine the change in internal forces and displacements in the continuous beam. The released structure with the shown coordinate system in Fig. 5(a) can be used. It can be assumed that the change in angular discontinuity at middle support between t0 and t is ΔD1 and that the unknown change in the connecting moment is ΔF1. The change in angular discontinuity ΔD1 is then evaluated as the sum of the two end rotations of each of the simple spans l1 and l2. Using the method of elastic weights and assuming a parabolic variation of curvaturein each span, ΔD1 can be expressed as(25)(10K)Fig. 5. Analysis by the force method. (a) Released structure and coordinate system; (b) Moment diagram due to unit value of connecting moment.Step 4: Due to unit load of the connecting moment ΔF1 = 1 that is to be applied gradually on the released structure from zero at time t0 to unity at time t (Fig. 5(b)), determine the change in curvature at each section (Δψu1)i as(26)The age-adjusted flexibility coefficient can be evaluated as(27)Step 5: The change in connecting moment ΔF1 can be computed by solving thecompatibility equation , i.e.,(28) The prestress change (los s or gain) at each section due to continuity (Δσp(cont))i is then(29) where (ΔM)i is the change in bending moment at each section. Thus,(ΔM)A = (ΔM)B = ΔF1/2 and ΔM B = ΔF1. Consideration of parameters generic to most bridges [7] has indicated that Δσp(cont)is very small relative to Δσp determined by analysis that ignores the time-dependent changes in these moments.5. Development of design aidsThe geometric coefficients k A, k I, k cc, and k p (Eq. (18)) depend upon the geometry of the section and the material parameters E f/E c(t0), E p/E c(t0), and χ. The most common girder cross sections likely to be used with FRP tendons are single- or double-T (DT)girders. Therefore, in lieu of using Eq. (18), design aids for the geometric coefficients for a typical DT post-tensioned section (Fig. 3) are presented in Fig. 6a, Fig. 6b, Fig. 6c, Fig. 7a, Fig. 7b, Fig. 7c and Fig. 7d for sections with CFRP and AFRP tendons, respectively. In these figures, the ratio of FRP reinforcement in the flange isρf = A f/(bh f), and the ratio of prestressing steel area to area of webs is ρp = A p/(hΣb w). Linear interpolation can be used for ρf and ρp values not shown in the graphs.7. SummaryA simple method is presented to estimate the long-term prestress loss in continuous concrete girders with FRP tendons as well as the time-dependent change in concrete stresses and deflections at critical sections assuming uncracked conditions. The method presented can be easily programmed using hand-held calculators or computer spread sheets. A simple graphical tool is proposed to calculate the reduced relaxation coefficient χr for AFRP tendons to be used in applying the method to prestressed girders with AFRP tendons and a value of χr = 0.95 is suggested for practical purposes. For the most common DT prestressed girders used in practice, design aids are presented to further simplify the method for practicing engineers.The long-term prestress loss in concrete girders prestressed with FRP tendons is less than that when using steel tendons, mainly because of the lower moduli of elasticity of FRP. The time-dependent change in concrete stresses and deflection can be either smaller or greater than those of comparable girders prestressed with steel tendons, depending on the type of FRP tendons and the initial stress profile (due to dead load and prestressing) of the prestressed cross-section at member mid-span. AcknowledgementsThe authors gratefully acknowledge the provided by California Department of Transportation under Research Grant No. 59A0420.References[1] ACI Committee 440.4R-04 Prestressing concrete structures with FRP tendons. American Concrete Institute. Farmington Hills, MI, 2004.[2] H. Saadatmanesh and F.E. Tannous, Long-term behavior of aramid fiber reinforced plastic (AFRP) tendons, ACI Mater J96 (1999) (3), pp. 297–305.[3] A. Ghali and J. Trevino, Relaxation of steel in prestressed concrete, PCI J30 (1985) (5), pp. 82–94.[4] A. Ghali, R. Favre and M.M. Elbadry, Concrete Structures, Stresses and Deformations (3rd ed.), Spon Press, London & New York (2002).[5] H. Trost, Auswirkungen des Superpositionsprinzips auf Kriech-und Relaxations-problems bei Beton und Spannbeton, Beton Stahlbetonbaun62 (1967) (10), pp. 230–238 (62)11: 261–269 (in German).[6] Z.P. Bazant, Prediction of concrete creep effects using age-adjusted effective modulus, ACI J69 (1972) (4), pp. 212–217.[7] Youakim SA, Karbhari VM. A Simplified method for prediction of long-term prestress loss in post-tensioned concrete bridges. Caltrans Draft Report. University of California at San Diego, CA, 2004.[8] American Association of State Highway and Transportation OfficialsAASHTO-LRFD bridge design specifications. 3rd ed., Washington DC, 2004.译文施工与建筑材料21卷,编号5,2007年5月,1052-1060页决定用FRP筋制作的预应力混凝土构件的长期行为的方法摘要:混凝土的徐变和收缩以及预应力筋的松弛两者的联合作用导致混凝土和预应力筋的应力逐步发生了变化。
香港混凝土结构设计规范-2(最新版)
1GENERALSCOPE1.1This Code of Practice provides recommendations for the design, construction and quality control of reinforced and prestressed concrete buildings and structures where the concrete is made with normal weight aggregates. It covers the requirements for strength, serviceability, durability and fire resistance, but not other possible requirements such as thermal or acoustic properties.For bridges and associated structures, reference should also be made to the Structures Design Manual for Highways and Railways issued by the Highways Department.The design of precast concrete elements and structures is covered in a separate Code of Practice.The following are outside the scope of this Code of Practice:• particular aspects of special types of buildings and civil engineering works, such as membrane, shell and composite structures, viaducts, dams, pressure vessels, andreservoirs• no fines concrete, aerated concrete, glass fibre reinforced concrete, and concrete containing lightweight or heavy aggregate or structural steel sections.REFERENCES1.2This Code of Practice incorporates provisions from the following documents. These documents are referred to at the appropriate parts of the text. For dated references, subsequent amendments or revisions do not apply. For undated references, the latest edition of the publication applies.• Hong Kong Code of Practice on Wind Effects• Hong Kong Code of Practice for Dead and Imposed Loads for Buildings• Hong Kong Code of Practice for Precast Concrete Construction• Hong Kong Code of Practice for Fire Resisting Construction• Hong Kong Construction Standard CS1: Testing Concrete• Hong Kong Construction Standard CS2: Carbon Steel Bars for the Reinforcement of ConcreteASSUMPTIONS1.3The procedures given in this Code of Practice are based on the following assumptions:• the design is carried out by appropriate persons with suitable qualifications and experience;• adequate supervision and quality control is provided in factories, in plants and at site;• construction is carried out by persons having the appropriate skill and experience;• construction materials are used as intended by this Code of Practice or the relevant material or product specification;• the structure will be adequately maintained; and• the structure will be used as intended by the design brief.1.4 DEFINITIONSFor the purpose of this Code of Practice, the following definitions apply.1.4.1 Generalacceptable standards standards acceptable to the Building Authority (BA) as given inAnnex Alimit state the state beyond which the structure no longer fulfils the relevantdesign criteriaultimate limit state (ULS) that state associated with collapse or with other similar forms ofstructural failure (see clause 2.2.2.1)serviceability limit states (SLS) those states relating to specified service requirement for a structureor structural element (see clause 2.2.3.1)design ultimate load the design load used for the ultimate limit statedesign service load the design load used for the serviceability limit statesdesign working life the period of time during which a structure that has undergonenormal maintenance is unlikely to require major repairscantilever projection a structural element that cantilevers from the main structure forexample, canopies, balconies, bay windows, air conditioningplatforms etc.1.4.2 Terms specific to flat slabs (see clause 6.1.5)flat slab a slab supported without beams by columns. The slab may beformed with or without drops and either be solid or the slab soffitmay comprise a series of ribs in two directions (waffle or cofferedslab)column head enlargement of the top of a column which supports the slab over alarger area than the column section alonedrop slab thickening in the region of a column1.4.3 Terms specific to perimeters (see clause 6.1.5.7)perimeter the smallest rectangular boundary that can be drawn round aloaded area which nowhere comes closer to the edges of theloaded area than some specified distance which is a multiple of0.75dfailure zone an area of slab bounded by two perimeters 1.5d aparteffective length of a perimeter the perimeter length reduced for the effects of any holes or externaledgeseffective depth the average effective depth for all effective reinforcement passingthrough a perimetereffective steel area the total area of tension reinforcement that passes through a zoneand that also extends at least one effective depth or 12 times thebar diameter beyond the zone on either side1.4.4 Terms specific to walls (see clause 6.2.2)wall a vertical load-bearing member whose length is greater than fourtimes its thicknessunbraced wall a wall without lateral supportsbraced wall a wall with lateral supportslateral supports horizontal, vertical or inclined elements (which may be props,buttresses, floors or crosswalls) able to transmit lateral forces froma braced wall to the principal structural bracing or to thefoundationsprincipal structural bracing shear walls or other suitable bracing which provide lateral stabilityto the structure as a wholereinforced wall a concrete wall containing at least the minimum quantities ofreinforcement specified in clauses 9.6.1 to 9.6.4plain wall a concrete wall containing either no reinforcement or insufficient tosatisfy the minimum quantities of reinforcement specified in clauses9.6.1 to 9.6.4Note: For a ‘plain wall’, any reinforcement is ignored whenconsidering the strength of the wall.stocky wall a wall where the effective height divided by the thickness (l e/h) doesnot exceed 15 (braced) or 10 (unbraced)slender wall a wall other than a stocky wall1.5 SYMBOLSThe following symbols are the main symbols used throughout this Code of Practice. Other symbolsare defined at the locations at which they are used.A c gross area of the concrete sectionA cc area of the concrete section in compressionA ps area of prestressing tendons in tension zoneA s area of tension reinforcementA s prov area of tension reinforcement providedA s req area of tension reinforcement requiredA st area of transverse reinforcement in a flangeA s'area of beam compression reinforcementA s'prov area of beam compression reinforcement providedA s'req area of beam compression reinforcement requiredA sb cross-sectional area of bent-up barsA sc area of longitudinal reinforcement (A sc hence denotes main reinforcement in columnor wall. It does not necessarily imply that the reinforcement will be in compression.)A sv area of shear reinforcementb breadth of sectionb c effective width of a section in compression (either b or b eff)b e breadth of effective moment transfer strip (see figure 6.10)b eff effective flange width of a T or L beamb w average web width of a beamC x, C y plan dimensions of a columnd effective depth of the tension reinforcementd'effective depth to the compression reinforcementE n nominalloadearthF total design ultimate load (1.4G k + 1.6Q k)f cu Characteristic compressive strength of concretef pb design tensile stress in the tendonsf pe design effective prestress in the tendons after all lossesf pu characteristic strength of a prestressing tendonf s estimated design service stress in the tension reinforcementf y characteristic yield strength of reinforcementf yv characteristic yield strength of the shear reinforcementG k characteristic dead loadh depth of cross section measured in the plane under consideration, or thickness of wall h agg maximum size of coarse aggregateh f thickness of a beam flangel effective span of a beam or slabl b basic anchorage length for reinforcementl e effective height of a column or wall in the plane of bending consideredM design ultimate moment at the section consideredN design ultimate axial forcen b number of bars in a reinforcement bundleQ k characteristicimposedloads b spacing of bent-up barss v spacing of links along the memberV design ultimate shear forceV b design shear resistance of bent-up barsW k characteristicloadwindx depth to the neutral axis of a concrete sectionz lever armγf partial safety factor for loadγm partial safety factor for strength of materialsνdesign shear stress at a sectionνc design ultimate resistance shear stress of the concreteφ diameter of reinforcing bar or prestressing ductφn equivalent diameter of a bundle of reinforcing bar2 BASIS OF DESIGN2.1 REQUIREMENTS2.1.1 Aim of designThe aim of design is to ensure that with an acceptable level of probability a structure will, during its intended design working life, perform satisfactorily. With an appropriate degree of reliability and in an economical way, a structure should:• sustain all loads and deformations likely to occur during construction and use;• remain fit for the purpose of its intended use;• have adequate durability for its environment;• have adequate structural resistance for the required fire resistance period; and• have resistance to the effects of accidental or deliberate misuse such that it will not be damaged to an extent that is disproportionate to the original cause.2.1.2 Design methodThe design method outlined in this code of practice is the limit state design method. In addition, consideration should be given to the requirement for durability and fire resistance. Equally important are the consideration of suitable materials, workmanship and quality control.2.1.3 Design processThe attainment of design objectives requires compliance with defined standards for materials, production, workmanship, maintenance and use of the structure. Design, construction and service use should be considered as a whole and the performance requirements should be clearly defined, wherever possible, early in the design process.2.1.4 RobustnessA structure should be designed and constructed so that it is inherently robust and not unreasonablysusceptible to the effects of accidents or misuse, and disproportionate collapse.2.1.5 Design working lifeThe design working life should be clearly identified. This Code of Practice assumes a design working life of 50 years, which is deemed appropriate for general buildings and other common structures.Where, the design working life differs from this value, the recommendations should be modified as appropriate.2.1.6 Durability, workmanship and materialsThe structure shall be designed such that deterioration over its design working life does not impair the performance of the structure below that intended, having due regard to its environment and the anticipated level of maintenance (see section 4). In order to achieve an adequately durable structure, the following should be taken into account:• the intended or foreseeable use of the structure;• the required design criteria;• the expected environmental conditions;• the composition, properties and performance of the materials and products;• the properties of the soil;• the choice of the structural system;• the shape of members and the structural detailing;• the quality of workmanship, and the level of control;• the particular protective measures; and• the intended maintenance during the design working life.The environmental conditions shall be identified at the design stage so that their significance can be assessed in relation to durability and adequate provisions can be made for protection of the materials used in the structure.It is assumed that the quality of the concrete, steel and other materials and of the workmanship, as verified by inspections, is adequate for safety, serviceability and durability (see section 10).2.1.7 Quality controlIn order to provide a structure that corresponds to the requirements and to the assumptions made in the design, appropriate quality management measures should be in place (see section 11). These measures comprise:• definition of the reliability requirements;• organisational measures; and• controls at the stages of design, construction, use and maintenance.2.2 PRINCIPLES OF LIMIT STATE DESIGNGeneral2.2.1This Code of Practice uses the limit state design method. A limit state can be defined as the state beyond which the structure no longer fulfils the relevant design criteria. Well-detailed and properly-erected structures designed by the limit state method will have acceptable probabilities that they will not reach a limit state. Limit states considered in this Code of Practice are either the ultimate limit state (ULS) or the serviceability limit states (SLS), the meanings of which are described in clauses2.2.2 and 2.2.3 below. The usual approach is to design for the most critical limit state, usually theultimate limit state, and then to check that the remaining limit states will not be reached.2.2.2 Ultimate Limit State (ULS)2.2.2.1 DefinitionUltimate limit state (ULS) is defined in clause 1.4.1. It is related to the safety of people and the safety of the structure. The ultimate limit state is concerned with the strength,stability, collapse, overturning, and buckling of the structure.2.2.2.2 Structural StabilityThe structure should be so designed that adequate means exist to transmit the design ultimate dead, wind and imposed loads safely from the highest supported level to the foundations. The layout of the structure and the interaction between the structural members should be such as to ensure a robust and stable design. The designer responsible for the overall stability of the structure should ensure the compatibility of the design and details of parts and components, even where some or all of the design and details of those parts and components are not made by this designer.The design loads and the design strengths of materials should be those given in clauses 2.3 and 2.4, as appropriate for the ULS. The design should satisfy the requirement that no ultimate limit state is reached by rupture of any section, by overturning or by buckling of individual members under the worst combination of ultimate loads. Account should be taken of elastic or plastic buckling, or sway when appropriate.2.2.2.3 Robustness(a) GeneralStructures should be planned and designed so that they are not unreasonably susceptible tothe effects of accidents. In particular, situations should be avoided where damage to smallareas of a structure or failure of single elements may lead to collapse of major parts of thestructure.Unreasonable susceptibility to the effects of accidents may generally be prevented if thefollowing precautions are taken:• the layout of buildings are checked to avoid any inherent weakness;• aIl buildings are capable of safely resisting the notional horizontal design ultimateload as given in clause 2.3.1.4 applied at each floor or roof level simultaneously;• all buildings are provided with effective horizontal ties (see clause 6.4.1):i. around the periphery;ii. internally;iii. to columns and walls.Where for any reason it is not feasible to introduce ties, the following procedures should beadopted:• the layout of buildings are checked to identify any key elements the failure ofwhich would cause the collapse of more than a limited portion close to theelement in question. Where such elements are identified and the layout cannotbe revised to avoid them, the design should take their importance into account.Key elements should be designed, constructed and protected as necessary toprevent removal by accident. The design loads for key elements are given inclauses 2.3.1.4 (b) and (c);• buildings are detailed so that any vertical load-bearing element other than a keyelement can be removed without causing the collapse of more than a limitedportion close to the element in question. This is generally achieved by theprovision of vertical ties in accordance with clause 6.4 in addition to satisfying thecriteria stated above. There may, however, be cases where it is inappropriate orimpossible to provide effective vertical ties in all or some of the vertical load-bearing elements. Where this occurs, each such element should be consideredto be removed in turn and elements normally supported by the element inquestion designed to ‘bridge’ the gap in accordance with the provisions of clause6.4.2.(b) Check of structural integrityA careful check should be made and appropriate action taken to ensure that there is noinherent weakness of structural layout and that adequate means exist to transmit the dead,imposed and wind loads safely from the highest supported level to the foundations.(c) Safeguarding against vehicular impactWhere vertical elements are at risk from vehicle impact, consideration should be given to theprovision of additional protection, such as bollards, earth banks or other devices. Otherwisethey should be designed in accordance with clause 2.3.1.4 (d).2.2.2.4 Special HazardsThe design for a particular occupancy, location or use, e.g. chemical plant, may need to allow for the effects of particular hazards or for any unusually high probability of the structure surviving an accident even though damaged. In such cases, partial safety factors greater than those given in clauses 2.3 and 2.4 may be required.2.2.3 Serviceability Limit States (SLS)2.2.3.1 DefinitionServiceability limit states (SLS) are defined in clause 1.4.1. They are concerned with:• the functioning of structure or structural elements under normal use;• the comfort of users; and• the appearance of the structure.Typical serviceability limit states concern deformation (deflection), durability, fire resistance, cracking and vibration. In assessing serviceability limit states, consideration should be given to the effects of temperature, creep, shrinkage, sway, settlement and cyclic loading as appropriate.2.2.3.2 Deflection due to vertical loadingThe deformation of the structure or any part of it should not adversely affect its efficiency or appearance. Deflections should be compatible with the degree of movement acceptable by other elements including finishes, services, partitions, glazing and cladding; in some cases a degree of minor repair work or fixing adjustment to such elements may be acceptable. Where specific attention is required to limit deflections to particular values, reference should be made to the detailed calculations provided in clause 7.3.5; otherwise it will generally be satisfactory to use the span/effective depth ratios given in clause 7.3.4.2.2.3.3 Response to wind loadsThe effect of lateral deflection should be considered, particularly for a tall, slender structure. However the accelerations associated with the deflection may be more critical than the deflection itself.Limiting criteria for deflection and accelerations of tall building are given in clause 7.3.2.2.2.3.4 Cracking(a) Reinforced concreteCracking should be kept within reasonable bounds by attention to detail. It will normally becontrolled by adherence to the detailing rules given in clause 8.2 and section 9 and thedeemed to satisfy rules given in clause 7.2.2. Where specific attention is required to limit thedesign crack width to particular values, reference should be made to clause 7.2.(b) Prestressed concreteIn the assessment of the likely behaviour of a prestressed concrete structure or element theamount of flexural tensile stress determines its class, as follows:• class 1: no flexural tensile stresses;• class 2: flexural tensile stresses but no visible cracking; and• class 3: flexural tensile stresses but surface width of cracks not exceeding 0.1mm for members in very aggressive environments (e.g. exposure to sea) and notexceeding 0.2 mm for all other members.2.2.3.5 VibrationDiscomfort or alarm to occupants, structural damage, and interference with proper function should be avoided. Isolation of the source of vibration or of part or all of the structure may be needed. Flexible structural elements may require special consideration. Clause 7.3.3 contains guidance on acceptable levels of vibration.2.2.3.6 FatigueWhen the imposed load on a structure is predominantly cyclic it may be necessary to consider the effects of fatigue.2.2.3.7 Durability and Fire ResistanceFor requirements for durability and fire resistance refer to section 4.2.3 LOADS2.3.1 Design Loads2.3.1.1 Characteristic values of loadsThe following loads should be used in design:• characteristic dead load, G k, i.e. the weight of the structure complete with finishes, fixtures and partitions as defined in the Code of Practice for Dead and Imposed Loadsfor Buildings;• characteristic imposed load, Q k, as defined in the Code of Practice for Dead and Imposed Loads for Buildings; and• characteristic wind load, W k, as defined in the Code of Practice on Wind Effects.2.3.1.2 Nominal earth loadsNominal earth loads, E n, should be obtained in accordance with normal practice and basic engineering principles.2.3.1.3 Partial safety factors for loads, γfThe design load for a given type of loading and limit state is obtained from:γf G k or γf Q k or γf W k or γf E nwhere:γf is the appropriate partial safety factor. It is introduced to take account of unconsidered possible increases in load, inaccurate assessment of load effects, unforeseen stressredistribution, variation in dimensional accuracy and the importance of the limit state beingconsidered. The value of γf chosen also ensures that the serviceability requirements cangenerally be met by simple rules.2.3.1.4 Design loads for robustness(a) Notional horizontal loadAll buildings should be capable of resisting a notional design ultimate horizontal load applied ateach floor (including roof) level simultaneously equal to 1.5% of the characteristic dead weightof the structure between mid-height of the storey below and either mid-height of the storeyabove or the roof surface for the uppermost floor [i.e. the design ultimate wind load should notbe taken as less than this value when considering load combinations 2 or 3 (see clause2.3.2.1)].(b) Loads on key elementAppropriate design loads should be chosen having regard to the importance of the key elementand the likely consequences of its failure, but in all cases an element and its connectionsshould be capable of withstanding a design ultimate load of 34 kN/m2, to which no partial safetyfactor should be applied, from any direction. A horizontal member, or part of a horizontalmember that provides lateral support vital to the stability of a vertical key element, should alsobe considered a key element. For the purposes of this clause, the area to which these loadsare applied will be the projected area of the member (i.e. the area of the face presented to theloads).(c) Key elements supporting attached building componentsKey elements supporting attached building components should also be capable of supportingthe reactions from any attached building components also assumed to be subject to a designultimate loading of 34 kN/m2. The reaction should be the maximum that might reasonably betransmitted having regard to the strength of the attached component and the strength of itsconnection.(d) Vehicular impactWhere vertical elements are to be designed for vehicular impact the nominal design load shallbe as specified in the Code of Practice for Dead and Imposed Loads for Buildings.2.3.1.5 Exceptional loadsIf in the design it is necessary to consider the probable effects of excessive loads caused by misuse or accident only those loads likely to be acting simultaneously need be considered. The loads considered should be those likely to occur before temporary or permanent measures are taken to repair or offset the effect of the damage.For these exceptional cases all the following should be taken into account:• dead load;• one third of the wind load; and• for buildings used predominantly for storage or industrial purposes or where the imposed loads are permanent, 100% of the imposed load; for other buildings, one-third of theimposed load.2.3.1.6 Differential settlement of foundationsWhere their effects are deemed to be critical to the performance of the structure, the effects of differential settlement between foundations should be taken into consideration. These should be calculated as appropriate based on the geometrical and material properties of the foundations and the geotechnical soil parameters. Loads induced by differential settlement should be treated as permanent.Examples of where differential settlement can occur include:• pad foundations in soft ground;• different types of foundation;• different foundation depths; and• insufficient rigidity of pile cap.2.3.1.7 Loads during constructionThe loading conditions during erection and construction should be considered in design and should be such that the structure's subsequent conformity to the limit state requirements is not impaired.2.3.2 Loads for Ultimate Limit State (ULS)2.3.2.1 Design loadsFor ULS design of the whole or any part of a structure each of the combinations of loading given in table 2.1 should be considered and the design of cross-sections based on the most severe stresses produced.Load typeDead Imposed Load combination Adverse Beneficial Adverse Beneficial Earth andwater pressure Wind1 Dead and imposed(and earth and water pressure)1.4 1.0 1.6 0 1.4 - 2 Dead and wind (andearth and water pressure)1.4 1.0 - - 1.4 1.4 3 Dead, imposed andwind (and earth and water pressure)1.2 1.0 1.2 0 1.2 1.2 Notes:1. Where the earth or water pressure is beneficial, γf should not exceed 1.0. (The value of γfshould be taken such that γfx the design earth or water pressure = the actual earth or water pressure.)2. Where differential settlement is considered, the value of γfshould be the value used for earth and water pressure (see clause 2.3.2.3)Table 2.1 - Load combinations and values of γf for the ultimate limit stateFor load combinations 1 and 2 in table 2.1, the ‘adverse’ γfis applied to any loads that tend to produce a more critical design condition while the ‘beneficial’ γfis applied to any loads that tend to produce a less critical design condition at the section considered. For load combinations 2 and 3, see clause 2.3.1.4 (a) for minimum horizontal load.2.3.2.2 Effect of exceptional loads or localised damageFor assessing the effects of excessive loads (see clause 2.3.1.5) caused by misuse or accident, γf should be taken as 1.05 on the defined loads. When considering the continued stability of a structure after it has sustained localised damage, γfshould also be taken as 1.05. 2.3.2.3 Differential settlement of foundationsFor ultimate limit states, differential settlements need only be considered where they are significant or where second order effects are of importance. In most other cases they need not be considered at ULS, provided that the ductility and rotation capacity of the structural elements is sufficient.Where differential settlements are taken into consideration, the value of γfshould be the value used for earth and water pressure (see table 2.1).2.3.2.4 Creep, shrinkage, and temperature effectsFor ultimate limit states, creep, shrinkage and temperature effects need only be considered where they are significant, for example, for the verification of ultimate limit states of stability where second order effects are of importance. In most other cases they need not be considered at ULS, provided that the ductility and rotation capacity of the structural elements are sufficient. Where creep, shrinkage and temperature effects are taken into consideration, γfshould be taken as 1.0 for adverse conditions.。
FRP加固混凝土结构的最新研究进展_赵洪凯
1.9 ~ 4.4
用 。 然而 , 经过酸碱盐 介质腐 蚀的 耐久性 试验 后 , GFRP筋的弹 性模量没有明显降低 , 其降低量 都在 5 %以内 , 这说明由于介质 引起纤维和树脂的 破坏 都限制 在一 定的渗 透区 域 , 其他的 区域 保持较好的材料性能 。
FRP筋的强度能否被充分利用主要取 决于其与 混凝土的黏 结性能 , 对黏结 性能 的研究 始于 1995年 Malvar的 工作 , 此 后又 有许多研究人员对此展开了较为系统的研究 [ 10] 。 他们认为 FRP 筋的表面尺寸 、水 泥浆 填充物 性能 以及锚 具套 管刚 度是影 响黏 结性能的重要因素 。
Abstract:Withrespecttotheproblemofinfluenceofstructuralsafetyduetodamageinthereinforcedconcretestructure, scholarsbothathomeandabroadhadconductedextensiveresearchesontheperformanceofFRPreinforcedconcrete.ThestateoftheartofcoveringofFRPwithreinforcedconcreteandFRPreinforcedconcretestructure, thepresent situationofapplicationofFRPcablesinbridgesaswellaspresentsituationofresinmatrixofFRPreinforcingmaterial wereanalyzedandsummarized, andadvancesinresearchesonthedurabilityofFRPundervariousenvironmentalconditionsintermsoftemperature, humidity, dryandwetcirculation, chemicalattack, naturalaging, etc, weredescribed.It waspointedoutthatFRPwouldhavebroadmarketandapplicationprospectinourcountry.
结构非线性分析参考文献
参考文献:1. A.M.内维尔著.李国拌,马贞勇译.混凝土的性能,北京:中国建筑工业出版社19832. P.梅泰著.祖永年,沈威,陈志潭译.混凝土的结构性能与材料,上海:同济大学出版社,19913. A.Corpinten&A.R.Ingraffea编.杨煜惠,黄政宇,万良芬等译.混凝土断裂力学.长沙:湖南大学出版社,19884. H.Kupfer,U.K.Hilsdorf,Behavior ofConcrete Under Biaxial Stresses,ACIJournal,August,19695. W.F.Chen,Evaluation of Plasticity-BasedConstitutive ModelsFor Concrete Material,SM Archives 13/1,19886. 过镇海,张秀琴.单调荷载下的混凝土应力—应变全曲线试验研究.北京:清华大学科学研究报告集第三集,19817. 朱伯龙,董振祥.钢筋混凝土非线性分析.上海:同济大学出版社,19858. 杨术秋,林泓.混凝土单轴受压应力—应变全曲线的试验研究.水利学报,1992年第6期9. 过镇海,张秀琴.反复荷载下混凝土应力—应变全曲线试验研究.北京:清华大学科学研究报告集第三集,198110. W.P.Chen,plasticity in Reinforced Concrete,McGraw-Hill Book Company,New York,198211. 过镇海,张秀琴.混凝土受拉应力—变形全曲线的试验研究.建筑结构学报,1988年第4期12. M.E.Tasuji,TheBehaviorofPlainConcreteSubjected to Biaxial stress, Dept.ofStructuralEngineering, Cornell University, Report No:360, March,197613. T.C.Y.Liu,Stress—Strain Response andFracture of Concrete inBiaxial Compression,Dept.Structure,Cornell University, Report No:339,February,197114. 宋玉普.钢筋混凝土有限元分析中的力学模型的研究.大连理工大学博士学位论文,198815. 于骁中等.混凝土的二轴强度及其在拱坝设计中的应用.水利水电科学研究院科学研究论文集,第19集(结构、材料)16. 王传志,过镇海,张秀琴.二轴和三轴受压混疑土的强度试验.土木工程学报,1987年第1期17. 董毓利.混凝土与钢纤维维混凝土本构关系和破坏准则的研究.哈尔滨建筑工程学院博士学位论文199218. O.Buyukozturk et al, Concrete in Biaxial Cyclic Compression, J. Structureal Engineering, Vol.110,No:3, March 198419. 水利水电科学研究院.混凝土的强度与破坏译文集.北京,水利出版杜,198220. 黄真.钢筋混凝土三维非线性有限元分析.天津大学博士学位论文,198921. 王竹溪.热力学(第二版).北京:高等教育出版社,196022. 范镜泓,高芝晖,非连续介质力学基础.重庆,重庆大学学报,198723. 范镜泓,材料本构关系的内时理论及其热力学基础.重庆,重庆大学学报,1985年第6期24. 陈至达,有理力学,徐州,中国矿业大学出版社,199825. 德冈辰雄著.越镇等译.理性连续介质力学入门.北京;科学出板社,198826. 杜殉.连续介质力学引论.北京;清华大学出版社,198527. 匡震邦.非线性连续介质力学基础.西安;西安文通大学出版杜,198928. 黄克智,连续介质力学.北京:清华大学出版社、北京大学出版杜,198929. 杜庆华,郑百哲,应用连续介质力学.北京;清华大学出版社,1986,30. 冯元桢著.李松年译.连续介质力学导论.北京:科学出版社,199231. 过镇海,王传志.多轴应力下混凝土的强度和破坏准则研究.土木工程学报,1991年第3期32. 夏志皋.塑性力学.上海;同济大学出版社,1991。
基于电热耦合模型和寿命预测的IGBT可靠性评估
第37卷第6期电力科学与工程V ol. 37, No. 6 2021年6月Electric Power Science and Engineering Jun., 2021 doi: 10.3969/j.ISSN.1672-0792.2021.06.003基于电热耦合模型和寿命预测的IGBT可靠性评估帅双旭,熊炜,彭月,艾小清,刘玉洁,朱拉沙(贵州大学电气工程学院,贵州贵阳550025)摘要:针对IGBT可靠性评估中结温与运行工况和工作特性紧密相关的问题,以及考虑寿命预测中受多因素的影响,基于IGBT结构及失效机理,提出基于电热耦合模型和Bayerer寿命预测模型的IGBT可靠性预测流程,并结合贵州大学城市配电网柔性互联关键设备及技术研究示范工程,以MMC和DAB换流器中IGBT模块为研究对象,建立其热网络模型并根据设备实际运行工况计算内部IGBT芯片、FWD功率损耗和瞬时结温;通过雨流算法提取温度循环获得IGBT结温统计特征,从而得到IGBT的寿命预测和可靠性评估相关参数,并与利用功率循环曲线计算的失效率进行对比,结果表明,考虑了工作运行状态并基于电热耦合模型和寿命预测模型获得的失效率更能反映IGBT的实际运行情况。
关键词:IGBT;可靠性评估;寿命预测;电热耦合模型;雨流算法中图分类号:TM614 文献标识码:A 文章编号:1672-0792(2021)06-0017-09IGBT Reliability Evaluation Based on Electro-thermal CouplingModel and Life PredictionSHUAI Shuangxu, XIONG Wei, PENG Yue, AI Xiaoqing, LIU Yujie, ZHU Lasha (The Electrical Engineering College, Guizhou University, Guiyang 550025, China)Abstract:Aiming at solving the problem that junction temperature is closely related to operating conditions and operating characteristics in IGBT reliability evaluation and considering the influence of multiple factors in life prediction, this paper proposes the reliability prediction process of IGBT based on electro-thermal coupling model and Bayerer life prediction model on the basis of IGBT structure and failure mechanism. Combined with Guizhou University’s urban distribution network flexible interconnection key equipment and technology research demonstration project, with IGBT modules in MMC and DAB converters as the research object, the thermal network model is established and according to the actual operating conditions of the equipment, the power loss and instantaneous junction temperature收稿日期:2020-12-07基金项目:贵州省科学技术基金([2019]1058)作者简介:帅双旭(1996—),女,硕士研究生,研究方向为柔性互联配电网可靠性评估;熊炜(1972—),女,副教授,研究方向为配电网运行与控制及可靠性研究。
IEC62059标准在智能电能表可靠性预计与考核验证方法上的应用_英文_
B-class fault: The display of the LCD is not complete, LCD blinded, meter enclosure broken, billing data or event log missing, internal relay stuck, communication disconnected.
If the small defect will not affect the normal usage, it can be neglected from failure, for example: LCD backlight or LED indicators do not shine.
2.2 Failure Rate λ Failure rate is the accumulated times that the unrepairable failure occurs within a set time interval. It is the function of the time, while its unit is Fit (Failure in time: 10-9Failures/h) λ. In IEC 62059-31, failure rate λ(t) is defined as instantaneous value:
- 1、下载文档前请自行甄别文档内容的完整性,平台不提供额外的编辑、内容补充、找答案等附加服务。
- 2、"仅部分预览"的文档,不可在线预览部分如存在完整性等问题,可反馈申请退款(可完整预览的文档不适用该条件!)。
- 3、如文档侵犯您的权益,请联系客服反馈,我们会尽快为您处理(人工客服工作时间:9:00-18:30)。
J.Cent.South Univ.(2015)22:3608—3614 DOI:10.1007/sl1771.015-2901.3
Reliability—based service life prediction of existing concrete structures under marine environment
wu Ling-jie(吴灵杰),ZHOU Yongjun(周拥军),KOU Xin-jian(寇新建),JIANG Meng(蒋萌)
垒Springer
School ofNaval Architecture,Ocean and Civil Engineering,Shanghai Jiaotong University,Shanghai 200240,China ◎Central South University Press and Springer-Verlag Berlin Heidelberg 20 1 5
Abstract:Chloride.induced corrosion of the reinforcement is considered as one of the major mechanisms resulting in the reduction of structural resistance of reinforeed concrete structural elements 1pcated in marine and other aggressive environments.A study of reinforced concrete structures located at the Fangcheng dock in也e Beibu Gu1f port.China.was present.The result from field survey indicates that the concrete cover depth and chloride diflusion coefficient fit best normal distribution and lognormal distribution. respectively.The service life of structure is about 55 a.while initiation time is 45 a.Sensitivity anal ̄rsis indicates that the most influential factor of the structure service life prediction is concrete cover,followed by diffusion coefficient.difusion decay index. critical chloride concentration.surface chloride concentration。current density and localized piRing corrosion.Finally,the effects of difusion decay index and critical chloride concentration on structure service life prediction are discussed.
Key words:chloride;existing concrete structure;service life;marine environment
1 Introduction The durability and service life of concrete structures are widely recognized as one of the major components in the rational design of concrete structures.The necessity of time.variant reliability assessment of structural durability is becoming increasingly accepted by many researchers『1—21. The durability of concrete structures is directly caused by steel corrosion[3].The corrosion of the steel 1cads to conc ̄ete fracture.which exhibits in the form of steel cross—section reduction.1OSS of bond between concrete and steel,cracking,and degradation of concrete cover.As a result,the safety and serviceability of concrete structures are reduced.and their service life is shortened f4]. Tuutti’s model『51 is widely accepted as the conceptual model for the deterioration of structures fFig. 1、.The model clearly demonstrates an initiation time followed by a propagation time.During the initiation phase,chloride ions diffuse through concrete toward the reinforcements.The end of the first stage means the beginning of the corrosion of steel,once the chloride concentration reaches a threshold value.The propagation phase is defined as the time from the start of corrosion to a critical steel lOSS limitation.Therefore the initiation and propagation time sum up as the service life of the structure[6]. Few researches have been conducted on investigating the existing concrete structures.LOUNIS and AMLEH[1 1 presented a probabilistic approach for predicting the chloride contamination of concrete and reinforcing steel corrosion of an aging reinforeed concrete bridge deck exposed to chlorides from deicing salts for forty years. LIANG et al『61 proposed the basis for service life predictions of the existing reinforced concrete(RC) bridges in chloride.1aden environments based on mathematical modeling.The Chung.shan Bridge.a 69 years old RC bridge in Taipei,was offered as a case study.STRAUSS et al f71 introduced a feasible approach to analyze the effects of chloride.induced deterioration on the overall safety level of a real highway bridge demolished after 38 years of service.ALIPOUR et al[8] developed an integrated computational methodology for the chloride intrusion simulation and the corrosion initiation time estimation.A comprehensive procedure for the structural perfclrmance evaluation and 1ife-cycle cost analysis of reinforced concrete highway bridges located in ex仃eme chlorl‘de—laden environments were also given.WANG et al【9]proposed a general method for probabilistic corrosion analysis of reinforcing bars in RC bridges.The uncertainties due to limited number of experimental data,incomplete inspection information,as well as the intrinsic randomness of variables affecting the prognostics of corrosion damage were also discussed. The objective of this work is to take the random
Foundation item:Pr0ject(412740l2)supposed by the National Natural Science Foundation ofChina Received date:2014——08——25;Accepted date:2014——12——30 Corresponding author:ZHOU Yong ̄un,Associate Professor;Tel:+86—13916680796;E-mail:yjzhou@sjtu.edu.ca