天津统计年鉴2015社会经济发展指标:城市公共交通(2012—2014年)
合集下载
广东统计年鉴2015社会经济发展指标:城镇单位就业人员年末人数(2014年)续表1
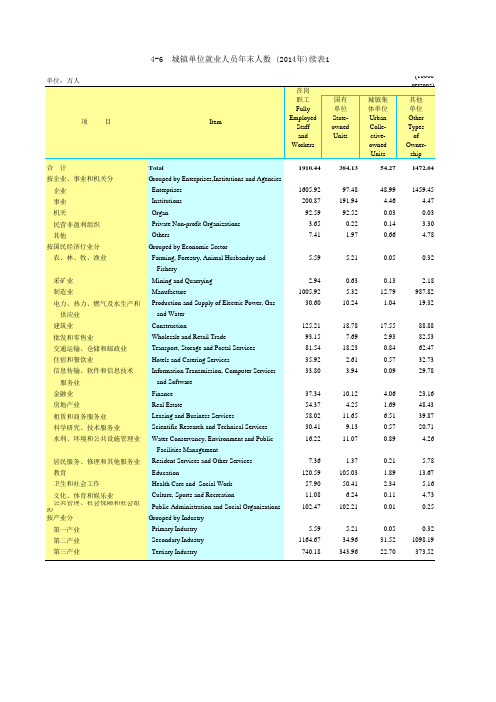
4-6 城镇单位就业人员年末人数 (2014年)续表1
单位:万人 项目
在岗
职工
Fully
Item
Employed
Staff
and
Workers
合计 按企业、事业和机关分
企业 事业 机关 民营非盈利组织 其他 按国民经济行业分 农、林、牧、渔业
采矿业 制造业 电力、热力、燃气及水生产和
供应业 建筑业 批发和零售业 交通运输、仓储和邮政业 住宿和餐饮业 信息传输、软件和信息技术
740.18
国有 单位 Stateowned Units
384.13
97.48 191.94
92.52 0.22 1.97
5.21
0.63 5.32 10.24
18.78 7.69
18.23 2.61 3.94
10.12 4.25
11.65 9.13
11.07
1.37 105.03
50.41 6.24
Enterprises Institutions Organ Private Non-profit Organizations Others Grouped by Economic Sector Farming, Forestry, Animal Husbandry and
Fishery Mining and Quarrying Manufacture Production and Supply of Electric Power, Gas
and Water Construction Wholesale and Retail Trade Transport, Storage and Postal Services Hotels and Catering Services Information Transmission, Computer Services
天津统计年鉴2016社会经济发展指标:公路及民航运输技术经济指标(2013—2015年)
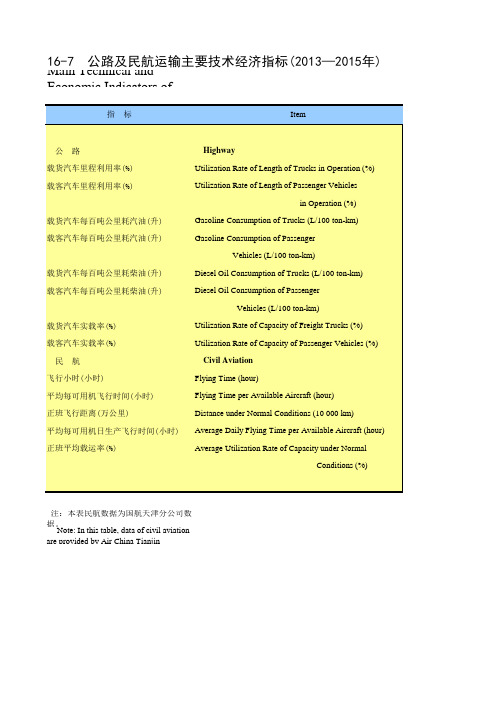
Conditions (%)
注:本表民航数据为国航天津分公司数 据。
Note: In this table, data of civil aviation are provided by Air China Tianjin来自5年)2013
2014
2015
57.0
93.0 10.0
12.8 15.5
22.2 62.7 74.2
Vehicles (L/100 ton-km) Utilization Rate of Capacity of Freight Trucks (%) Utilization Rate of Capacity of Passenger Vehicles (%)
Civil Aviation Flying Time (hour) Flying Time per Available Aircraft (hour) Distance under Normal Conditions (10 000 km) Average Daily Flying Time per Available Aircraft (hour) Average Utilization Rate of Capacity under Normal
81378 3327
4626.1 9.4
77.3
58.0
93.0 10.3
12.6 15.3
21.9 62.9 74.5
82202 3288
4670.7 8.9
75.1
51.0
96.0 11.4
15.5 17.6
21.9 50.5 71.7
92581 3192
5163.9 8.9
72.4
16-7 公路及民航运输主要技术经济指标(2013—2015年) Main Technical and Economic Indicators of
海口市社会经济发展统计年鉴指标数据:历年公共交通统计(2014-2018)

矿产资源开发利用方案编写内容要求及审查大纲
矿产资源开发利用方案编写内容要求及《矿产资源开发利用方案》审查大纲一、概述
㈠矿区位置、隶属关系和企业性质。
如为改扩建矿山, 应说明矿山现状、
特点及存在的主要问题。
㈡编制依据
(1简述项目前期工作进展情况及与有关方面对项目的意向性协议情况。
(2 列出开发利用方案编制所依据的主要基础性资料的名称。
如经储量管理部门认定的矿区地质勘探报告、选矿试验报告、加工利用试验报告、工程地质初评资料、矿区水文资料和供水资料等。
对改、扩建矿山应有生产实际资料, 如矿山总平面现状图、矿床开拓系统图、采场现状图和主要采选设备清单等。
二、矿产品需求现状和预测
㈠该矿产在国内需求情况和市场供应情况
1、矿产品现状及加工利用趋向。
2、国内近、远期的需求量及主要销向预测。
㈡产品价格分析
1、国内矿产品价格现状。
2、矿产品价格稳定性及变化趋势。
三、矿产资源概况
㈠矿区总体概况
1、矿区总体规划情况。
2、矿区矿产资源概况。
3、该设计与矿区总体开发的关系。
㈡该设计项目的资源概况
1、矿床地质及构造特征。
2、矿床开采技术条件及水文地质条件。
天津统计年鉴2015社会经济发展指标:邮政电信服务水平(2011—2014年)

平均每百人拥有电话机(含移动)(部)
Telephone Owned per 100 Persons (include mobile telephone)(set)
平均每百人拥有移动电话(部)
Mobile Telephone Owned per 100 Persons(set)
13.5
13.2
14.0
Average Area Served by Every Post Office
平均每一邮电局所服务人口(万人)
Average People Served by Every Post & Telecommunications Office
# 平均每一邮政局所服务人口
(10 000 persons)
Average People Served by Every Post Office
30.51.7
3.5
3.7
3.8
12.6
14.0
11.7
22.7 115.8
91.1
22.1 117.3
92.2
20.0 113.8
89.9
2014 13.6 27.8
1.7 3.5 13.3
17.4 112.9
89.1
15-13 邮政电信服务水平(2011—2014年) Level of Post and Telecommunication Services,2011-2014
指 标 Item
2011
2012
2013
平均每一邮电局所服务面积(平方公里) Average Area Served by Every Post & Telecommunications Office(sq.km) # 平均每一邮政局所服务面积