洞庭湖植被对降水的响应_英文_
高考地理一轮复习 第31讲 湿地资源的开发与保护——以洞庭湖区为例(含解析)
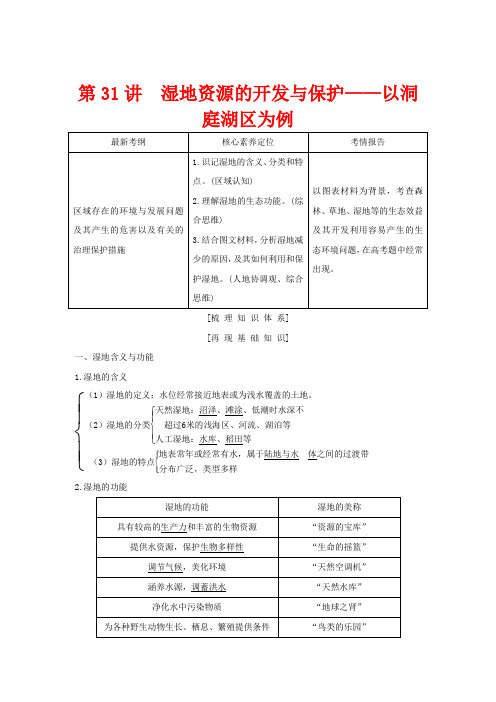
第31讲 湿地资源的开发与保护——以洞庭湖区为例[梳 理 知 识 体 系] [再 现 基 础 知 识]一、湿地含义与功能 1.湿地的含义⎩⎪⎨⎪⎧(1)湿地的定义:水位经常接近地表或为浅水覆盖的土地。
(2)湿地的分类⎩⎪⎨⎪⎧天然湿地:沼泽、滩涂、低潮时水深不 超过6米的浅海区、河流、湖泊等人工湿地:水库、稻田等(3)湿地的特点⎩⎪⎨⎪⎧地表常年或经常有水,属于陆地与水 体之间的过渡带分布广泛,类型多样2.湿地的功能3.洞庭湖湿地的重要价值:维持生物多样性、调蓄洪水、提供丰富的农副产品、航运、旅游观光等。
【疑难辨析1】湿地只存在于湿润、半湿润平原地区吗?提示半干旱、干旱地区以及高原、山地地区也有湿地的分布。
根据湿地的定义,半干旱、干旱地区以及高原、山地地区的河流(包括内流河)、湖泊等都是湿地,如沙漠中的塔里木河、艾尔湖(澳大利亚)及长白山天池、青藏高原上的青海湖、内蒙古高原上的呼伦湖等。
二、湿地资源问题与湿地保护1.湿地资源问题(1)产生与表现(2)案例——洞庭湖萎缩①原因:泥沙淤积严重,大规模围湖造田。
②影响:洪涝灾害日趋严重,航道断航及生态环境问题增多。
2.保护湿地(1)必要性:湿地资源的破坏,严重威胁到居民的生存环境和区域的持续发展。
(2)重要性:合理利用湿地资源,将会给我们带来更多的综合效益,提供更好的生存环境。
(3)措施【疑难辨析2】保护湿地仅是保证湿地面积不减少吗?提示不全是。
保护湿地不仅要保证在面积上不减少,而且要保证湿地的质量,即水源的多少、水质的好坏、物种的多少等,还要保护湿地生态系统的稳定。
考点一湿地的开发与保护【例1】[2015·安徽文综,35(2)、(3),24分]阅读图文材料,结合所学知识,回答下列问题。
上图为巴音布鲁克地区示意图。
巴音布鲁克湿地发育于天山山脉中部大、小尤尔都斯盆地中。
盆地内河流蜿蜒,流向区外。
冬季严寒,年平均气温-4.7℃。
巴音布鲁克湿地内有国家级天鹅自然保护区,栖息着大量的野生天鹅。
2024高考地理真题分类汇编——专题05 地球上的水

专题05 地球上的水(2024·黑龙江/吉林/辽宁)水体性质、运动和库区环境等因素影响水库浮游动物生物量及其分布。
恰甫其海是位于新疆伊犁谷地特克斯河上的水库,周边植被以草原为主。
水库消落区主要分布在南岸。
如图为2019年6月和9月恰甫其海表层浮游动物生物量等值线图。
据此完成下面小题。
1.(海水性质及其对生物的影响)影响6月恰甫其海表层浮游动物生物量分布的主要因素是()A.透明度B.流量C.营养盐D.流向2.(影响海水性质的因素)9月恰甫其海南岸丰富的碎屑食物吸引浮游动物聚集,这些碎屑食物主要来源于()A.底泥扰动上浮B.水位涨落携带C.表层水流汇集D.河川径流输入【答案】1.A 2.B【解析】1.由材料可知,6月为丰水期,因为丰水期为水库蓄水期,上游冰雪融水形成的洪水经库尾进入水库后流速减缓,水体的物理状态发生改变,如泥沙沉降、冲刷力降低,水体透明度升高,此时气温较高,有利于光合作用的进行,浮游生物繁殖较快,数量较多,因此,6月恰甫其海表层浮游动物生物量较为丰富,A正确;与流量、营养盐、流向的关系不大,BCD错误。
故选A。
2.由材料可知,水库消落区主要分布在南岸。
9月是丰水期过后的平水期,恰甫其海南岸丰富的碎屑食物吸引浮游动物聚集,这些碎屑食物主要来源于水位涨落携带,且消落区为草原分布,有机质含量较多,B 正确;9月份入库水量较少,不会引起大规模的底泥扰动上浮,A错误;9月份平水期,不会有大规模的表层水流汇集,C错误;9月份是平水期,河川径流输入较少,D错误。
故选B。
(2024·山东)海洋浮游植物密度的空间分布与海水性质、营养盐等环境因子密切相关。
远岸海域浮游植物密度受陆地影响较小。
如图示意孟加拉湾及其周边区域。
据此完成下面小题。
3.(季风洋流)下列月份中,M区域浮游植物密度最高的是()A.1月B.4月C.7月D.10月4.(海水盐度的影响因素)与7—8月相比,12月至次年1月N区域海水盐度较高的主要影响因素是()A.蒸发B.降水C.径流D.洋流【答案】3.C 4.D【解析】3.根据图示信息可知,M区域位于北印度洋海域,夏季该地盛行西南季风,该海域为离岸风,形成离岸流,底层营养盐类上泛,有利于浮游生物的繁殖,浮游生物密度较高,7月为北半球夏季,M区域浮游植物密度最高,C正确;1月、4月、10月该海域上升流不强,营养物质较少,浮游生物密度较小,ABD错误。
九年级英语第十八单元Planting trees 植树
九年级英语第十八单元Planting tre es 植树Planting trees九年级英语第十八单元Planting trees 植树前言:英语作为在许多国际组织或者会议上都是必需语言,几乎所有学校选择英语作为其主要或唯一的外语必修课。
英语教学涉及多种专业理论知识,包括语言学、第二语言习得、词汇学、句法学、文体学、语料库理论、认知心理学等内容。
本教案根据英语课程标准的要求和教学对象的特点,将教学诸要素有序安排,确定合适的教学方案的设想和计划、并以启迪发展学生智力为根本目的。
便于学习和使用,本文档下载后内容可按需编辑修改及打印。
内容一、教法建议【抛砖引玉】单元双基学习目标Ⅰ. 词汇学习plant , wonderful , dig , deep , stick , tie , diagram , forest , copy , million , towards , mountain , harvestneither…nor , knock…into… , next to , so that , cut down , millions of , stop…from doing sth ,blow…away , not only…but also… , in a few years\' time , far away , thanks toⅡ. 句型学习Tie the tree to the top of the stick to keep it straight .The more , the better .The river near here is over four metres deep .The Great Green Wall is between 400 and 1 700 kilometres wide .Trees must be watered well .The earth should be pushed down hard .More or less !While you\'re doing that I\'ll go and get some water .Ⅲ.语法学习1 )含有情态动词的被动语态的构成及用法。
2023年高考等级考地理一轮复习一题多练(基础+能力+素养)专题 自然环境的整体性与差异性含详解

专题16 自然环境的整体性与差异性洞庭湖区水域与陆地交错,从陆地到水底分布着森林、灌丛、草甸和水生植物等植被类型。
完成小题。
1.洞庭湖区的植被分布,反映了自然地理环境的()A.垂直分异规律B.地方性分异规律C.纬度地带分异规律D.经度地带分异规律2.影响洞庭湖区植被差异的主要因素有()①地形①水分①热量①土壤A.①①B.①①C.①①D.①①下图为“甲、乙两山地同纬度的山地垂直带谱示意图”。
读图完成下面小题。
3.两山地属于()A.昆仑山脉B.秦岭C.祁连山脉D.横断山脉4.两山地的基带植被类型不同,原因是乙山地()A.基带更高,热量不足B.海拔更高,山谷风强C.基带受焚风作用更强D.基带原生植被遭破坏山地地形影响气候特性,进而使山地景观类型随海拔升高而变化。
太行山区地处华北地区,其间分布有盆地和丘陵;黔桂喀斯特山区岩溶地貌发育,形成了基座相连、异常陡峭的峰丛—洼地集合体。
下图示意两山区各景观类型沿海拔梯度分布的面积占比情况。
据此完成下面小题。
5.与黔桂喀斯特山区相比,太行山区针叶林( )A .垂直分布高差大B .总分布面积占比小C .各海拔梯度均有分布D .面积占比最大处海拔低6.黔桂喀斯特山区较低海拔区针叶林面积占比较高,主要由于该山区( )A .山体陡峭B .水分充足C .土壤肥沃D .热量充足7.两山区农田分布上限存在差异的主要原因是( )A .光照条件不同B .水热组合不同C .耕作技术不同D .耕种历史不同公元399年~412年,僧人法显西行求法,游历三十余国,其旅行见闻《佛国记》是现存最早关于中国与南亚陆海交通的地理文献。
下图为“法显求法路线示意图”。
读图回答下列各题。
8.《佛国记》中有“无冬夏之异,草木常茂,田种随人,无有时节”的记载,其描述的区域是A.印度河上游谷地B.帕米尔高原C.斯里兰卡沿海平原D.塔里木盆地9.法显从耶婆提国乘船返回中国最适合的时间是A.1月~5月B.5月~9月C.9月~12月D.11月~次年3月受热带季风气候影响的薄荷岛,位于菲律宾中部,森林茂密。
英语专业名词(水利方面)
英语专业名词(水利方面)hydrosphere水体water body水科学water science水文学hydrology陆地水文学land hydrology应用水文学applied hydrology工程水文学engineering hydrology地表水surface water地下水groundwater水汽water vapour水文要素hydrologic elements降水precipitation雨季rainy season雪snow积雪snow cover初雪first snow终雪latest snow融雪snowmelt冰雹hail截留interception填洼depression detention地面滞留surface detention陆面蒸发evaporation of land水面蒸发evaporation of water surface 土壤蒸发evaporation from soil散发(植物蒸腾)transpiration蒸发能力evaporation capability下渗(入渗)infiltration稳渗steady infiltration下渗能力infiltration capability河川径流river runoff降雨径流rainfall runoff暴雨径流storm runoff融雪径流snowmelt runoff枯季径流dry season runoff基流base flow洪水flood阴塞高压blocking high低空急流low-level jet低涡vortex反气旋(高压)anticyclone气旋(低压)cyclone热带气旋tropic cyclone热带低压tropic depression热带风暴tropic storm强热带风暴severe tropic storm 台风typhoon气团air mass锋(锋面)front天气weather气象meteorology气候climate气候区划climatic regionalization 气候带climatic zone气候变化climatic change小气候microclimate热带tropic zone副热带(亚热带)subtropic zone 比湿specific humidity风wind风向wind direction风速wind speed蒲福风级Beaufort wind scale露dew露点dew point雾fog霜frost霜点frost point初霜first frost终霜latest frost霜冻frostbite无霜期frost-free period流域watershed (basin)流域面积(集水面积)drainage area闭合流域enclosed basin不闭合流域non-enclosed basin闭流区(内流区)bling drainage area分水线(分水岭)divide流域特征basin characteristics流域几何特征basin geometric characteristics 河道复流(河道再生)resurgence常年河perennial stream间歇河intermittent stream悬河(地上河)elevated stream夺流河(断头河)captured river盈水河gaining stream亏水河losing stream暴洪河流flashy stream地下暗河(地下河)underground river 界河boundary river国际河流international river废河道(古河道)dead river岸bank左岸left bank右岸right bank凹岸concave bank凸岸convex bank岸壁land wall水边线(岸线)water line堤防levee河长river length河弯river bend弯曲率tortuosity航道navigable channel河段reach上游upstream潜洲submerged bar深潭deep pool水利学hydraulics明渠水力学open channel hydraulics水静力学hydrostatics水动力学hydrodynamics明渠水流open channel flow恒定流steady flow非恒定流unsteady flow均匀流(等速流)uniform flow非均匀流(变速流)non-uniform flow 急流supercritical flow缓流subcritical flow异重流density current临界流critical flow临界水深critical depth临界流速critical velocity临界流量critical discharge水头head位置水头(位能)elevation head 低强水头(压能)pressure head 流速水头(动能)velocity head 雷诺数Reymold number韦伯数Weber number水力因素hydraulic factor湿周wetted perimeter水力半径hydraulic radius宽深比width-depth ratio中泓线midstream of channel深泓线Thatweg落差fall瀑布waterfall波浪wave驻波standing wave移动波translation wave河流动力学river dynamics河流泥沙river sediment泥沙特征property of sediment土壤侵蚀soil erosion水力侵蚀water erosion山洪侵蚀torrential erosion流域侵蚀basin erosion流域产沙量watershed sediment yield 溶解性总固体total dissolved solids 离子含量ion concentration离子总量total ion concentration离子流量ion discharge矿化度mineral content盐度salinityPH值ph value碱度alkalinity酸度acidity酸雨acid rain电导率electric conductivity混浊度(浊度)turbidity总需氧量total oxygen demand溶解氧dissolved oxygen需氧量oxygen demand生化需氧量biochemical oxygen demand滑雪需氧量chemical oxygen demand硬度hardness非碳酸盐硬度(永久硬度)non-carbonate hardness 硬水hard water浮冰floating ice锚冰anchor ice封冻期freeze-up period封冻(封河)freeze-up平封flat freeze-up立封upright freeze-up冰盖ice cover连底冻grounded ice cover冰丘ice mound封冻冰缘ice edge of freeze-up清沟lead初生清沟primary lead再生清沟secondary lead冰花路毡sludge road felt冰上覆雪snow cover over ice冰脊ice ridge冰缝crack悬冰suspended ice cover冰堆ice pack冰塞ice jam冰上结冰aufeis解冻期break-up period冰变色color change of ice cover冰上有水accumulation of melt water 月中天lunar transit引潮力tidal generation force天文潮astronomic tide气象潮metorologic tide潮汐周期tidal cycle半日潮semidiurnal tide全日潮diurnal tide混合潮mixed tide大潮spring tide小潮neap tide中潮moderate tide太阴月lunar day潮期duration of tide涨潮历时duration of tidal rise落潮历时duration of tidal fall潮流tidal current涨潮流flood tidal current落潮流ebb tidal current憩流slack tide潮流速tidal velocity往复流reversing current旋转流rotary current潮流期duration of tidal current涨潮流历时duration of flood current地下水径流groundwater runoff地下水流速velocity of groundwater flow地下水坡度(地下水水面坡度)hydraulic gradient of groundwater地下水等水位线图water-table contour map 含水层aquifer含水岩系water-content rock series含水岩组water-content rock formation含水岩性water-content rock property含水介质water-hearing medium均匀介质homogeneous medium非均匀介质inhomogeneous medium含水层边界aquifer boundary透水边界permeable boundary隔水边界confining boundary弱透水边界acquitted boundary透水层permeable bed隔水层confining bed弱透水层acquitter水文地质参数hydrogeological parameters渗透系数permeability coefficient导水系数(释水系数)coefficient of transmissivity贮水系数storativity水位传导系数(水力扩散系数)coefficient of water table conductivity压力传导系数coefficient of pressure conductivity持水度water-holding capacity土壤水分常数soil moisture constants土壤吸湿系数absorption coefficient of soil moisture凋萎系数wilting coefficient田间持水量field capacity毛管断裂含水量moisture content at capillary rupture最大水分吸水量maximum molecular moisture content零通量面法zero flux plane method潜水phreatic water降水入渗补给precipitation recharge降水入渗补给系数coefficient of precipitation recharge地表水补给surface water recharge凝结水补给condensation recharge侧向补给lateral recharge越流补给leakage recharge灌溉补给系数irrigation recharge coefficient of groundwater潜水蒸发phreatic water evaporation潜水蒸发临界深度critical depth of phreatic water evaporation潜水溢出量phreatic water overflow to surface潜水位phreatic water level潜水埋深buried depth of phreatic water level潜水含水层厚度thickness of phreatic water aquifer内流湖endorheic lake淡水湖fresh lake咸水湖salt lake盐湖saline lake季节性湖泊seasonal lake富营养湖泊eutrophic lake贫营养湖泊poornutrient lake湖流lake current梯度流gradient current漂流current of friction湖浪lake wave湖泊波漾(假湖)lake seiche湖泊增减水lake wind denivellation湖泊资源lake resources湖泊率lake ratio湖泊补给系数recharge coefficient of lake 湖泊换水周期lake residence period湖盆lake basin湖面高程elevation of water level in lake 岛屿率insulosity湖泊分层lake layering正温层direct thermal stratification逆温层inverse thermal stratification湖泊形态参数morphometric parameter of lake 高位沼泽(贫营养沼泽)main level mire中位沼泽(中营养沼泽)medium level mire 沼泽水文mire hydrology沼泽水量平衡water balanceof mire沼泽水mire water沼泽蒸发mire evaporation沼泽径流mire runoff沼泽表面流surface flow of mire沼泽表层流surface layer flow of mire沼泽含水性moistureproperty of mire沼泽持水性water retention of mire沼泽透水性perviousness of mire沼泽率mire ratio冰川glacier山地冰川(山岳冰川)mountain glacier谷冰川valley glacier宽尾冰川broad-tail glacier冰斗冰川cirque glacier悬冰川hanging glacier贯通冰川(山麓冰川)penetrating glacier冰原ice field冰川平衡线equilibrium line of glacier委托观测entrust gauging水文仪器hydrologic instrument直读仪器direct-reading instrument自记仪器automatic-recording instrument遥测仪器remote telemetry unit传感器sensor固态存贮器solid storage计数器counter记录器recorder显示器display unit平均无故障工作时间mean time between failures 相应水位equivalent stage水文测站hydrometric station基本站basic station辅助站auxiliary station专用站special station水文试验站hydraulic experimental station基准水文站bench mark hydrologic station水文气象站hydrometeorology station巡测站tour gauging station水文站gauging station雨量站网rain gauging network水面蒸发站网water surface evaporation network水位站网stage gauging network泥沙站网sediment gauging network水质站网water quality network地下水观测井网groundwater voservation well network 站网规划hydrologic network planning水文分区hydrologic regionalization站网布设network layout站网分析network analysis站网检验network examination站网优化network optimization站网调整network adjustment站网密度network density现实密度real density可用密度usable density容许最稀站网minimum network设站年限station required age水文信息hydrologic information水文效益hydrologic benefit基面datum临时水准点temporary benchmark测验断面measuring cross-section基本水尺断面basic gauge cross-section流速仪测流断面current-meter measuring cross-section 浮标测流断面float measuring cross-section比降水尺断面slope measuring cross-section辅助水尺断面secondary gauging cross-section临时测流断面temporary measuring cross-section水文缆道hydrometric cableway悬索缆道suspended cableway悬杆缆道suspended rod cableway机动缆道motorized cableway手动缆道hand-operating cableway主索main cable循环索loop cable起重索suspension cable水文缆车hydrometric cable car吊船过河索cableway for anchoring boat缆道测验仪cableway measuring device水文测船hydrometric boat水文测桥hydrometric bridge桥测车gauging vehicle on bridge水文巡测车tour gauging vehicle for hygrometry 雨量器raingauge承水器raingauge receiver量杯measuring glass渠积雨量器accumulative raingauge雨量计rainfall recorder虹吸式雨量计siphon rainfall recorder翻斗式雨量计tipping-bucket rainfall recorder长期雨量计long-term rainfall recorder遥测雨量计telemetering rainfall recorder测雨雷达precipitation-monitoring radar雪量线snow gauge雨雪量计rain and snow recorder蒸发量evaporation蒸发量观测evaporation observation蒸发量折算系数reduction coefficient of evaporation 遮挡率screen ratio蒸发器evaporation pan小型蒸发器(蒸发皿)small evaporation panE-601型蒸发器evaporation pan of type E-601漂浮蒸发器floating evaporation pan蒸发计evaporimeter遇测蒸发计telemetering evaporimeter钩形水尺hook gauge最高水位水尺crest stage gauge校核水尺check gauge基本水尺断面basic gauge辅助水尺断面auxiliary gauge比降水尺断面slope gauge临时水尺temporary gauge水位计stage gauge自记水位计stage recorder浮子式水位计float-type stage recorder压力式水位计pressure-type stage recorder超声波水位计ultrasonic stage recorder遥测水位计telemetering stage recorder接触试水位计contact-type stage recorder远传水位计telecontrol stage recorder自记水位计台stage recorder installation静水井stilling well水深depth测得水深measured depth有效水深effective depth相对水深relative depth断面平均水深mean depth at a cross-section干绳改正air line correction湿绳改正wet line correction测点流速velocity measurement测速垂线surface velocity水面流速velocity at a point测点流速maximum point velocity最大测点流速velocity-measuring vertical垂线平均流速mean velocity at a vertical部分平均流速mean velocity at a segment断面平均流速cross-section velocity distribution浮标流速point velocity coefficient中泓流速surface velocity coefficient流速分布velocity distribution流速梯度velocity gradient垂线流速分布vertical velocity distribution断面流速分布cross-section velocity distribution 水面流速分布surface velocity coefficient顺流downstream flow逆流upstream flow流速脉动velocity pulsation中泓流速midstream流向测量flow-direction measurement体积法cubature流速仪current-meter转子式流速仪rotating-element current-meter旋杯式流速仪cup-type current-meter旋桨式流速仪propeller-type current-meter电波流速仪electric wave current-meter超声波剖面流速仪ultrasonic profile current-meter 多普勒流速仪Doppler current-meter参证流速仪reference current-meter流量计flow meter文杜里水流计Venturi flow meter毕托管Pitot tube流速仪检定current-meter calibration检定槽calibration tank检定车calibration carriage浮标float水面浮标surface float小浮标small float双浮标double float浮杆float-rod堰顶高程elevation of weir crest堰顶水头weir head水工建筑物测流flow measurement by hydraulic structure 闸门开启高度gate opening行近河槽approach channel行近流速approach velocity堰流weir flow流态flow regime自由流free flow淹没流submerged flow半淹没流half-submerged flow孔流sluice flow射流jet flow淹没比submergence ratio淹没系数submergence coefficient流速系数velocity coefficient流量系数discharge coefficient稀释法测流dilution method for discharge measurement 示踪剂tracer标准溶液standard solution背景浓度background concentration solution稀释比dilution ratio推移质输沙率测验bed load discharge measurement器策法sampling method坑测法pit method沙波法dune tracking method床沙测验bed material measurement照相法photographic method打印法stamp pad method床沙采样器bed material sampler悬移质采样器suspended sediment sampler瞬时式采样器instantaneous sampler积时式采样器time-integrating sampler瓶式采样器bottled sampler皮囊式采样器collapsible sample泵式采样器pumping sampler调压式采样器pressure adjustable sampler同位素测沙仪radioisotope sediment concentration meter 光电测沙仪photoelectric sediment concentration meter 振动式测沙仪vibrational sediment concentration meter 推移质采样器bed load sampler网式采样器basket-type sampler吸管pipet光电颗分仪photoelectric particle size meter比重计(密度计)hydrometer泥沙沉降sediment settling沉降速度settling velocity平均沉速mean settling velocity絮凝flocculation反凝剂defloeculant粒径particle diameter中数粒径median particle diameter平均粒径mean particle diameter等容粒径nominal diameter投影粒径projected diameter三轴平均粒径triaxial mean particle diameter几何平均粒径geometric mean particle diameter筛析粒径sieve diameter沉降粒径settling diameter粒径组fraction of particle size颗粒级配grain-size distribution颗粒级配曲线grain-size distribution curve单样颗粒级配index sample grain-size distribution垂线平均颗粒级配mean grain-size distribution in a vertical对照断面check cross-section控制断面control cross-section消减断面attenuation cross-section水样保存water-sample preservation检出率detected ratio超标率over-limit ratio痕迹量trace未检出nonreadout回收率recovery ratio溶解气体采样器dissolved gases sampler冰情观测ice-regime observation固定点冰厚测址fixed-point ice thickness measurement 冰情目测visual observation of ice regime冰情符号ice code冰情图ice-regime charta初冰日期first-ice date封冰日期freeze-up date解冻日期break-up date终冰日期end ice date封冻历时freeze-up duration水浸冰厚thickness of immersed ice敲露水面宽open-water width冰流量ice discharge等深点流速改正法revised isobath-velocity method流速过程线改正法revised velocity-hydrograph method有效潮差significant tidal range负波高negative wave height水库水文测验hygrometry of reservoir入库水量reservoir inflow出库水量reservoir outflow水库供水reservoir water supply水库弃水surplus water released frome reservoir水库蓄水量reservoir storage水库蓄水变量variation of reservoir storage水库蓄水变率rate of reservoir storage change坝上水位stage behind dam库区水位stage in reservoir region水库淤积测量reservoir sedimentation survey水库淤积量reservoir sedimentation volume地形法method of topographic survey断面法method of cross-section survey淤积形态morphology of reservoir deposition淤积三角洲sedimentation delta淤积物密度dry density of reservoir deposition岩溶地区水文调查hydrologic investigation in karst areas 实际地表集水面积actual surface colleting area交换水量exchange water沙量调查silt-quantity investigation水质调查water quality investigation调查区investigation zone水文实验研究experimental research in hydrology 代表流域representative basin实验流域experimental basin相似流域similar basin径流实验研究experimental research in runoff径流场runoff plot人工降雨装置artificial rainfall device蒸发实验研究experimental research in evaporation 蒸发池evaporation tank土壤蒸发器soil evaporator蒸散器evapotranspirometer农田蒸发器evaporator for agricultural land蒸渗仪lysimeter地下水均衡场groundwater balance plot合理性检查rational examination电算整编processing by computer水文年鉴water year-book测站考证station examination站年station year平均值mean value极值extreme value加权平均法weighted mean method断流水位stage of zero flow河干river of zero flow水文过程线hydrograph水文综合过程线synthetic hydrograph等值线isopleth分布曲线distribution curve水文特征值hydrologic characteristic value 径流总量total runoff径流模数runoff modulus径流系数runoff coefficient洪峰flood peak洪水流量peak discharge洪水总量flood volume输沙量sediment runoff输沙模数modulus of sediment runoff水位流量关系stage-discharge relation连时序法chronological method绳套曲线loop curve流量过程线法discharge hydrograph method潮汐要素法tidal factor relation method定潮汐要素法constant tidal factor relation method合轴相关法coaxial correlation method一潮推流法method of discharge computation for a single tide水位流量关系single-valuedprocessing of stage-discharge relation关系曲线延长extension of relation curve流率表rating table单断沙关系index and cross-section average sediment concentration relation单断沙关系曲线法index and cross-section aerage sediment concentration relation curve method水位单断沙比关系曲线法stage versus ratio of index and cross-section average sediment concentration relation curve method单断沙比过程线法hydrograph method of index and cross-section average sediment concentration ratio单样过程线法hydrograph method of index sediment concentration自由度degree of freedom真值true value测量值(实测值)measured value最或然值most probable value误差error绝对误差absolute error相对误差relative error插机误差(偶然误差)random error系统误差systematic error允许误差permissible error平均误差mean error最大误差(极限误差)maximum error伪误差(粗差)spurious方差variance标准差standard deviation相对标准差relative standard deviation离差(偏差)deviation闭合差closure error平差adjustment精确度(总精度)accuracy精密度precision准确度correctness垂线抽样误差(M型误差)measuring vertical sampling error 数据库data base分布式数据库distributed type data base集中式数据库concentrated type data base网络式数据库network type data base层次数据库laminarization data base关系数据库relation data base数据模型data model关系数据模型relation data model层次数据模型laminarization data model网状数据模型network data model数据量data bulk结点node数据处理data processing数据存贮data storage数据检索data retrieval数据输入data input数据输出data output数据库文件data base file水文数据库hydrologic data base水文基本数据库hydrologic basic data base湖泊水文预报hydrologic firecasting of lake施工水文预报hydrologic forecasting for construction period潮汐预报tidal prediction泥沙预报sediment forecasting旱情预报soil moisture forecasting地下水动态预报groundwater regime forecasting预见期forecast lead time短期水文预报short-term hydrologic forecasting中长期水文预报medium and long-term hydrologic forecasting超长期水文预报extended long-term hydrologic forecasting预报误差forecast error作业预报operational forecasting预报方案forecast scheme评定标准accuracy standard方案合格率qualified ratio of scheme确定性系数deterministic coefficient汛seasonal flood春汛spring flood伏汛summer flood秋汛autumn flood汛期flood season防汛flood defence报汛站flood-reporting station报汛站网flook-reporting network常年水情站perennial hydrologic reporting station 汛期水情站hydrologic reporting station inflood season辅助水清站网auxiliary hydrologic reporting network 洪水警报flood warning点雨量point rainfall面雨量areal rainfall泰森多边形Thiessen polygon等雨量线法isohyetal method产流runoff yield蓄满产流runoff yield at natural storage超渗产流runoff yield in excess of infiltration产流面积area of runoff yield地表径流(直接径流)direct runoff地面流(坡面流)surface flow of mire壤中流prompt subsurface flow前期影响雨量antecedent rainfall土壤缺水量soil moisture deficit下渗能力曲线(下渗曲线)infiltration capability curve 初损initial losses后损(后渗)continuing losses坡面汇流overland flow concentration河网汇流(河槽汇流)river network flow concentration 地下汇流groundwater flow concentration汇流曲线flow concentration curve流域汇流曲线basin flow concentration curve坡面汇流曲线overland flow concentration curve河网汇流曲线river network flow concentration curve地下汇流曲线groundwater flow concentration curve流域汇流时间basin flow concentration time洪峰滞时peak time lag流域滞时basin time lag等流滞时isochrone单位线unit hydrograph经验单位线empiricat unit hydrograph综合单位线synthetic unit hydrograph瞬时单位线instantaneous unit hydrograph地貌瞬时单位线geomorphologic instantaneous unit hydrograph坡地单位线slope unit hydrograph河网单位线river network unit hydrographS-曲线S-curve无因次单位线dimensionless unit hydrograph退水曲线recession curve水文模型hydrologic model水文物理模型(水文实体模型)hydrophysical model比尺模型scale model比拟模型analogue model水文数学模型hydrologic mathematic model水文概念模型physically-based hydrologic mathematic model水文数学物理模型deterministic hydrologic model确定性水文模型stochastic hydrologic model分散式模型distributed model集总式模型lumped model线性水温模型linear hydrologic model非线性水文模型nonlinear hydrologic model时不变水文模型time-invariant hydrologic model时变水文模型time-variant hydrologic model流域水文数学模型hydrologic mathematic model of watershed模型结构model structure模型参数model parameter模型误差model error模型率定model calibration模型检验model verification水文模拟hydrologic simulation遥测终端机telemetry terminal meter中继机relay meter前置通信控制机preset communication controller自报式系统self-reporting system查询-应答式系统polling-answerback system混合式系统mix system时分制遥测系统time-division telemetry system频分制遥测系统frequency-division telemetry system误码率probability of word error接受率receiving probability数据收集平台data collection platform水文计算(水文分析计算)hydrologic computation设计站design station设计流域design watershed代表站representative station参证站bench-mark station典型年(代表年)typicyear水文系列hydrologic series同步系列synchronous series系列代表性series representativeness柱状图histogram诺谟图monogram输沙量计算(固体径流计算)computation of sediment runoff水库回水计算computation of reservoir backwater水库淤积计算computation of reservoir sedimentation水库下游河道冲刷计算computation of degradation belowreservoir溃坝洪水计算evaluation of dam break flood感潮河段水力计算hydraulic calculation for tidal reach水文统计hydrologic statistics总体population样本sample样本容量sample size随机变量random variable随机系列random series累计频率(频率)cumulative frequency经验频率empirical frequency水文频率分布曲线(水文频率曲线)hydrologic frequency distribution curve皮尔逊分布Pearson distribution对数正态分布log normal distribution频率分析frequency analysis随机模拟stochastic simulation时间序列time series随机水文分析hydrologic stochastic analysis趋势项trend term周期项cycle term随机项stochastic term调和分析(谐波分析)harmonic analysis潜分析spectrum analysis噪声noise回归分析(相关分析)regression analysis相关系数correlation coefficient自回归分析autoregression analysis逐步回归分析stepwise regression analysis设计供水design flood溢洪道设计洪水spillway design flood分期设计洪水stage design flood施工设计洪水design flood for construction period 校核洪水check flood实测洪水observed flood调查洪水investigated flood古洪水paleoflood坝址洪水dam-site flood入库洪水reservoir inflow flood分项调查法item-by-item investigation method 降雨径流模型法rainfall-runoff model method蒸发差值法evaporation difference method径流年内分配annual distribution of runoff径流多年变化multiyear variation of runoff丰水期high-water period平水期normal-water period枯水期(枯季)low-flow period丰水年wet year平水年(中水年)normal year枯水年dry year特枯水年extraordinary dry year连续丰水年continuous wet years连续枯水年continuous dry years水文年鉴water year设计暴雨design storm设计雨型design storm pattern暴雨路径storm track暴雨时程分配time distribution of storm暴雨地区分布special distribution of storm暴雨参数等值线storm parametric isoline map 点面换算系数point-area conversion coefficient 点面关系point-area relationship定点定面关系fixedpoint-fixed area relationship可能最大露点probable maximum dew point暴雨移置改正storm transposition correction流域形状改正watershed shape correction水汽改正moisture correction入流障碍改正inflow obstacle correction综合改正synthetic correction暴雨幅合分量convergence component of storm地形增强因子topographic increasing factor等百分数法isopercental method可能最大洪水probable maximum flood涝surface water logging渍subsurface waterlogging排涝surface waterlogging control排渍subsurface waterlogging control排涝规划waterlogging control planning排涝标准standard for waterlogging control排涝计算computation of waterlogging control设计排涝流量design discharge for surface drainage设计排渍流量design drainage discharge of subsurfacewaterlogging control设计排涝水位design water level for surface drainage水资源危机water resources crisis水荒water famine水能资源(水力资源)waterpower resources河流水能资源waterpower resources of river潮汐水能资源tidal power resources可开发的水能资源developable waterpower resources 水资源评价water resources assessment水资源基础评价water resources basic assessment水量评价water quantity assessment水质评价water quality assessment地表水资源评价surface water resources assessment地下水资源评价groundwater resources assessment水资源评价指标indexes of water resources assessment 水资源总量total amount of water resources地表水资源量surface water resources amount地下水资源量groundwater resources amount可利用量utilizable water地下水可开采量groundwater available yield可供水量available water supply径流调节runoff regulation综合利用水库调节(多目标水库调节)reservoir regulation for comprehensive utilization水库调洪reservoir flood routing水库供水调节reservoir regulation for water supply水电站径流调节runoff regulation of hydropower regulation水库反调节reregulating reservoir水库群调节multi-reservoir regulation径流调节计算computation of runoff regulation时历法(长系列操作法)chronological series method概率法(数理统计法)probability method随机模拟法stochastic simulation method调节周期regulating period目标函数objective function约束方程constraint equation状态变量state variable决策变量decision variable数学规划mathematic programming线性规划linear programming非线性规划nonlinear programming水库防洪调度flood control scheduling of reservoir水库实时调度real-time reservoir scheduling水库群调度multi-reservoir scheduling水库预报调度reservoir scheduling based on forecast抽水蓄能pumped storage水沙调度scheduling of water and sediment水环境water environment水环境要素(水环境基质)water environment elements水环境背景值(水环境本底值)water environmental background value水生态系统aquatic ecosystem化学径流chemical runoff环境用水environmental water环境水文学environmental hydrology环境水力学environmental hydraulics环境水化学environmental hydrochemistry地下水超量开采groundwater overdraft人工补给(人工回灌)artificial recharge地下水降落漏斗groundwater depression cone化学水污染chemical water pollution无机物水污染water pollution by inorganic substances有机物水污染water pollution by organic substances有毒物质水污染water pollution by toxic substances放射性水污染radioactive water pollution热污染thermal pollution生物水污染water pollution by organism富营养化eutrophication赤潮red tide次生水污染secondary water pollution地下水污染groundwater pollution水污染常规分析指标index of routine analysis for water pollution水污染遥感监测remote-sensing monitoring of water pollution污染物pollutant污染物迁移transport of pollutant机械迁移physical transport物理-化学迁移physicochemical transport人为污染源artificial pollution source天然污染源natural pollution source污染源调查investigation of pollution sources污染源控制pollution source control水质参数water quality parameters水质模型water quality model水温模型water temperature model水质生物评价biologic assessment of water quality水环境效益water environmental effect水污染环境效应environmental effect of water pollution水环境影响评价water environmental impact assessment水环境保护water environmental protection水质规划water quality planning河流水质规划river water quality planning水库水质规划reservoir water quality planning水污染综合防治规划planning of comprehensive water pollution control水源保护区protection zone of water source水质管理water quality management水污染源管理water pollution source management蒸发evaporation径流runoff水位stage流速velocity流量discharge含沙量sediment concentration输沙率sediment discharge水温模型water temperature冰凌ice run水质water quality下垫面underlying surface水文情势hydrologic regime水文效应hydrologic effect水文循环(水循环)hydrologic cycle水量平衡water balance热量平衡heat balance盐量平衡salt balance大气水汽含量atmospheric water vapour content 大气水汽输送atmospheric water vapour transport 水汽输送通量atmospheric water vapour flux雨rain降雨面积rainfall area降雨分布rainfall distribution暴雨洪水storm flood冰凌洪水(凌讯)ice flood冰雪洪水ice-snow melt flood雨雪混合洪水rain and snowmelt flood山洪flash flood溃坝洪水dam-break flood大气环流atmospheric circulation天气形势(环流形势)weather situation天气过程weather process天气系统weather system行星尺度天气系统planetary scale weather system 天气尺度天气系统synoptic scale weather system 中小尺度天气系统meso and micro-scale weather 风暴潮storm surge风暴中心storm center西风槽westerly trough东风波easterly wave低压槽trough高压脊ridge副热带高压subtropic high温带extratropic zone寒带frigid zone。
适用于新教材2024版高考地理一轮总复习考点规范练13湘教版

考点规范练13(2022河北廊坊十二中月考)下图是以极地为中心的某半球气压带、风带分布示意图(箭头表示风向)。
读图,完成1~2题。
1.当①气压带在此半球分布面积最小时,可能发生的地理现象是( )A.恒河流域正值丰水期B.巴西高原上草木茂盛C.昼长上海大于广州D.地球公转速度较慢2.下列气候类型的形成,与气压带、风带的分布和移动无关的是( )A.热带雨林气候B.地中海气候C.温带季风气候D.热带季风气候答案 1.B 2.C解析第1题,结合图中风向可判断该半球为北半球。
①为赤道低气压带,在北半球分布面积最小,说明气压带、风带位置向南偏移幅度达全年最大,为北半球的冬季。
恒河主要流经北半球热带季风气候区,丰水期在夏季,A错误;巴西高原属热带草原气候,此时为湿季,巴西高原上草木茂盛,B正确;上海纬度高于广州,则冬季昼长小于广州,C错误;此时地球公转接近近日点,公转速度较快,D错误。
第2题,热带雨林气候是常年受赤道低气压带控制形成的;地中海气候是西风带和副热带高气压带交替控制形成的;热带季风气候的夏季风是由气压带、风带的季节移动形成的;温带季风气候的成因为海陆热力性质的差异,C符合题意。
(2022河北部分学校联考)下图为我国某地各月气温、降水量、相对湿度分布图。
读图,完成3~4题。
3.图示气候类型为( )A.热带季风气候B.温带季风气候C.亚热带季风气候D.高原山地气候4.据图示信息可知该地( )A.春季日照时数多于夏季B.河流流量稳定C.易受风暴潮影响D.夏秋季森林火险等级高答案 3.C 4.A解析第3题,读图可知,该地降水集中在夏秋季节,年降水量大于800毫米,最冷月平均气温为6℃左右,介于0℃至15℃之间。
因为该地为我国某地,所以该地应为亚热带季风气候,C正确;热带季风气候最冷月平均气温大于15℃,A错误;温带季风气候和我国高原山地气候最冷月平均气温低于0℃,B、D错误。
第4题,该地春季降水量小,晴天多,阴雨天少,夏季降水量大,多阴雨天气,春季日照时数多于夏季,A正确;该地位于我国季风区,河流主要靠大气降水补给,夏秋季节降水量大,河流水量大,所以流量并不稳定,B错误;风暴潮影响沿海地区,无法确定该地一定位于沿海地区,C错误;该地夏秋季节降水量大,森林火险等级较低,D错误。
陆地水体之间的相互关系
第一节陆地水体之间的相互关系课程标准绘制示意图,解释各类陆地水体之间的相互关系。
学习目标1.结合资料,说出陆地上的主要水体类型。
2.绘制河流补给方式示意图,解释各水体之间的相互关系。
一、陆地上的主要水体类型1.地球上的水主要有陆地水、海洋水和大气水三种存在形式。
海洋水储量最多,占全球水储量的96.538%;大气水分布最广;陆地水储量较少,但类型多样,主要包括河流水、湖泊水、地下水、沼泽水、土壤水、冰川水、生物水等。
2.我们通常所说的水资源是指陆地上的淡水资源,其中储存水量最多的是冰川,但目前我们利用的很少。
目前人类利用的淡水资源主要是河流水、湖泊水和浅层地下水。
二、陆地水体之间的相互补给1.由图1可知,水体之间存在相互补给关系的是河流水与湖泊水、河流水与地下水、湖泊水与地下水。
2.图2中左图表示丰水期河流水与地下水的补给关系,此时河流水补给地下水。
3.图2中右图表示枯水期河流水与地下水的补给关系,此时地下水补给河流水。
4.各水体的相互补给状况取决于水位高低和流量大小的动态变化。
思考俗话说“井水不犯河水”。
请根据“陆地水体的相互补给关系”,分析这种说法是否科学。
答案不科学。
陆地各水体之间存在水源相互补给的关系。
井水是地下水的一种,它与河流水之间具有相互补给的关系,所以“井水不犯河水”的说法从水循环的角度看是不科学的。
探究点河流补给类型与水文特征水是维系生命与健康的基本需求,地球虽然有71%的面积为水所覆盖,但淡水资源极其有限,可被人类利用的水资源更少,仅占水体总量的十万分之七。
下图为陆地上的水体及其相互关系图。
结合图,回答下列问题。
1.图中河流补给类型有哪些?最主要的是哪种补给?答案大气降水、冰川水、湖泊水、地下水补给等。
大气降水是最主要的补给类型。
2.哪一种补给是单向的?答案冰川水补给河水。
3.河水与湖泊水之间是怎样互相补给的?画出示意图。
答案当河水水位高于湖泊水位时,河水补给湖泊水;当河水水位低于湖泊水位时,湖泊水补给河水。
高考地理五年真题分类汇编(2017-2021) 第16讲 自然地理环境的整体性与差异性(教师版)
高考地理五年真题分类汇编(2017-2021)第16讲自然地理环境的整体性与差异性一、单选题1.(2021·全国乙卷)苔原带植被多由低矮灌⽊及苔藓地⽊组成,⽊多数灌⽊为极地特有种。
苔原带横跨亚欧⽊陆与北美⽊陆,呈东西向延伸,仅存在于北冰洋沿岸陆地及岛屿,宽度较⽊。
第四纪冰期,苔原带⽊度扩展⽊我国阿尔泰⽊—阴⽊一线.其后,随着⽊温升⽊,苔原不断向北及⽊海拔退却。
据此完成下列问题.(1)受全球⽊候变暖的影响,亚欧⽊陆苔原带将()A.整体向北移动B.整体向南移动C.⽊积扩⽊D.⽊积缩⽊(2)苔原带横跨亚欧⽊陆,表明()A.苔原植被对温度差异不敏感B.亚欧⽊陆北部湿度东西向差异⽊C.苔原植被对湿度差异不敏感D.亚欧⽊陆降⽊北部最多(3)祁连⽊地针叶林带以上未发现极地特有种灌⽊,可能是因为祁连⽊地()A.⽊前针叶林带以上⽊温⽊B.⽊前基带⽊温⽊C.冰期针叶林带以上⽊温⽊D.冰期基带⽊温⽊【答案】(1)D(2)B(3)D【考点】全球气候变化对人类活动的影响,地域分异的基本规律【解析】【点评】气候变暖对对生态系统的影响:2.(2021·浙江)洞庭湖区水域与陆地交错,从陆地到水底分布着森林、灌丛、草甸和水生植物等植被类型。
完成下列小题。
(1)洞庭湖区的植被分布,反映了自然地理环境的()A.垂直分异规律B.地方性分异规律C.纬度地带分异规律D.经度地带分异规律(2)影响洞庭湖区植被差异的主要因素有()①地形②水分③热量④土壤A.①②B.②③C.③④D.①④【答案】(1)B(2)A【考点】地域分异的基本规律【解析】【分析】(1)洞庭湖区从陆地到水底分布着森林、灌丛、草甸和水生植物等植被类型,是洞庭湖区独特的自然环境条件影响下形成的,属于小尺度的地域分异,反映了自然地理环境的地方性分异规律。
B符合题意。
(2)根据上题的分析,洞庭湖区从陆地到水底,地形从出露地表到隐于水下,水分从少到多,是导致洞庭湖植被差异的主要因素,故洞庭湖分布着森林、灌丛、草甸和水生植物等植被类型差异的影响因素是地形和水分,而不是热量和土壤。
洞庭湖区主要森林类型土壤持水性能研究
洞庭湖区主要森林类型土壤持水性能研究王忠诚;邓秀秀;崔卓卿;张展;华华【摘要】采用野外定位观测与室内实验相结合的方法,对洞庭湖区具有代表性的森林土壤持水性能进行研究.结果表明:(1)土壤容重随着土壤深度的增加而增大,土壤表层容重变化幅度大于土壤深层.不同林地土壤容重变化范围为1.03~1.53 g·cm3,平均值大小表现为杉木林(1.18 g·cm-3)<杨树林(1.36 g·cm3).(2)林地土壤孔隙度和非毛管孔隙度随着土壤深度增加而减小,土壤孔隙度平均值大小为杨树林(33.15%)<杉木林(38.53%). (3)土壤有效蓄水量平均值大小为杨树林(2 206.50 t·hm2)<杉木林(2 235.91 t·hm-2).相对于杨树林而言,杉木林的土壤蓄水能力较强.(4)土壤的持水性能和土壤物理性质指标之间的相关性分析表明,林地土壤的最大蓄水量和有效蓄水量主要取决于土壤的孔隙状况.【期刊名称】《中南林业科技大学学报》【年(卷),期】2016(036)005【总页数】6页(P79-84)【关键词】林地土壤;物理性质;持水性能;洞庭湖【作者】王忠诚;邓秀秀;崔卓卿;张展;华华【作者单位】中南林业科技大学林学院,湖南长沙410004;中南林业科技大学林学院,湖南长沙410004;中南林业科技大学林学院,湖南长沙410004;中南林业科技大学林学院,湖南长沙410004;株洲市林业科学研究所,湖南株洲412002【正文语种】中文【中图分类】S714.7林地土壤的最大蓄水量和有效蓄水量主要取决于土壤的孔隙状况。
森林生态系统是维持和调节陆地生态系统平衡和改善生态环境的基础[1],森林的水源涵养功能是森林生态系统的重要功能之一。
森林土壤是降雨继林冠层、灌草层和枯落物层截留后的第四个主要作用层[2],对降水的分配调节作用十分明显。
国内外许多研究者对森林水源涵养功能进行了较深入的研究,包括山地、自然保护区、林区、水库等范围内林地持水性能[3-7],然而对洞庭湖区森林土壤持水性能的研究相对较少。
初一英语地理术语单选题45题
初一英语地理术语单选题45题1. The _____ is a large area of flat land. It is usually very fertile and good for farming.A. mountainB. plainC. desertD. forest答案:B。
解析:mountain是山,是高耸的地形,不是平坦的;desert是沙漠,主要特征是干旱,不是平坦且肥沃适合耕种的;forest 是森林,是树木众多的区域,不是平坦的大片土地。
而plain是平原,符合大片平坦且适合耕种的特征。
2. The _____ is a long, narrow area of water that flows into a sea or an ocean.A. lakeB. riverC. pondD. waterfall答案:B。
解析:lake是湖,是大面积的水域,但不流入大海或大洋;pond是池塘,面积较小且不流入大海或大洋;waterfall是瀑布,是河水垂直下落的部分而不是流入大海或大洋的狭长水流。
river是河流,符合长且狭窄且流入大海或大洋的特征。
3. Mount Everest is the highest ____ in the world.A. plainB. valleyC. mountainD. hill答案:C。
解析:plain是平原,与高山无关;valley是山谷,不是高耸的地形;hill是小山丘,而Mount Everest是世界最高峰,是mountain而不是hill这种相对较矮的山丘。
4. A(n) _____ is a deep, narrow passage between mountains.A. plateauB. canyonC. bayD. cape答案:B。
解析:plateau是高原,不是两山之间的狭窄通道;bay 是海湾,与山之间的通道无关;cape是海角,也不是两山之间的通道。
- 1、下载文档前请自行甄别文档内容的完整性,平台不提供额外的编辑、内容补充、找答案等附加服务。
- 2、"仅部分预览"的文档,不可在线预览部分如存在完整性等问题,可反馈申请退款(可完整预览的文档不适用该条件!)。
- 3、如文档侵犯您的权益,请联系客服反馈,我们会尽快为您处理(人工客服工作时间:9:00-18:30)。
J. Geogr. Sci. 2011, 21(1): 135-149DOI: 10.1007/s11442-011-0834-9© 2011 Science Press Springer-VerlagAnalysis of vegetation response to rainfall with satellite images in Dongting LakeJIANG Weiguo1,2, *HOU Peng1,3, ZHU Xiaohua4, CAO Guangzhen5,LIU Xiaoman3,4, CAO Ruyin11. State Key Laboratory of Earth Process and Resource Ecology, Beijing Normal University, Beijing 100875, China;2. Academy of Disaster Reduction and Emergency Management, Beijing Normal University, Beijing100875, China;3. Satellite Environment Center, MEP, Beijing 100094; China;4. Institute of Geographic Sciences and Natural Resources Research, CAS, Beijing 100101, China;5. Key Laboratory of Radiometric Calibration and Validation for Environmental Satellites, China MeteorologicalAdministration, Beijing 100081, ChinaAbstract: We analyzed the Normalized Difference Vegetation Index (NDVI) from satellite images and precipitation data from meteorological stations from 1998 to 2007 in the Dongting Lake wetland watershed to better understand the eco-hydrological effect of atmospheric pre-cipitation and its relationship with vegetation. First, we analyzed its general spatio-temporal distribution using its mean, standard deviation and linear trend. Then, we used the Empirical Orthogonal Functions (EOF) method to decompose the NDVI and precipitation data into spa-tial and temporal modes. We selected four leading modes based on North and Scree test rules and analyzed the synchronous seasonal and inter-annual variability between the vegetation index and precipitation, distinguishing time-lagged correlations between EOF modes with the correlative degree analysis method. According to our detailed analyses, the vegetation index and precipitation exhibit a prominent correlation in spatial distribution and seasonal variation. At the 90% confidence level, the time lag is around 110 to 140 days, which matches well with the seasonal variation.Keywords: eco-hydrology; precipitation; vegetation; remote sensing; wetland; Dongting Lake1 IntroductionGrowth state of vegetation is very important to the health of terrestrial ecosystem and bio-sphere, which is close to the rainfall. The relationship between precipitation and vegetation has been paid more attention to by many researchers from different disciplines (Woodell et al., 1969; Sala et al., 1988; Sun et al., 2001; Cui et al., 2009), such as eco-hydrology, ecol-ogy, meteorology. In general, precipitation affects the floristic composition (Sala et al., 1988) Received: 2010-08-05 Accepted: 2010-09-20Foundation: National Natural Science Foundation of China, No.40701172; No.40671122; The International Program for Cooperation in Science and Technology, No.2007DFA20640; National Science and Technology SupportingItem, No.2008BAC34B01; The Beijing Municipal Science and Technology Plan, No.D08040600580801 Author: Jiang Weiguo (1976–), Ph.D, specialized in wetland ecology and flood remote sensing, E-mail: jwg@*Corresponding author: Hou Peng (1978–), Ph.D, specialized in environment remote sensing, E-mail: houpcy@ /content/1009-637X136 Journal of Geographical Sciences and distribution (Woodell et al., 1969) on an annual scale. However, vegetation growth fea-tures, including germination, survival, and leaf area, are often related to seasonal and monthly variations of rainfall (Beatley, 1967; Ackerman, 1979; Specht et al., 1989; Bertiller et al., 1991; Lázaro R, 2001). Although the relationship between precipitation and vegeta-tion is well understood globally, it varies from region to region and in different kinds of ecosystems (Chandrasekar et al., 2006). The NDVI, as one type of vegetation index, is a credible indicator reflecting the vigor of vegetation and can be obtained from many satellite platforms, including NOAA/AVHRR (1981-), EOS/MODIS (1999-), SPOT (1998-), and FY (2008-). The importance of spatial and temporal scales in ecology makes remote sensing become one of the key avenues to research their relationship. The wide spatial coverage and high quality available through satellite imagery allows this data to perform well in large scale ecological studies. Many researchers are trying to determine their relationship and in-teractions with the help of the NDVI (Normalized Difference Vegetation Index) in different disciplines (Sharon et al., 1990; Nezlin et al., 2005; Chandrasekar et al., 2006; Anup et al., 2007). However, no such study has been undertaken in humid and wetland regions of central China. As one of the most important ecosystems, the wetlands form a major feature of the landscape in almost all parts of the world, and humid is its remarkable features. So that, we collected NDVI remote sensing images and atmospheric precipitation in the Dongting Lake Wetland watershed from 1998 to 2007 in this research. The eco-hydrological effect of pre-cipitation and vegetation response to rainfall was analyzed with the EOF (Empirical Orthogo-nal Functions) and correlation analysis. The spatial distribution shows general similar patterns. In the temporal correlation, the time lag effect seems to be about 110 to 140 days. The eco-hydrological effect of atmospheric precipitation clearly matches the seasonal variation.2 Study siteDongting Lake is one of the most important international wetlands; its watershed covers 262,800 km2 in the middle reaches of Changjiang River, China. It consists of three parts: East, South and West Dongting Lake, which were on the List of Wetlands of International Importance in 1992, 2002, and 2002, respectively, and is thought of as a tremendous biology gene depot by many international and Chinese nature protection organizations. In this wa-tershed, about 211,800 km2 (80.98%) belong to Hunan Province, so that Dongting Lake wa-tershed in Hunan Province is selected as the study region. This region has a continental monsoon humid subtropical climate, with about 1200–1700 mm of precipitation per year. The annual fluctuation of precipitation is less than the seasonal change. Most of the rainfall occurs in the summer and is up to 40%–60% of the whole year. The high rainfall results in flourishing vegetation. In this watershed, the main type of ecosystem is wetlands, and its total acreage reaches 56,000 km2, which is 26.44% of the region. The eco-hydrological rela-tionship between vegetation and atmospheric precipitation is significant to wetland man-agement in this region. The sketch of the study region is shown in Figure 1.3 Data collection and methodology3.1 Empirical Orthogonal Functions (EOF) methodThe primary remote sensing data we used is the NDVI product of SPOT VEGETATION,JIANG Weiguo et al.:Analysis of vegetation response to rainfall with satellite images in Dongting Lake 137Figure 1 Dongting Lake wetland watershed regionwith a spatial resolution of 1 km, higher than the AVHRR NDVI (with a spatial resolution of8 km). The product is maximum value composite syntheses, based on daily images with the highest NDVI of an individual pixel for any given geographic coordinate, which helps to ensure the coverage of all landmasses worldwide with a minimum cloud cover effect. On the other hand, the narrower band width in the red and NIR (Near Infrared) wavelengths of SPOT helps to enhance vegetation discrimination. In this research, we selected NDVI re-mote sensing images from April 1998 to October 2007. Real NDVI were retrieved from the image, according to the equation: y =ax + b, where y is the NDVI value, x is the digital number of the image, and a and b are coefficients equal to 0.004 and –0.1, respectively. Pre-cipitation data observed with rain gauges in the Dongting Lake wetland watershed were ob-tained from the CMA (China Meteorological Administration) and were interpolated to raster layers with the IDW (Inverse Distance Weighted) method in GIS before analysis, with a spatial resolution of 1 km. In this region, there are about 25 important weather stations.To analyze the spatio-temporal variability of the NDVI and precipitation data, the EOF analysis method was used. EOF was invented by Lorenz (1956) and has been proved to be a good tool to extract a compact or simplified but “optimal” representation of data with both space and time dependence. EOF can be regarded as a kind of aligned eigenvectors, leading EOF modes to describe the spatially coherent pattern. It can convert successive data in spaceinto temporal and spatial modes. Thus, NDVI and a rainfall matrix X consisting of M linesand N columns, with each grid value x being the NDVI or rainfall data, can be decomposedinto space modes and a time index (Figure 2). M is the number of spatial sample points, andN is the number of time sample points.According to the principles of EOF, all sequence data distribution characters can be dele-gated with the principal components. How many modes should be retained for analysis? Onetest rule is to consider only those modes with eigenvalues over 1. In this research, we con-ducted a significance test by the North method (North 1982) and Scree test rules (Cattell,138Journal of Geographical Sciences11121121222211121212221212121112121(observation data matrix )(spatial function matrix )j n j n m m i i ij in m m mm m m mj mn n x x x x x x x x v v v v v v X V x x x x v v v x x x x X V t t t t T ⎡⎤⎢⎥⎡⎤⎢⎥⎢⎥⎢⎥⎢⎥⎢⎥==⎢⎥⎢⎥⎢⎥⎢⎥⎢⎥⎣⎦⎢⎥⎢⎥⎣⎦=⇒⇓""""""####""###"####"""22212(temporal cofficient matrix )n m m mn t t t t t ⎡⎤⎢⎥⎢⎥⎢⎥⎢⎥⎢⎥⎣⎦"###"Figure 2 Principle of empirical orthogonal functions1966) to recognize which mode has physical meaning in all modes. North thinks that if there are N samples, only when the difference of the eigenvalue λ between two adjacent modes is greater than λ(2/n)0.5, can the adjacent modes be considered as significant and valuable. Cattell was the first to use the Scree test rule. If all eigenvalues of samples are plotted in decreasing order, the plot will look like the side of a mountain, and “scree” refers to the de-bris fallen from a mountain and lying at its base. The Scree test proposes to stop analysis at the point where the mountain ends and the debris (error) begins, namely, at the point where the declining trend stops. The correlation function between different EOF modes of NDVI and precipitation are estimated to analyze the time-lag.3.2 Spatio-temporal variation character of vegetation and precipitationThe original precipitation and vegetation index consists of many observation stations and grid data. EOF can effectively extract the spatial distribution of the variable field, which can describe the original variable field with the least and irrelated typical spatial distribution modes. All of the modes include as much information as possible about the original field, which can help to keep the variable field consist of modes similar to the original field. The spatio-temporal variation character of vegetation and precipitation can therefore be analyzed by the EOF method. The spatial modes of the vegetation index and precipitation are the typical distribution, explaining the variation frequency in spatial distribution. If the values are the same sign, there is the same trend; otherwise, there is an opposite trend. The tempo-ral indices of the vegetation index and precipitation illustrate the temporal variation.The EOF method has been used to decompose the NDVI and precipitation into a spatial mode and temporal function. We first calculated the eigenvalues of the rainfall EOF modes and NDVI EOF modes, and selected the typical modes. The 30 leading space modes were selected to be plotted on a curve (Figure 3), because the eigenvalues of the remaining modes are less than them. According to the North and Scree test rules, the four leading eigenvalues were selected to explain the spatio-temporal variation of vegetation and precipitation; their cumulative contributions of deviation are 92.94% and 51.50% for the NDVI and precipita-tion, respectively.JIANG Weiguo et al .: Analysis of vegetation response to rainfall with satellite images in Dongting Lake 139Figure 3 Rainfall eigenvalue (×104) and NDVI eigenvalue (×104) of the 30 leading EOF modes4 Results and discussion4.1 General spatio-temporal distribution of NDVI and precipitationWe analyzed the general spatio-temporal variability distribution of the vegetation index and precipitation. It is important to become acquainted with and comprehensively analyze the relationship between vegetation and precipitation. To match the temporal cycle of NDVI, the precipitation was calculated every 10 days by summing up the 10-day daily precipitation from 1998 to 2007. The statistical character of NDVI and precipitation, including the aver-age, standard deviation and linear trend, was calculated from April 1981–October 2007 (Figures 4–6). Obviously, there is more rain in the northwest, east and south areas than the middle regions; these zones correspond to zones of high NDVI values in general.As Figure 4 shows, it is easy to find the general spatial distribution and change the char-acter of the temporal cycle of atmospheric precipitation every 10 days from 1998 to 2007. In Figure 4a, the mean varies from 34.48mm to 59.83mm. The maximum mean rainfall reaches59.83; it is located in the middle-east, at one “point,” and does not coincide with a highFigure 4 General spatio-temporal variability of precipitation140 Journal of Geographical SciencesFigure 5 General spatio-temporal variability of NDVIFigure 6 Seasonal variations of NDVI and precipitation average per 10 days from 1998 to 2007JIANG Weiguo et al.:Analysis of vegetation response to rainfall with satellite images in Dongting Lake 141 vegetation index. This is because the high density of human activity in this zone results in a lower vegetation coverage. The rainfall is about 25 mm less than the maximum, located inthe middle area. Figure 4b illustrates the spatial distribution of precipitation variability and reflects the spatial distribution of total values, changing from 30.20 to 56.39.Figure 5 shows the general distribution characters of the NDVI. Figure 5a indicates the general spatial distribution of NDVI averaged over the whole period, varying from –0.05 to0.62. It is good to know that where the NDVI is less than or close to zero, where there is no vegetation coverage. Otherwise, the bigger value is, the higher the vegetation coverage ratiois. Therefore, the bigger NDVI values in the east, the northwest of the middle part, and the north and west of the study area, presents dense vegetation cover in these zones, as can be seen in Figure 5a. In addition, small NDVI values around Dongting Lake, in the south of the middle part, explain the sparse vegetation. The NDVI values along Xiangjiang River arealso smaller. Figures 5b and 5c quantitatively illustrate the spatio-temporal variability of vegetation coverage by the standard deviation and linear change tendency of the NDVI. The former mainly shows the change intensity throughout the period, while the latter mainly presents the trend of vegetation growth from 1998 to 2007. In general, the coverage regionsare consistent in the two pictures, and decrease regions are bigger than increase regions in Figure 5c. The minimum standard deviation appears in the northeast of the areas around Dongting Lake (Figure 5b), which means that the vegetation changes little inter-seasonallyand inter-annually. However, Figure 5c shows an obvious vegetation decrease trend in this area.Figure 6 illustrates the seasonal cycles of atmospheric precipitation and NDVI averagedfor every 10 days. The minimum precipitation occurs on the first and the last 10 days of January and September. Rainfall gradually increases to the maximum in May and June, then decreases to the minimum in September; after that, there is a small increase. The minimum NDVI appears in the last 10 days of February. With the increase in precipitation, the NDVI gradually increases and reaches the maximum in July and August. We note that the increase speed of rainfall and NDVI are similar, however, the decrease speed of NDVI is less thanthat of precipitation. After June, it is easy to find the time lag of NDVI compared to precipi-tation.Figures 7 and 8 show the spatial variation distribution and temporal variation of the four leading atmospheric precipitation EOF modes. In general, there are similar variation trendsin the northwest and in the southeast, with opposite trends in these two zones. The first modehas the most obvious global variation feature; this feature becomes smaller and smaller from mode 1 to 4 because more and more “point” features appear.The first precipitation EOF mode (Figure 7a) illustrates 26.01% of the total variability. There is a similar variation trend in the northwest. There are opposite distribution features between the northwest and the east and northeast. The maximum absolute value appears around Dongting Lake, where the center is. The temporal variability of precipitation mode 1is shown in Figure 8a, and the value gradually climbs to the maximum in 2002. The valuewas at its minimum in 2003, and reached a second maximum in 2006. In 2007, there was a dramatic decrease.The second precipitation EOF mode (Figure 7b) contains 10.88% of the spatial distribu-tion information for the precipitation over the years. The spatial distribution with negative142 Journal of Geographical SciencesFigure 7Spatial distribution of the four leading EOF modes of atmospheric precipitationvalues was discontinuous, because there are few positive points with similar trends to the northwest zones. The maximum absolute value appears in some places along the Xiangjiang River, that is, there are several centers. Regarding its temporal variability (Figure 8b), there was a gradual decrease from 1998 to 2001 and a dramatic increase in 2002, which was the maximum. After that, there was a decrease along a wave line that went to its minimum in 2007. Its total variety is similar to the EOF mode 1 of precipitation and is bigger than modes 3 or 4.The third precipitation EOF mode (Figure 7c) explains 8.77% of the total variability. The centers with the highest absolute values are more obvious, around Dongting Lake andJIANG Weiguo et al .: Analysis of vegetation response to rainfall with satellite images in Dongting Lake 143Xiangjiang River. However the centers with positive values in the east zones in Figure 7b are weaker. The spatial distribution zone with positive values in the northwest is smaller than that of modes 1 and 2. The 10-day and annual increasing trend are both low; the highest values appeared in 2007 (Figure 8c).The fourth precipitation EOF mode (Figure 7d) indicates 5.84% of the total variability. A comparison of precipitation EOF modes 1, 2 and 3 shows that the center with the highest value is most obvious. However, the centers with positive values are separated, and the cen-ters with negative values are centralized. The highest value appears in 2000 (Figure 8d).Figure 8 Temporal variations of the four leading EOF modes of atmospheric precipitation. The dashed line and the equation are trendsFigures 9 and 10 are the spatial variation distribution and temporal variability of the four leading NDVI EOF modes, explaining 89.36%, 1.77%, 1.40% and 0.75% of the total vari-ability. It is clear that the spatial distribution and scope are different in different modes. Temporal variability is well matched with the seasonal cycle.The first NDVI EOF mode (Figure 9a) is the most important one due to its highest ratio (up to 89.36%). A comparison of Figures 9a and 7a shows that there are good matches along Xiangjiang River, around Dongting Lake, in the northwest zones and south of the middle, which explains the eco-hydrological effect. In general, the linear trend of every 10 days of temporal variability (Figure 10a) is almost zero. The minima were in 1998 and 2000; after that, the value increased significantly until 2001 and 2002, up to the maximum. After 2002, the change was small and stable. Positive values dominated; only 1998 and 2000 were dominated by negative EOF values.The second NDVI EOF mode (Figure 9b) indicates a simple distribution of vegetation. It is associated with the opposite spatial variation feature between the northwest and southeast. In the northwest and middle zones, it matches well with the rainfall mode 2, and some144 Journal of Geographical SciencesFigure 9 Spatial distribution of the four leading NDVI EOF modes“point” features are also well matched, which may be explained by the response of the vegetation variation to that of the rainfall. The temporal variability of the second mode of NDVI (Figure 10b) is less than the first mode, and in addition, the linear trend of each 10 days is close to zero and has a decreasing trend. The maximum EOF mode 2 appears in 1999, 2003, 2004 and 2006, and the minimum occurs in 2005.The third NDVI EOF mode (Figure 9c) illustrates that there are few similar distribution characteristics between it and the first EOF mode. The general variation feature is controlled by the negative values decided by the rainfall variation feature in Figure 7c. In general, the linear trend of every 10 days of temporal variability of the third mode (Figure 10c) is theFigure 10 Temporal variation of the four leading EOF modes of NDVI. The dashed line and the equation are trendssame as the second mode; both are decreasing. Beginning in 1998, there was a gradual in-crease that reached a maximum in 2002. After that, the value decreased to a minimum in 2005. From 2005 to 2007, another increase appeared.The fourth NDVI EOF mode (Figure 9d) explains that there is a larger area with negative values than with positive values. This mode matches with the rainfall EOF mode 4 in spatial distribution. The linear trend of every 10 days of temporal variability of the fourth mode (Figure 10d) is the same as the first mode, but is more obvious. The minimum occurs in 2001 and the maximum appears in 2003 and 2004. From 1998 to 2000 and 2001 to 2003, the value gradually increases. After that, it decreased in 2006 and increased in 2007.4.2 Time-lagged correlation between vegetation and precipitationIn addition to rainfall influencing the spatial distribution of vegetation, their temporal rela-tionship is very important and distinctly expresses the eco-hydrological effect of precipita-tion. Because most vegetation in this region has obvious phonological features and the leaf’s life cycle from bud to fall is not a full year, and the main vegetation growth period is only about half a year, we analyzed the time lag over a period not exceeding 180 days (about 6 months). The least temporal interval is about 10 days, because of SPOT’s vegetation cycle. To understand the response of vegetation to a variation in precipitation, we estimated time-lagged correlations by analyzing the correlative degree between four leading EOF modes of NDVI and precipitation (Figure 11). To recognize their degree of correlation, we calculated the 90% confidence level. Like in the following, a correlation coefficient that was bigger than the 90% confidence level was effective, and we selected the biggest one to ana-lyze the relationship between vegetation and atmospheric precipitation.As Figure 11 shows, the NDVI EOF mode 1 and precipitation EOF modes 1 and 4 arepositively correlated with a time lag of about 120 and 110 days, while NDVI EOF mode 2 and precipitation EOF modes 1, 3 and 4 are about 110, 140 and 110 days, and NDVI EOF mode 3 and precipitation EOF modes 2 and 4 are about 140 and 120 days. The positive cor-relation is about 3–4 months, with good similarity, which may result from the obvious sea-sonal patterns of precipitation (maximum in spring) and vegetation (maximum in summer) (Figure 6), as more precipitation in spring results in more vegetation growth during the sub-sequent summer. The NDVI EOF mode 4 and precipitation EOF mode 3 are positively cor-related with a time lag of 20 days, although it is difficult to explain this. We believe that, compared with other modes, they contribute less, and other environmental factors (tempera-ture, solar radiation, etc.) may cause the vegetation growth to become more notable, result-ing in this shorter time lag.Regarding the negative correlation, as Figure 11 shows, the NDVI EOF mode 1 and pre-cipitation EOF modes 1, 2, 3 and 4 have negative correlations with time lags of about 40, 20,Figure 11Correlation of the four leading EOF modes of NDVI and rainfall. The dashed lines show the 90% confidence level60 and 70 days, while NDVI EOF mode 2 and precipitation EOF modes 2, 3 and 4 have time lags of about 20, 60 and 70 days, resulting from positive NDVI zones coinciding with the negative precipitation zones in the east and middle region. This can be explained by the vegetation type: in the east region, there is mainly evergreen forest, such as pine and fir. Al-though there is low rainfall in the beginning, there is higher vegetation coverage. In all of the rainfall EOF modes, the negative value zone covers the eastern region of the area, which is evergreen, but from mode 1 to 4, more and more deciduous woods were included in the negative zone (Figure 9), which causes the percentage of evergreen to be less. As a result, the time lag of NDVI EOF mode 1 and rainfall modes is longer and longer in general (Fig-ures 11a-d).5 ConclusionsIn this paper, we analyzed the Normalized Difference Vegetation Index (NDVI) from satel-lite images and precipitation data from meteorological stations from 1998 to 2007 in the Dongting Lake wetland watershed to better understand the eco-hydrological effect of at-mospheric precipitation and its relationship with vegetation. According to the analyses, some main conclusions can be drawn:(1) For landscape-level studies, satellite data unquestionably provide a large scale view not possible using any other data collection technique. High frequency and large coverage of NDVI data from SPOT and other satellite sensors provide massive datasets for synoptic scale analyses of the ecology and vegetation growth monitoring. In this research, ten years of variation in the vegetation index (from 1998 to 2007) derived from satellites observed by the SPOT remote sensing were analyzed in conjunction with 10 years of precipitation data in the Dongting Lake watershed region. The mean, standard deviation and linear trendy change images can indicate the general distribution and variation in a long period (Figure 5). It is better to turn atmospheric precipitation data observed by traditional meteorological stations into raster images by interpolation using geographic information systems software, which is helpful to learn about its distribution. Atmospheric precipitation and the normalized differ-ence vegetation index in the study region exhibit prominent correlation in spatial distribution and seasonal variation. As Figure 6 shows, the maximum in vegetation index and precipita-tion occurred during the 140th-170th and 210th-260th days.(2) Notwithstanding rainfall is very important to the vegetation growth, there are different influences in different vegetation types. That is to say, the vegetation type is thus an impor-tant factor influencing the relationship between vegetation and atmospheric precipitation. Because there are many types of vegetation, including evergreen woods, deciduous woods, shrubs, grasses and crops, although a time lag is controlled by deciduous woods as the lead-ing vegetation, a short time lag from evergreen woods is clear. On the other hand, vegetation is influenced by the solar radiation, air temperature, too. If these factors and vegetation types are taken into account in this research, this work should be too different to analyze. In this paper, only when rainfall and vegetation are taken into account, their relationship is good. Detailed analysis with the EOF method shows that there was a wide range of time lags be-tween the precipitation and vegetation index, from about 10 to 180 days, which is because the EOF modes indicate more detailed information about the vegetation and rainfall. For the estimated 90% confidence level, the time lag effect is about 110 to 140 days. AcknowledgementsAll of the data for this study were provided by the Environmental and Ecological Science Data Center for West China (WESTDC) and China Meteorological Data Sharing Service System. The authors would like to express their sincere gratitude to these sources. ReferencesAckerman T L, 1979. Germination and survival of perennial plant species in the Mojave Desert. The Southwestern Naturalist, 24: 399–408.。