福建宏观经济数据:2-9 三次产业对经济增长的贡献及拉动(1980-2018年)
福建宏观经济数据:3-16 按产业分城镇单位女性从业人员数(年底数)(2003-2018)
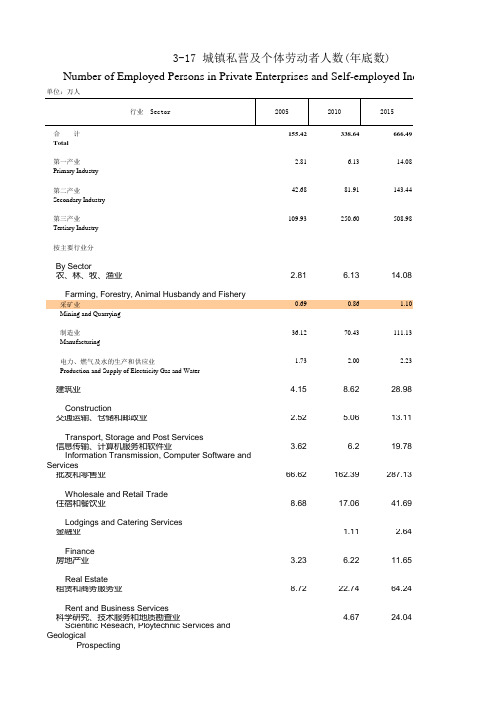
By Sector农、林、牧、渔业 2.81 6.1314.08 Farming, Forestry, Animal Husbandy and Fishery采矿业0.690.86 1.10 Mining and Quarrying制造业36.1270.43111.13 Manufacturing电力、燃气及水的生产和供应业 1.73 2.00 2.23 Production and Supply of Electricity Gas and Water建筑业 4.158.6228.98 Construction交通运输、仓储和邮政业 2.52 5.0613.11 Transport, Storage and Post Services信息传输、计算机服务和软件业 3.62 6.219.78 Information Transmission, Computer Software andServices批发和零售业66.62162.39287.13 Wholesale and Retail Trade住宿和餐饮业8.6817.0641.69 Lodgings and Catering Services金融业 1.11 2.64 Finance房地产业 3.23 6.2211.65 Real Estate租赁和商务服务业8.7222.7464.24 Rent and Business Services科学研究、技术服务和地质勘查业 4.6724.04 Scientific Reseach, Ploytechnic Services andGeologicalProspecting水利、环境和公共设施管理业0.79 1.81 Water Conservancy, Environment and Public FacilitiesManagement居民服务和其他服务业15.0320.5832.48 Resident Services and Others教育0.330.80 Education卫生、社会保障和社会福利业0.40.79 1.33 Health Care, Social Ensure and Walfare文化、体育和娱乐业 1.12 2.618.26 Culture, Sports and Entertainment公共管理和社会组织0.040.02 Public Management and Social Organizations12.5411.470.860.7192.6575.031.84 1.53 31.5925.38 12.1716.65 22.7865.81 298.179.87 60.74313.752.31 1.82 11.589.33 64.3483.02 30.2221.961.88 1.39 39.7241.661.20 1.09 1.86 1.83 11.088.92 0.010.01。
产业结构变动对经济增长的影响--基于云南省数据的案例分析

云南三次 产 业 结 构 的 演 变 历 程。从 图 1可 以 看 9 7 8年的 4 2 7 ∶ 3 9 9 ∶ 1 7 4 出,云南产业结构从 1 调整为 2 0 1 1年的 1 5 9 ∶ 4 2 5 ∶ 4 1 6 。产业结构转 变中比较突出的特点:一是云南第一产业比重由 改革开放初期的 1 9 7 8年的 4 2 7 %,逐年下降到 2 0 1 1年的 1 5 9 %,比 1 9 7 8年下降了 2 6 8 %;二 是第二 产 业 比 重 在 1 9 9 2年 前 持 续 下 降, 但 在 1 9 9 2年后 持 续 上 升,其 占 G D P份 额 相 对 平 稳, 一直在 4 0 % 左右波动;三是第三产业从初期的 1 7 4 %一直持续上升到 2 0 1 1年的 4 1 6 %,上升 幅度最大,上升了 2 4 2 %;四是 1 9 9 2年云南第 三产业占 G D P的份额首次超过第一产业。我们且 可以通过图 1做一个直观的判断:1 9 9 2年是云南 产业结构转变的一个转折点。1 9 9 2年前,第一产 业比重在下降,第二产业比重在波动中下降,第 三产业比重上升;1 9 9 2后,第一产业比重在持续 下降,第二产业比重在波动中上升,第三产业比 重在稳定上升。
产业结构变动对经济增长的影响
— — —基于云南省数据的案例分析
赵鑫铖,阿燃燃
( 云南大学 发展研究院,云南 昆明 6 5 0 0 9 1 ) 摘 要:产业结构变动是影响经济增长的重要因素。通过从国民经济核算层面、增长核算层面和人 均产出层面实证分析了产业结构变动对云南经济增长的贡献。研究表明:从国民经济核算层面看,自改 革开放以来,第二产业对云南经济增长的贡献最大,第三产业次之,第一产业为最小且其贡献不断下降; 7 3 %;从人均产出层面看,1 9 7 8- 2 0 1 1 从增长核算层面看,产业结构的调整对经济增长的贡献率达到 1 年云南劳动生产率增长中 5 0 5 3 %是由结构效应贡献的。 关键词:产业结构变动;经济增长;劳动生产率;增长核算 中图分类号:F 1 2 1 3 文献标志码:A 文章编号:1 6 7 1- 1 2 5 4( 2 0 1 4 )0 2- 0 0 6 2- 0 7
中国统计年鉴数据处理:3-9 地区生产总值(各省按三次产业和行业分,2004-2018多年对比)
0.3
29.8
69.9
106.6
4.5
44.5
51.0
106.7
3.5
41.8
54.7
107.1
8.8
46.1
45.1
108.0
6.7
48.1
45.2
108.3
8.6
46.6
44.8
108.7
6.5
44.0
49.5
106.4
50152 66616 52949
8.9
45.9
45.2
107.6
9.0
43.4
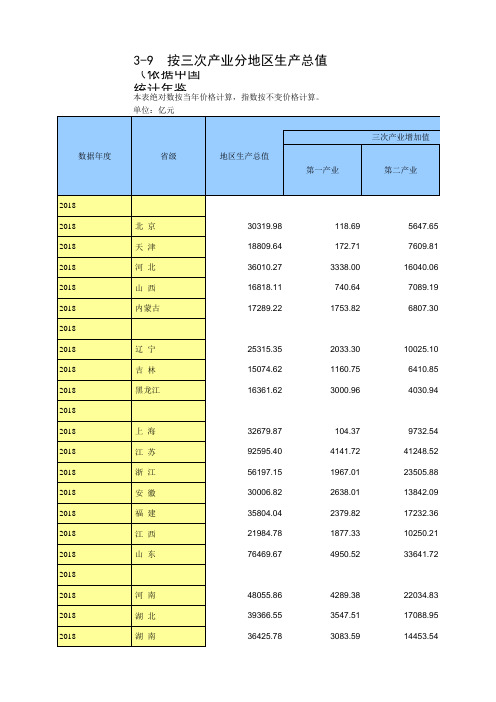
48055.86 39366.55 36425.78
118.69 172.71 3338.00 740.64 1753.82
2033.30 1160.75 3000.96
104.37 4141.72 1967.01 2638.01 2379.82 1877.33 4950.52
4289.38 3547.51 3083.59
3-9 按三次产业分地区生产总值 (依据中国 统计年鉴
本表绝对数按当年价格计算,指数按不变价格计算。
单位:亿元
数据年度
省级
地区生产总值
第一产业
三次产业增加值 第二产业
2018 2018 2018 2018 2018 2018 2018 2018 2018 2018 2018 2018 2018 2018 2018 2018 2018 2018 2018 2018 2018 2018
106.5 106.3 105.7 106.9 107.4 108.0 105.9
103.3 102.9 103.5
107.2 106.8 107.2
福建宏观经济数据:3-10 就业基本情况(2000-2018)
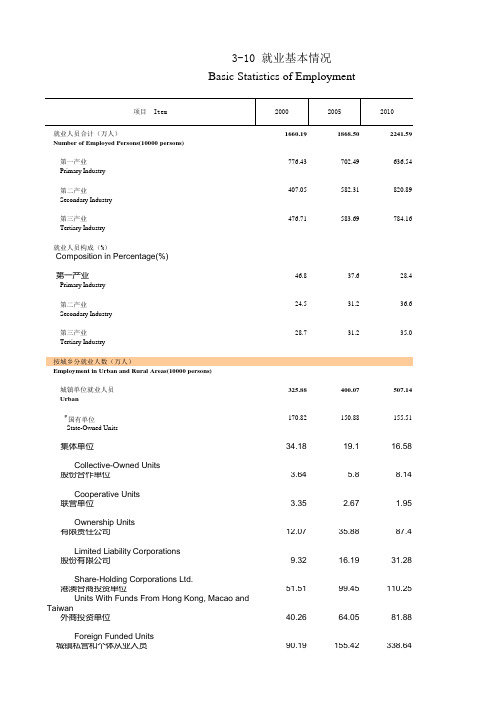
第一产业46.837.628.4 Primary Industry第二产业24.531.236.6 Secondary Industry第三产业28.731.235.0 Tertiary Industry按城乡分就业人数(万人)Employment in Urban and Rural Areas(10000 persons)城镇单位就业人员325.88400.07507.14 Urban#国有单位170.82150.88155.51 State-Owned Units集体单位34.1819.116.58 Collective-Owned Units股份合作单位 3.64 5.88.14 Cooperative Units联营单位 3.35 2.67 1.95 Ownership Units有限责任公司12.0735.8887.4 Limited Liability Corporations股份有限公司9.3216.1931.28 Share-Holding Corporations Ltd.港澳台商投资单位51.5199.45110.25 Units With Funds From Hong Kong, Macao andTaiwan外商投资单位40.2664.0581.88 Foreign Funded Units城镇私营和个体从业人员90.19155.42338.64Private Enterprise and Self-employed Individuals乡村就业人员1244.121313.011395.81 Rural城镇单位在岗职工人数(万人)318.00386.99485.94 Staff and Workers in Urban Units(10000 persons)国有单位166.78144.51145.74 State-Owned Units城镇集体单位33.1518.1915.38 Collective-Owned Units其他经济118.07224.29324.83 Others私营单位从业人员数(万人)362.67 Private Enterprise and Self-employed Individuals(10000 persons)城镇登记失业人数(万人)9.114.8614.49 Number of Urban Registered Unemployment(10000persons)城镇登记失业率(%) 2.64 3.77 Rate of Urban Registered Unemployment(%)21.721.035.535.242.843.8672.48705.36 160.71155.75 10.339.974.485.410.740.45 290.97332.76 46.2751.17 94.6887.61 58.1355.5 697.53691.241435.721394.77 566.62588.80133.44128.457.627.55 425.56452.79 527.75579.7917.1517.333.87 3.71。
福建宏观经济数据:3-11 主要年份全社会就业情况(年底数)(1952-2018)
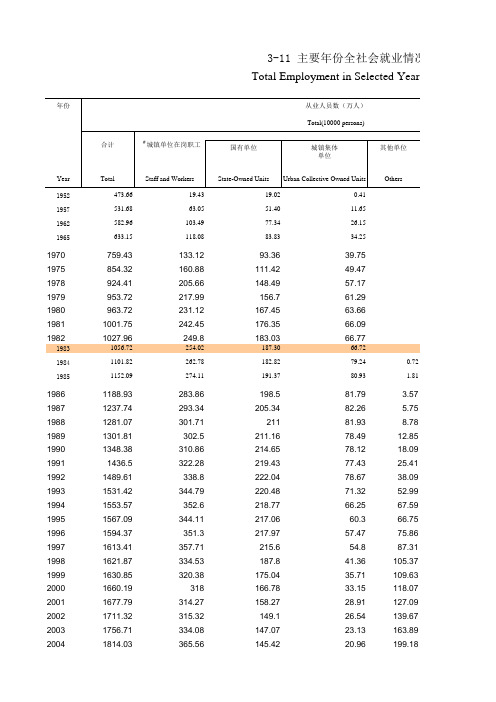
3-11 主要年份全社会就业情况(年底数) Total Employment in Selected Years(End of Year)
合计
#城镇单位在岗职工
国有单位
从业人员数(万人) Total(10000 persons)
城镇集体 单位
其他单位
Total
473.66 531.68 582.96 633.15
Others
0.72 1.81
3.57 5.75 8.78 12.85 18.09 25.41 38.09 52.99 67.59 66.75 75.86 87.31 105.37 109.63 118.07 127.09 139.677
1868.5
城镇登记 失业人数 (万人)
城镇登记 失业率 (%)
#城镇个私 劳动者
Self-Employed Individuals and Private Enterprise
#劳务派遣人员 Labor Dispatching Personnel
Number of Urban Registered
Unemploy-ment (10000 persons)
units, others refer to the various other economic types.b)Since 2016,Number of Employed Persons in Rural Areas is Computative.
会就业情况(年底数) cted Years(End of Year)
年份
Year 1952 1957 1962 1965
1970 1975 1978 1979 1980 1981 1982
1983 1984 1985
福建宏观经济数据:9-2 地方一般公共预算收入(2000-2018)
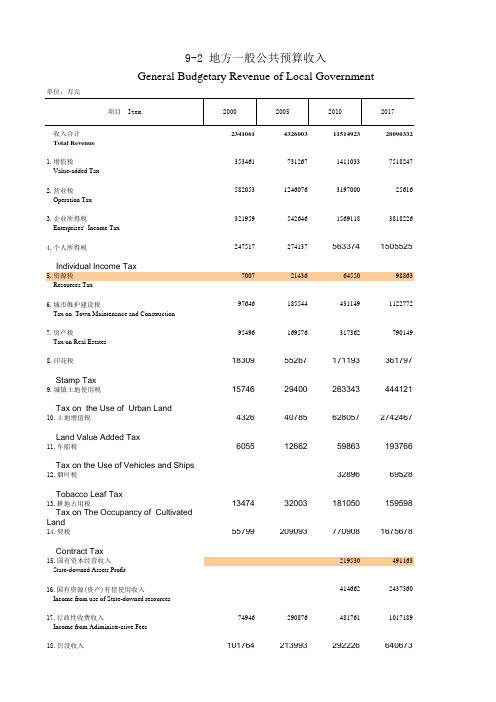
收入合计234106143260031151492328090332 Total Revenue
1.增值税35346173126714110337518247 Value-added Tax
2.营业税5820531246076319700025616 Operation Tax
3.企业所得税32195954264615691183818226 Enterprises' Income Tax
4.个人所得税2475172741375633741505525 Individual Income Tax5.资源税7007214366455098863 Resources Tax
6.城市维护建设税976461855444311491122772 Tax on Town Maintenance and Construction
7.房产税95496169576317362790149 Tax on Real Estates
8.印花税1830955267171193361797 Stamp Tax9.城镇土地使用税1574629400263343444121
Tax on the Use of Urban Land10.土地增值税4326407856280572742467
Land Value Added Tax11.车船税60551266259863193766
Tax on the Use of Vehicles and Ships12.烟叶税3289669528
Tobacco Leaf Tax13.耕地占用税1347432003181050159598 Tax on The Occupancy of CultivatedLand14.契税557992090937709081675678
Contract Tax15.国有资本经营收入219530491163 State-downed Assets Profit
福建宏观经济数据:3-16 按产业分城镇单位女性从业人员数(年底数)(2003-2018) (2)
By Sector农、林、牧、渔业 2.87 2.66 2.33 Farming, Forestry, Animal Husbandy and Fishery采矿业0.950.880.77 Mining and Quarrying制造业85.42111.28125.70 Manufacturing电力、热力、燃气及水生产和供应业 2.43 2.46 2.71 Production and Supply of Electricity Heat Gas and Water建筑业 3.87 4.589.56 Construction批发和零售业 4.96 4.46 6.21 Wholesale and Retail Trade交通运输、仓储和邮政业 4.06 4.08 4.32 Transport, Storage and Post Services住宿和餐饮业 2.49 2.84 4.3 Lodgings and Catering Services信息传输、软件和信息技术服务业 1.26 1.27 1.71 Information Transmission,Software and InformationTechnology Services金融业 4.39 4.61 6.63 Finance房地产业 1.08 1.46 2.88 Real Estate租赁和商务服务业 1.19 1.68 4.87 Rent and Business Services科学研究和技术服务业 1.06 1.09 1.8 Scientific Reseach and Ploytechnic Services水利、环境和公共设施管理业 1.3 1.44 1.7 Water Conservancy, Environment and PublicFacilitiesManagement居民服务、修理和其他服务业0.570.460.44Resident Services, Repair and Others教育19.3419.7522.42Education卫生和社会工作 6.457.079.6Health Care and Social Work文化、体育和娱乐业 1.24 1.28 1.5Culture, Sports and Entertainment公共管理、社会保障和社会组织 6.38 6.727.4 Public Management, Social Ensure and SocialOrganizations数)1.4 1.10.370.29101.49101.362.543.0824.6828.5314.4514.976.15 5.895.566.154.16 4.6711.7211.466.01 6.545.256.052.15 2.182.23 2.312.3 2.07 30.932.27 16.1815.98 2.012 13.0515.29。
福建宏观经济数据:3-13 按产业和登记注册类型分城镇单位从业人员数(2018年)
Farming, Forestry, Animal Husbandy and Fishery采矿业 1.330.23 Mining and Quarrying制造业213.650.71 Manufacturing电力、热力、燃气及水生产和供应业11.510.87 Production and Supply of Electricity Gas and Water建筑业197.02 4.43 Construction批发和零售业29.55 2.25 Wholesale and Retail Trade交通运输、仓储和邮政业23.047.82 Transport, Storage and Post Services住宿和餐饮业11.060.62 Lodgings and Catering Services信息传输、软件和信息技术服务业12.270.7 Information Transmission, Software andInformationTechnology Services金融业20.03 5.7Finance房地产业17.11 1.08Real Estate租赁和商务服务业18.63 4.81 Rent and Business Services科学研究和技术服务业7.72 3.78Scientific Reseach and Ploytechnic Services水利、环境和公共设施管理业 5.7 2.84 Water Conservancy, Environment and PublicFacilitiesManagement居民服务、修理和其他服务业 3.140.29Resident Services and Others教育54.6747.99Education卫生和社会工作23.7618.68Health Care and Social Work文化、体育和娱乐业 4.34 2.76Culture, Sports and Entertainment公共管理、社会保障和社会组织47.2547.21 Public Management, Social Ensure and SocialOrganizations0.020.590.230.871.29211.640.1710.471.82190.76 0.6326.66 0.1715.04 0.0510.39 0.0111.56 0.713.64 0.2415.79 0.4113.410.11 3.830.08 2.780.05 2.80.69 5.993.26 1.820.05 1.53 ...0.04。
全国各省市区社会发展经济数据:23-2 全国各地区第二、三产业增加值及排序(2018年)
5
16191.9
7
9857.2
18
37877.4
11
21731.7
13
18730.1
11
18888.7
16
52751.2
22
9260.2
20
2736.2
28
10656.1
9
20928.7
3
6891.4
2
8424.8
1
719.0
4
10450.7
27
4530.1
8
1350.1
13
1775.1
24
5584.0
16040.1 7089.2 6807.3
10025.1 6410.9 4030.9 9732.5
41248.5 23505.9 13842.1 17232.4 10250.2 33641.7 22034.8 17089.0 14453.5 40695.2
8072.9 1095.8 8328.8 15322.7 5755.5 6957.4
23-2 全国各地区第二、三产业增加值及排序(2018年) Value-added of Secondary and Tertiary Industry
and Their Orders by Region of the Whole Country (2018)
单位:亿元,%
地区
Region
全国 北京 天津 河北 山西 内蒙古 辽宁 吉林 黑龙江 上海 江苏 浙江 安徽 福建 江西 山东 河南 湖北 湖南 广东 广西 海南 重庆 四川 贵州 云南 西藏 陕西 甘肃 青海 宁夏 新疆
7.6
5
7.3
15
湖南统计年鉴2018全省社会经济发展指标:三次产业对地区生产总值增长贡献率拉动
本表按不变价格计
第一产业第二产业第三产业#工业地区生产总值第一产业PrimarySecondaryTertiaryIndustryGross RegionalPrimaryIndustryIndustryIndustryProductIndustry
199026.348.824.943.54.01.1199127.535.636.925.27.92.2199220.634.944.569.211.12.3199312.849.237.947.412.41.6199417.451.131.546.810.61.9199520.648.131.342.610.32.1199616.251.132.747.012.12.0199717.249.133.647.410.61.819983.254.642.248.28.50.3199910.645.943.640.28.40.9200011.149.239.843.89.01.020019.841.448.833.89.00.920026.144.749.238.29.00.620031.752.146.244.89.60.220049.950.939.242.512.11.220057.341.950.837.412.20.920066.253.040.847.612.80.820074.051.144.946.015.10.620085.246.848.042.314.10.720094.759.036.349.913.90.720103.562.134.456.114.60.520114.361.534.256.612.80.520123.354.742.050.311.40.420132.952.145.047.110.10.320144.848.446.842.29.50.520154.142.553.437.48.50.4
Year2-18 三次产业对地区生产总值增长的贡献率和拉动Contribution Share and Contribution of the Three Strata of Industry to the