elisa酶联免疫吸附实验报告
ELISA(酶联免疫吸附测定)实验报告

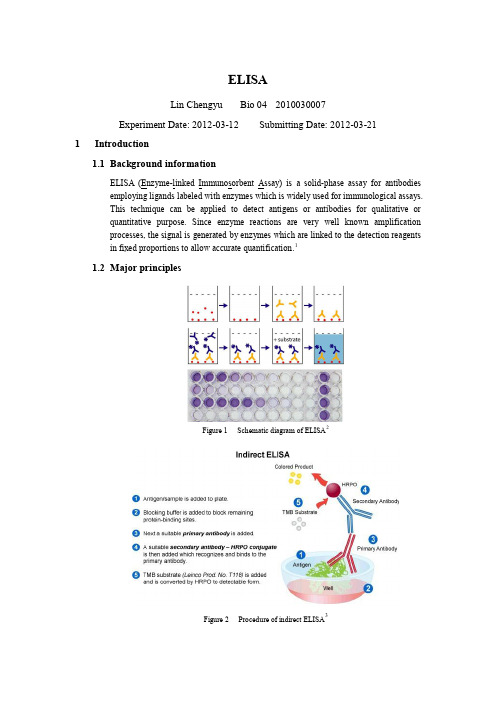
ELISALin Chengyu Bio 04 2010030007Experiment Date: 2012-03-12 Submitting Date: 2012-03-211Introduction1.1Background informationELISA (Enzyme-linked Immunosorbent Assay) is a solid-phase assay for antibodiesemploying ligands labeled with enzymes which is widely used for immunological assays.This technique can be applied to detect antigens or antibodies for qualitative orquantitative purpose. Since enzyme reactions are very well known amplificationprocesses, the signal is generated by enzymes which are linked to the detection reagentsin fixed proportions to allow accurate quantification.11.2Major principlesFigure 1 Schematic diagram of ELISA2Figure 2 Procedure of indirect ELISA3As shown in Figure 1 & 2, the general procedure of indirect ELSIA is to: incubate theplate well with antigen, wash off unbounded antigen, incubate with 1st antibody, washoff unbounded 1st antibody, incubate with labeled 2nd antibody, wash off unbounded 2ndantibody, incubate with enzyme substrate solution, and detect optical density or otherindex showing enzyme activity.2Experiment Operation2.1Antigen coating(1)Prepare an antigen solution in coating buffer (human IgG at 0.025mg/ml);(2)Pipette 200 μl antigen solution to each well (Row: B~G; Column: 2~10; Column 11is negative control without antigen) of the microtiter plate;(3)Incubate the plate at 37 ℃for 30 min;(4)Remove the antigen solution;(5)Wash each well with 200 μl with PBS-T for 3 times;(6)Block each well (Row: B~G; Column: 2~11) with 200 μl 0.5% BSA-PBS, andincubate the plate at 37 ℃for 30 min;(7)Remove the blocking solution;(8)Wash each well with 200 μl with PBS-T for 3 times.2.2Primary antibody reaction(1)Dilute the primary antibody (rabbit-anti-human IgG antiserum) in PBS-T fordifferent dilution (from 1:400 to 1:51,200 in 2-folds dilution);(2)Add 200 μl diluted antibody solution to each well following Table 1;Table 1 Scheme to add primary antibody(3)Incubate the plate at 37 ℃for 1 hour;(4)Remove the primary antibody solution;(5)Wash each well with 200 μl PBS-T for 3 times.2.3Application of secondary antibody(1)Dilute the peroxidase conjugated secondary antibody (Goat-anti-rabbit IgG-HRP) inPBS-T at the dilution of 1:20,000 and 1:40,000;(2)Add 200 μl secondary antibody solution to each well following Table 2;(3)Incubate the plate at 37 ℃for 1 hour;(4)Remove the secondary antibody solution;(5)Wash each well with 200 μl PBS-T for 3 times.2.4Substrate development(1)Add 200 μl substrate solution to each well (Row: B~G ,Column: 2~11);(2)Incubate for approximately 3 min;(3)Add 50 μl 2 M H2SO4 to each well to terminate the reaction;(4)Measure optical density at 490 nm.3Raw data and its processing3.1Raw data3.2Data processingSet Row B, C, and D as Group I, and Row E, F, and G as Group II. The processed datais shown in Table 4Table 4 Processed data: optical density of each groupSet different dilutions of primary antibody as x axis, optical density as y axis, drawFigure 3 to illustrate their relation.Figure 3 Relationship between optical density and dilutions of primary antibodyFor the reason that the curve cannot illustrate the relationship enough, change the x axis to nature logarithm of different dilutions of primary antibody. See Figure 4:Figure 4 Relationship between optical density and natural logarithm of dilutions of primary antibodyUsing linear fit for each group, we can figure out that two lines are approximately parallel.In the black curve in Figure 3, there is an oblivious point of inflection which corresponds with the dilution of 1:800. The curve after this point becomes flat, which indicates that the binding between antigens and primary antibodies is saturated in the dilution of 1:800 and higher. This data can suggest that in other immunoenzymatic experiment, the proper dilution of primary antibody will be around, and no higher than 1:800.What’s more, from the red line in Figure 4 we can figure out that the optical density hasa linear relation with natural logarithm of dilutions of the primary antibody.As for comparison between Group I and Group II, from Figure 3 we can figure out thatthe point of infection of blue curve, which corresponds with the dilution of 1:40,000, ison the left, about 1:1600.In Figure 4, the green line (1:40,000) is positioned lower than the red line (1:20,000),which is easy to understand. Lower concentration of secondary antibody means lessbinding with primary antibody during application of secondary antibody.4Results and discussion4.1Results(1)The optical density has an approximately linear relation with the natural logarithmof the dilutions of the primary antibody;(2)For secondary antibody in the dilution of 1:20,000, the proper dilution of primaryantibody is 1:800; for secondary antibody in the dilution of 1:40,000, primaryantibody is recommended to be 1:1600;(3)With the same dilution of antigen and primary antibody, higher concentration ofsecondary antibody will get a higher optical density;4.2Discussion(1)What is the significance of the negative control groups?I.The no primary antibody groups proved that there is no specific bindingbetween antigen and secondary antibody, and provided a background ofnon-specific binding between secondary antibody and antigen;II.The no antigen groups can provide a background of non-specific binding between primary antibody and BSA.(2)Why washing step is essential?Washing each well with PBS-T, which contains tween-20 as detergent, can wash offunbounded antigens and antibodies, including those non-specifically binding. Ifwashing step is omitted, the background index will be higher, and might causeinterference to the result.(3)Why blocking step is essential?After the antigen coating step, the surface of the well is not covered by antigenentirely, i.e. there is still some site leaving blank, which allows other proteins bindto them. Blocking step is to block those blank sites with non-specific bindingmaterial that will not cause interference to the experiment. Thus, the primaryantibody will only bind to the antigen coated in the first step, rather than coat on thesurface as well.(4)What’s the advantage of indirect ELISA comparing with direct ELISA?I.Indirect ELISA can amplify the optical density which we measure.Compared to direct ELISA, the number of secondary antibody binding tothe primary antibody is way larger than the number of primary antibodybinding to the antigen. Thus, optical density will be higher and easier tomeasure, which means a lower error;II.The secondary antibody contains HRP, which is essential for substrate development. Compared to direct ELISA, indirect ELISA need only onekind of antibody contains HRP to perform many kinds of experiment, ratherthan one antibody linked to enzyme for one experiment, which isinconvenient.5Reference【1】/wiki/ELISA【2】/post/9314400054【3】/indirect_elisa。
elisa双抗体夹心法实验报告

elisa双抗体夹心法实验报告实验报告:ELISA双抗体夹心法实验一、实验目的本实验旨在通过ELISA双抗体夹心法,检测待测样品中目标蛋白的含量,为相关研究提供依据。
二、实验原理ELISA(酶联免疫吸附试验)是一种灵敏的免疫学检测方法,通过将特异性抗体与酶标记结合,实现对目标蛋白的定量检测。
双抗体夹心法是一种常用的ELISA 技术,其原理是将两种特异性抗体分别固定在酶标板的不同位置上,形成两个“抗体夹心”,实现对目标蛋白的双重捕获,从而提高检测的灵敏度和特异性。
三、实验步骤1.酶标板包被:将第一种特异性抗体(capture antibody)包被在酶标板孔中,以固定化抗体形式捕获目标蛋白。
2.封闭:加入封闭液(通常为正常血清或BSA),填充孔内未结合的位点,以减少非特异性吸附。
3.洗涤:洗涤液清洗酶标板,去除未结合的物质。
4.样本加入:将待测样本加入酶标板孔中,与固定化的抗体发生特异性结合。
5.洗涤:再次洗涤酶标板,以去除未结合的物质。
6.酶标二抗加入:将第二种特异性抗体(detection antibody)与酶标记结合,形成酶标二抗。
将酶标二抗加入酶标板孔中,与目标蛋白发生特异性结合,形成“抗体夹心”。
7.洗涤:洗涤液清洗酶标板,去除未结合的物质。
8.显色反应:加入底物溶液,发生显色反应。
若目标蛋白存在,则呈现颜色变化。
9.终止反应:加入终止液,停止显色反应。
10.吸光度测定:用酶标仪测定各孔的吸光度值(通常在450nm处测量),根据吸光度值判断目标蛋白的含量。
四、实验结果根据实验数据,绘制标准曲线图和散点图,分析待测样品中目标蛋白的含量。
通常,标准曲线图横坐标为蛋白浓度,纵坐标为吸光度值。
通过将待测样品的吸光度值与标准品进行比较,计算出待测样品中目标蛋白的浓度。
五、实验总结本实验通过ELISA双抗体夹心法成功检测了待测样品中目标蛋白的含量。
实验过程中需注意保持操作环境的清洁和干燥,避免影响实验结果。
elisa技术实验报告

elisa技术实验报告实验目的:本实验旨在通过酶联免疫吸附测定(Enzyme-Linked Immunosorbent Assay, ELISA)技术,检测特定抗原或抗体的存在,以评估ELISA技术在生物医学研究和临床诊断中的应用。
实验原理:ELISA技术是一种基于抗原-抗体特异性结合的免疫学检测方法。
通过将抗原或抗体固定在固相载体上,利用酶标记的二抗体与待测物结合,通过酶催化底物产生可检测的信号,从而定量或定性分析目标分子。
实验材料:1. 96孔ELISA板2. 待测样本3. 特异性一抗4. 酶标记的二抗5. 底物溶液6. 终止液7. 洗涤缓冲液8. 标准品或阳性对照9. 酶标仪实验步骤:1. 准备96孔ELISA板,将标准品或阳性对照按照不同浓度稀释后加入板中,同时加入待测样本。
2. 将特异性一抗加入每个孔中,室温下孵育1小时。
3. 用洗涤缓冲液洗涤ELISA板,去除未结合的一抗。
4. 加入酶标记的二抗,室温下孵育1小时。
5. 再次用洗涤缓冲液洗涤板子。
6. 加入底物溶液,根据实验需要设定孵育时间。
7. 加入终止液,终止酶反应。
8. 使用酶标仪在特定波长下测定吸光度(OD值)。
实验结果:实验结果显示,随着标准品浓度的增加,OD值呈线性增加,表明ELISA实验具有较好的灵敏度和特异性。
待测样本的OD值与标准曲线进行比较,可以计算出待测物的浓度。
实验讨论:本次实验中,ELISA技术成功地检测了目标分子的存在,验证了其在生物医学研究中的实用性。
然而,实验中也存在一些可能影响结果的因素,如样本的稀释倍数、孵育时间和洗涤次数等。
在未来的实验中,需要进一步优化实验条件,以提高检测的准确性和重复性。
实验结论:通过本次ELISA实验,我们成功地检测了特定抗原或抗体的存在,证明了ELISA技术在生物医学研究和临床诊断中的有效性。
未来,我们将继续探索和优化ELISA技术,以满足更广泛的应用需求。
参考文献:[1] Engvall E, Perlmann P. Enzyme-linked immunosorbent assay (ELISA) quantitative assay of immunoglobulin G. Immunochemistry. 1971;8(9):871-874.[2] Voller A, Bartlett A, Bidwell D. Enzyme immunoassays with special reference to ELISA techniques. Journal of General Virology. 1976;33(2):165-169.请注意,本实验报告是一个示例,实际实验应根据具体的实验设计和结果进行编写。
试验五酶联免疫吸附试验ELISA

ELISA检测抗原
Ag + Ab* ↔ Ag-Ab*
三、操作步骤
1.
包被抗原
抗原用包被液稀释至合适浓度,加入到酶标板中,100μl/孔,放入湿
盒中,4℃过夜或37 ℃ 2h,洗涤液(PBST)洗涤1遍 (200μl/孔),泡 洗3min,甩干孔中液体
洗涤液(PBST):PBS 1L,Tween-20 0.5ml,调PH 至7.4 包被用缓冲液
实验五 酶联免疫吸附试验 (ELISA)
一、目的
掌握ELISA的操作方法
了解ELISA在动物疫病诊断的意义
二、材料
酶标条、猪链球菌9型抗原、待测血清、阴性
血清、碳酸盐缓冲液、洗涤液、封闭液、底 物缓冲液、加样器等
酶联免疫吸附试验ELISA
(enzyme linked immunosorbent assay)
pH9.6碳酸盐缓冲液 (Na2CO3 1.5g,KCl 0.2g,NaHCO32.9g,加 双蒸水至1L ) pH7.2的磷酸盐缓冲液
包被蛋白用PBS稀释至浓度范围1μg/ml-50μg/ml(可 溶性抗原浓度通常在1-10μg/ml),可设不同抗体稀
释度来确定最佳使用量
如果包被的是细菌,则选择OD600为0.6左右,用包被
液洗涤两次,超声裂解(工作5s,间隔10s,总共
80次),之后可进行包被
封闭就是让大量不相关的蛋白质充填这些空隙,从
而排斥ELISA后的步骤中干扰物质的再吸附
封闭液(含2%BSA的PBST),200μl/孔,37℃,
2h后弃去封闭液,经PBST洗涤一次拍干后可现用, 也可在-20℃保存2-3个月
酶反应终止液
(仅供参考)ELISA(酶联免疫吸附测定)实验报告
ELISALin Chengyu Bio 04 2010030007Experiment Date: 2012-03-12 Submitting Date: 2012-03-211Introduction1.1Background informationELISA (Enzyme-linked Immunosorbent Assay) is a solid-phase assay for antibodiesemploying ligands labeled with enzymes which is widely used for immunological assays.This technique can be applied to detect antigens or antibodies for qualitative orquantitative purpose. Since enzyme reactions are very well known amplificationprocesses, the signal is generated by enzymes which are linked to the detection reagentsin fixed proportions to allow accurate quantification.11.2Major principlesFigure 1 Schematic diagram of ELISA2Figure 2 Procedure of indirect ELISA3As shown in Figure 1 & 2, the general procedure of indirect ELSIA is to: incubate theplate well with antigen, wash off unbounded antigen, incubate with 1st antibody, washoff unbounded 1st antibody, incubate with labeled 2nd antibody, wash off unbounded 2ndantibody, incubate with enzyme substrate solution, and detect optical density or otherindex showing enzyme activity.2Experiment Operation2.1Antigen coating(1)Prepare an antigen solution in coating buffer (human IgG at 0.025mg/ml);(2)Pipette 200 μl antigen solution to each well (Row: B~G; Column: 2~10; Column 11is negative control without antigen) of the microtiter plate;(3)Incubate the plate at 37 ℃for 30 min;(4)Remove the antigen solution;(5)Wash each well with 200 μl with PBS-T for 3 times;(6)Block each well (Row: B~G; Column: 2~11) with 200 μl 0.5% BSA-PBS, andincubate the plate at 37 ℃for 30 min;(7)Remove the blocking solution;(8)Wash each well with 200 μl with PBS-T for 3 times.2.2Primary antibody reaction(1)Dilute the primary antibody (rabbit-anti-human IgG antiserum) in PBS-T fordifferent dilution (from 1:400 to 1:51,200 in 2-folds dilution);(2)Add 200 μl diluted antibody solution to each well following Table 1;Table 1 Scheme to add primary antibody(3)Incubate the plate at 37 ℃for 1 hour;(4)Remove the primary antibody solution;(5)Wash each well with 200 μl PBS-T for 3 times.2.3Application of secondary antibody(1)Dilute the peroxidase conjugated secondary antibody (Goat-anti-rabbit IgG-HRP) inPBS-T at the dilution of 1:20,000 and 1:40,000;(2)Add 200 μl secondary antibody solution to each well following Table 2;(3)Incubate the plate at 37 ℃for 1 hour;(4)Remove the secondary antibody solution;(5)Wash each well with 200 μl PBS-T for 3 times.2.4Substrate development(1)Add 200 μl substrate solution to each well (Row: B~G ,Column: 2~11);(2)Incubate for approximately 3 min;(3)Add 50 μl 2 M H2SO4 to each well to terminate the reaction;(4)Measure optical density at 490 nm.3Raw data and its processing3.1Raw data3.2Data processingSet Row B, C, and D as Group I, and Row E, F, and G as Group II. The processed datais shown in Table 4Table 4 Processed data: optical density of each groupSet different dilutions of primary antibody as x axis, optical density as y axis, drawFigure 3 to illustrate their relation.Figure 3 Relationship between optical density and dilutions of primary antibodyFor the reason that the curve cannot illustrate the relationship enough, change the x axis to nature logarithm of different dilutions of primary antibody. See Figure 4:Figure 4 Relationship between optical density and natural logarithm of dilutions of primary antibodyUsing linear fit for each group, we can figure out that two lines are approximately parallel.In the black curve in Figure 3, there is an oblivious point of inflection which corresponds with the dilution of 1:800. The curve after this point becomes flat, which indicates that the binding between antigens and primary antibodies is saturated in the dilution of 1:800 and higher. This data can suggest that in other immunoenzymatic experiment, the proper dilution of primary antibody will be around, and no higher than 1:800.What’s more, from the red line in Figure 4 we can figure out that the optical density hasa linear relation with natural logarithm of dilutions of the primary antibody.As for comparison between Group I and Group II, from Figure 3 we can figure out thatthe point of infection of blue curve, which corresponds with the dilution of 1:40,000, ison the left, about 1:1600.In Figure 4, the green line (1:40,000) is positioned lower than the red line (1:20,000),which is easy to understand. Lower concentration of secondary antibody means lessbinding with primary antibody during application of secondary antibody.4Results and discussion4.1Results(1)The optical density has an approximately linear relation with the natural logarithmof the dilutions of the primary antibody;(2)For secondary antibody in the dilution of 1:20,000, the proper dilution of primaryantibody is 1:800; for secondary antibody in the dilution of 1:40,000, primaryantibody is recommended to be 1:1600;(3)With the same dilution of antigen and primary antibody, higher concentration ofsecondary antibody will get a higher optical density;4.2Discussion(1)What is the significance of the negative control groups?I.The no primary antibody groups proved that there is no specific bindingbetween antigen and secondary antibody, and provided a background ofnon-specific binding between secondary antibody and antigen;II.The no antigen groups can provide a background of non-specific binding between primary antibody and BSA.(2)Why washing step is essential?Washing each well with PBS-T, which contains tween-20 as detergent, can wash offunbounded antigens and antibodies, including those non-specifically binding. Ifwashing step is omitted, the background index will be higher, and might causeinterference to the result.(3)Why blocking step is essential?After the antigen coating step, the surface of the well is not covered by antigenentirely, i.e. there is still some site leaving blank, which allows other proteins bindto them. Blocking step is to block those blank sites with non-specific bindingmaterial that will not cause interference to the experiment. Thus, the primaryantibody will only bind to the antigen coated in the first step, rather than coat on thesurface as well.(4)What’s the advantage of indirect ELISA comparing with direct ELISA?I.Indirect ELISA can amplify the optical density which we measure.Compared to direct ELISA, the number of secondary antibody binding tothe primary antibody is way larger than the number of primary antibodybinding to the antigen. Thus, optical density will be higher and easier tomeasure, which means a lower error;II.The secondary antibody contains HRP, which is essential for substrate development. Compared to direct ELISA, indirect ELISA need only onekind of antibody contains HRP to perform many kinds of experiment, ratherthan one antibody linked to enzyme for one experiment, which isinconvenient.5Reference【1】/wiki/ELISA【2】/post/9314400054【3】/indirect_elisa。
酶联免疫吸附实验报告

酶联免疫吸附试验【小组成员】潘晓娟(21000101)陈怡静(21000100)李永乐(21000588)袁理(21000221) 【实验原理】酶联免疫吸附试验为酶免疫技术的一种,是在固相载体上进行的免疫酶技术。
其理论依据为:抗原或抗体可吸附固相载体(聚苯乙烯微量细胞培养板)表面而不改变其特性;抗原或抗体与酶交联后,仍保持其结合活性,同时酶的催化活性不改变;特异性抗原抗体结合后,标记的酶可高效催化底物水解、氧化或还原,产生有色物质,其颜色深浅与相应的抗体或抗原量相关。
【实验设计】酶联免疫吸附试验有多种设计方案,本组采取抑制ELISA 设计:正常兔血清→兔抗鼠IgG*+HPR-羊抗兔Ig →显色按照实验原理,若未加入未知抗原时,正常兔血清与酶标抗体结合后吸附在固相载体表面,能使后来加入的底物发生氧化还原反应而显色。
若先将未知抗原与酶标羊抗兔IgG 反应,如未知抗原中含有能与酶标羊抗兔IgG 反应的抗原,则正常兔血清能与酶标羊抗兔IgG 结合量减少,底物显色变浅,甚至不变色。
鉴于此次为首次进行酶联免疫吸附试验,包被物正常兔血清与未知抗原兔抗鼠IgG 二者的最佳反应稀释度均未知,故实验采取4个不同稀释度的正常兔血清与4个不同稀释度的兔抗鼠IgG 进行交叉,并设置了只含稀释液和酶标羊抗兔IgG 的空白对照组。
【实验材料】1:200正常兔血清、1:200兔抗鼠IgG 、1:200HPR-羊抗兔Ig 、包被液、封闭液、洗涤液、底物缓冲液(TMB )、终止液 、聚苯乙烯微量细胞培养板、微量加液器、10μL 加样器头、100μL 加样器头、洗瓶、吸水纸、水浴箱。
【实验方法】1、稀释:按照加孔数计算稀释时所需正常兔血清与稀释液的量,倍比稀释1:200正常兔血清至1:1000、1:2000、1:4000、1:8000四个稀释度;2、包被:按下图所示,用100μL 加样器头往聚苯乙烯微量细胞培养板中加入不同稀释度血清100μL/孔,置于4°C 冰箱保存过夜;正常兔血清稀释度3、干燥:取出已包被过夜的培养板,倒掉多余的包被液,甩干后用吸水纸吸掉多余水分;4、封闭:加入150μL/孔的封闭液,放入37°C 恒温箱30min ;5、稀释:按照加孔数计算稀释时所需1:200兔抗鼠IgG 与稀释液的量,倍比稀释1:200兔抗鼠IgG 至1:1000、1:2000、1:4000、1:8000四个稀释度;6、干燥:取出培养板,以洗涤剂冲洗3次,每次3min ,用吸水纸吸掉多余水分;7、加液:按下图所示,加入已倍比稀释的兔抗鼠IgG 50μL/孔和1:200HPR-羊抗兔Ig 50μL/孔(无需稀释后加入),对照组只加入1:200HPR-羊抗兔Ig 50μL/孔,放入37°C 恒温箱30min ;1:1000 1:20001:10001:20001:10001:20001:10001:2000稀释液稀释液1:40001:8000 1:4000 1:8000 1:4000 1:8000 1:4000 1:8000 稀释液 稀释液1:1000/HPR-羊抗兔 1:1000/HPR-羊抗兔 1:2000/HPR-羊抗兔 1:2000/HPR-羊抗兔 1:4000/HPR-羊抗兔 1:4000/HPR-羊抗兔 1:8000/HPR-羊抗兔 1:8000/HPR-羊抗兔 HPR-羊抗兔 ***HPR-羊抗兔 HPR-羊抗兔 ***1:1000/HPR-羊抗兔1:1000/HPR-羊抗兔1:2000/HPR-羊抗兔1:2000/HPR-羊抗兔1:4000/HPR-羊抗兔1:4000/HPR-羊抗兔1:8000/HPR-羊抗兔1:8000/HPR-羊抗兔HPR-羊抗兔 ***HPR-羊抗兔HPR-羊抗兔 ***8、干燥:取出培养板,以洗涤剂冲洗3次,每次3min,用吸水纸吸掉多余水分;9、显色:加入底物缓冲液(TMB)100μL/孔,避光显色5min;10、终止:滴入H2SO4终止反应,利用酶标读数仪测量OD值。
2021年elisa酶联免疫吸附实验报告

elisa酶联免疫吸附试验汇报一.试验目酶联免疫吸附测定(enzyme-linkedimmunosorbent a ssay 简称E LISA )是在免疫酶技术(immunoenzymatic technique)s 基础上发展起来一个新型免疫测定技术,ELISA 过程包含抗原(抗体)吸附在固相载体上称为包被, 加待测抗体(抗原), 再加对应酶标识抗体(抗原) ,生成抗原(抗体)--待测抗体(抗原)--酶标识抗体复合物, 再与该酶底物反应生成有色产物。
借助分光光度计光吸收计算抗体(抗原)量。
待测抗体(抗原)定量与有色产生成正比。
二.试验原理用于免疫酶技术酶有很多, 如过氧化物酶, 碱性磷酸酯酶, β-D-半乳糖苷酶, 葡萄糖氧化酶, 碳酸酐酶,乙酰胆碱酯酶, 6-磷酸葡萄糖脱氧酶等。
常见于 ELISA 法酶有辣根过氧化物酶, 碱性磷酸酯酶等, 其中尤以辣根过氧化物酶为多。
因为酶摧化是氧化还原反应, 在呈色后须立即测定, 不然空气中氧化作用使颜色加深, 无法正确地定量。
辣根过氧化物酶(HRP )是一个糖蛋白, 每个分子含有一个氯化血红素(p rotonhemin)区作辅基。
酶浓度和纯度常以辅基含量表示。
氯化血红素辅基最大吸收峰是 403nm, HRP 酶蛋白最大吸收峰是 275nm, 所以酶浓度和纯度计算式是(已知 HRPA (1cm 403nm 1% )=25, 式中1%指 HRP 百分浓度为 100ml 含酶蛋白 1g,即10mg/ml, 所以, 酶浓度以mg/ml 计算是HRPA (1cm 403nm mg/ml=2.5 )H RP 纯度(R Z )=A403nm/A275nm 纯度R Z (Reinheit Za)hl值越大说明酶内所含杂质越少。
高纯度H RPRZ 值在3.0左右,最高可达3.4。
用于E LISA 检测H RPRZ 值要求在3.0以上。
ELISA 基础原理有三条:(1)抗原或抗体能以物理性地吸附于固相载体表面 , 可能是蛋白和聚苯乙烯表面间疏水性部分相互吸附 ,并保持其免疫学活性;(2)抗原或抗体可经过共价键与酶连接形成酶结合物, 而此种酶结合物仍能保持其免疫学和酶学活性;(3)酶结合物与对应抗原或抗体结合后, 可依据加入底物颜色反应来判定是否有免疫反应存在, 而且颜色反应深浅是与标本中对应抗原或抗体量成正百分比, 所以, 能够按底物显色程度显示试验结果。
elisa实验报告
elisa实验报告随着科技的发展,实验方法也在不断更新和改进。
其中,酶联免疫吸附实验(ELISA)被广泛应用于生物学及临床医学研究中。
作为一种高效的检测方法,ELISA能够检测血清、尿液、唾液、细胞提取物等生物液、物质中的特定蛋白质,被广泛应用于病毒、癌细胞、蛋白质等方面的实验研究。
在本次实验中,我们通过ELISA方法检测了病毒包膜蛋白VP1在样品中的含量。
以下是实验流程及结果。
实验步骤1. 样品制备首先,需要使用人工合成的病毒包膜蛋白VP1来准备标准物质。
将标准物质分别加入含有5% BSA的PBS缓冲液中,配置不同浓度的标准曲线样品,分别为100 ng/ml、50 ng/ml、10 ng/ml、5ng/ml和0 ng/ml。
2. 包被ELISA板将96孔ELISA板添加200 uL/well的coating buffer,放置于4℃下孵育过夜。
第二天将ELISA板洗涤3次,每次250 uL/well的PBS缓冲液,并用吸头吸干。
3. 比色反应将每个标准曲线样品和样品加入各对应孔中,分别孵育1h。
然后将ELISA板洗涤3次,每次250 uL/well的PBS缓冲液,并用吸头吸干。
添加200 uL/well的酶化抗体,并于室温下孵育1h。
接下来,将ELISA板洗涤3次,每次250 uL/well的PBS缓冲液,并用吸头吸干。
加入200 uL/well的酶标记物,并于室温下孵育1h。
将ELISA板洗涤3次,每次250 uL/well的PBS缓冲液,并用吸头吸干。
加入200 uL/well的底物,于室温下孵育30min。
随后,加入50 uL/well的终止剂,用多功能酶标仪在450 nm波长下测量各标准曲线样品的OD值。
数据处理在对比各标准曲线样品的OD值与曲线的线性函数后,将检测到的样品OD值带入曲线线性函数中,计算出其含量。
实验结果本次实验结果表明,我们成功使用ELISA方法检测出了样品中病毒包膜蛋白VP1的含量。
- 1、下载文档前请自行甄别文档内容的完整性,平台不提供额外的编辑、内容补充、找答案等附加服务。
- 2、"仅部分预览"的文档,不可在线预览部分如存在完整性等问题,可反馈申请退款(可完整预览的文档不适用该条件!)。
- 3、如文档侵犯您的权益,请联系客服反馈,我们会尽快为您处理(人工客服工作时间:9:00-18:30)。
e l i s a酶联免疫吸附实验报告
一.实验目的
酶联免疫吸附测定(enzyme-linked immunosorbent assay 简称ELISA)是在免疫酶技术(immunoenzymatic techniques)的基础上发展起来的一种新型的免疫测定技术,ELISA过程包括抗原(抗体)吸附在固相载体上称为包被,加待测抗体(抗原), 再加相应酶标记抗体(抗原),生成抗原(抗体)--待测抗体(抗原)--酶标记抗体的复合物,再与该酶的底物反应生成有色产物。
借助分光光度计的光吸收计算抗体(抗原)的量。
待测抗体(抗原)的定量与有色产生成正比。
二.实验原理
用于免疫酶技术的酶有很多,如过氧化物酶,碱性磷酸酯酶,β-D-半乳糖苷酶,葡萄糖氧化酶,碳酸酐酶,乙酰胆碱酯酶,6-磷酸葡萄糖脱氧酶等。
常用于ELISA法的酶有辣根过氧化物酶,碱性磷酸酯酶等,其中尤以辣根过氧化物酶为多。
由于酶摧化的是氧化还原反应,在呈色后须立刻测定,否则空气中的氧化作用使颜色加深,无法准确地定量。
辣根过氧化物酶(HRP)是一种糖蛋白,每个分子含有一个氯化血红素(protonhemin)区作辅基。
酶的浓度和纯度常以辅基的含量表示。
氯化血红素辅基的最大吸收峰是403nm,HRP酶蛋白的最大吸收峰是275nm,所以酶的浓度和纯度计算式是(已知HRP的A(1cm 403nm 1%)=25,式中1%指HRP百分浓度为100ml含酶蛋白1g,即10mg/ml,所以,酶浓度以mg/ml 计算是HRP的A(1cm 403nm mg/ml=2.5)HRP纯度(RZ)=A403nm/A275nm纯度RZ(Reinheit
Zahl)值越大说明酶内所含杂质越少。
高纯度HRP的RZ值在3.0左右,最高可达3.4。
用于ELISA检测的HRP的RZ 值要求在3.0以上。
E L I S A的基本原理有三条:
(1)抗原或抗体能以物理性地吸附于固相载体表面,可能是蛋白和聚苯乙烯表面间的疏水性部分相互吸附,并保持其免疫学活性;
(2)抗原或抗体可通过共价键与酶连接形成酶结合物,而此种酶结合物仍能保持其免疫学和酶学活性;
(3)酶结合物与相应抗原或抗体结合后,可根据加入底物的颜色反应来判定是否有免疫反应的存在,而且颜色反应的深浅是与标本中相应抗原或抗体的量成正比例的,因此,可以按底物显色的程度显示试验结果。
ELISA法是免疫诊断中的一项新技术,现已成功地应用于多种病原微生物所引起的传染病、寄生虫病及非传染病等方面的免疫诊断。
也已应用于大分子抗原和小分子抗原的定量测定,根据已经使用的结果,认为ELISA法具有灵敏、特异、简单、快速、稳定及易于自动化操作等特点。
不仅适用于临床标本的检查,而且由于一天之内可以检查几百甚至上千份标本,因此,也适合于血清流行病学调查。
本法不仅可以用来测定抗体,而且也可用于测定体液中的循环抗原,所以也是一种早期诊断的良好方法。
因此ELISA法在生物医学各领域的应用范围日益扩大,可概括四个方面:1、免疫酶染色各种细胞内成份的定位。
2、研究抗酶抗体的合成。
3、显现微量的免疫沉淀反应。
4、定量检测体液中抗原或抗体成份。
基本方法一用于检测未知抗原的双抗体夹心法:
1.包被:用0.05M PH9.牰碳酸盐包被缓冲液将抗体稀释至蛋白质含量为1~10μg/ml。
在每个聚苯乙
烯板的反应孔中加0.1ml,4℃过夜。
次日,弃去孔内溶液,用洗涤缓冲液洗3次,每次3分钟。
(简称洗涤,下同)。
2.加样:加一定稀释的待检样品0.1ml于上述已包被之反应孔中,置37℃孵育1小时。
然后洗涤。
(同时做空白孔,阴性对照孔及阳性对照孔)。
3.加酶标抗体:于各反应孔中,加入新鲜稀释的酶标抗体(经滴定后的稀释度)0.1ml。
37℃孵育0.5~1小时,洗涤。
4.加底物液显色:于各反应孔中加入临时配制的TMB底物溶液0.1ml,37℃10~30分钟。
5.终止反应:于各反应孔中加入2M硫酸0.05m l。
6.结果判定:可于白色背景上,直接用肉眼观察结果:反应孔内颜色越深,阳性程度越强,阴性反应为无色或极浅,依据所呈颜色的深浅,以“+”、“-”号表示。
也可测O•D值:在ELISA检测仪上,于450nm(若以ABTS 显色,则410nm)处,以空白对照孔调零后测各孔O•D值,若大于规定的阴性对照OD值的 2.1倍,即为阳性。
基本方法二用于检测未知抗体的间接法:
用包被缓冲液将已知抗原稀释至1~10μg/ml,每孔加0.1ml,4℃过夜。
次日洗涤3次。
↓
加一定稀释的待检样品(未知抗体)0.1ml于上述已包被之反应孔中,置37℃孵育1小时,洗涤。
(同时做空白、阴性及阳性孔对照)
↓
于反应孔中,加入新鲜稀释的酶标第二抗体(抗抗体)0.1ml,37℃孵育30-60分钟,洗涤,最后一遍用DDW
洗涤。
↓
其余步骤同“双抗体夹心法”的4、5、6。
(二)酶与底物
酶结合物是酶与抗体或抗原, 半抗原在交联剂作用下联结的产物。
是ELISA成败的关键试剂,它不仅具有抗体抗原特异的免疫反应,还具有酶促反应,显示出生物放大作用,但不同的酶选用不同的底物。
免疫技术常用的酶及其底物
酶底物显色反应测定波长
辣根过氧化物酶邻苯二胺橘红色492*
四甲替联苯胺黄色460**
氨基水杨酸棕色449
邻联苯甲胺兰色42 5
2,2'-连胺基-2(3-乙基-并噻唑啉磺酸-6)铵盐蓝绿色64 2
碱性磷酸酯酶4-硝基酚磷酸盐(P N P)黄色400
萘酚-A S-M x磷酸盐+重氮盐红色500
葡萄糖氧化酶A B T S+H R P+葡萄糖黄色405,420
葡萄糖+甲硫酚嗪+噻唑兰深蓝色
β-D-半乳糖苷酶甲基伞酮基半乳糖苷(4M u G)荧光360,450
硝基酚半乳糖苷(O N P G)黄色420
*终止剂为2m o l/L H2S O 4
**终止剂为2m o l/L柠檬酸,不同的底物有不同的终止剂。
可催化下列反应:HRP+H2O2→复合物复合物+AH2→过氧化物酶+H2O+A AH2 ——为无色底物, 供氢体;A——为有色产物。
(三)E L I S A常用的四种方法
1.直接法测定抗原
将抗原吸附在载体表面;
加酶标抗体,形成抗原—抗体复合物;
加底物。
底物的降解量=抗原量。
2.间接法测定抗体将抗原吸附于固相载体表面;加抗体,形成抗原-抗体复合物;加酶标抗体;加底物。
测定底物的降解量=抗体量。
3.双抗体夹心法测定抗原将抗原免疫第一种动物获得的抗体吸附于固相表面; 加抗原,形成抗原-抗体复合物; 加抗原免疫第二种动物获得的抗体,形成抗体抗原抗体复合物; 加酶标抗抗体(第二种动物抗体的抗体); 加底物。
底物的降解量=抗原量。
4.竞争法测定抗原将抗体吸附在固相载体表面;
(1)加入酶标抗原;
(2),(3)加入酶标抗原和待测抗原;
加底物。
对照孔与样品孔底物降解量的差=未知抗原量。
三.仪器和材料
1.聚苯乙烯微量细胞培养板(平板,40,96孔)。
2.酶联免疫检测仪
3.辣根过氧化物酶羊抗兔I g G,工作稀释度1:1000。
4. 包被液::0.05mol/L pH9.6碳酸缓冲液,4℃,保存,Na2CO3 0.15克, NaHCO3 0.293克,蒸馏水稀释至100 m l。
5. 稀释液:0.01mol/LpH7.4 PBS--Tween--20, 4℃,保存. NaCl 8g, KH2PO4 0.2g, Na2HPO4.12H2O 2.9g, T w e e n—20,0.5m l.蒸馏水加至1000m l。
6.洗涤液:同稀释液
7.封闭液:0.5%鸡卵清蛋白,p H7.4P B S。
8. 邻苯二胺溶液(底物):临用前配制0.1M 柠檬酸(2.1g/100ml), 6.1ml 0.2M Na2HPO4.12H2O (7.163g/100ml) 6.4ml,蒸馏水12.5ml,邻苯二胺10mg,溶解后,临用前加30%H2O240微升。
9.终止液:2m o l/L H2S O4。
四.操作步骤
1. 包被抗原:用包被液将抗原作适当稀释, 一般为1~10微克/孔,每孔加200微升,37℃温育1小时后,4℃冰箱放置16~18小时。
2. 洗涤:倒尽板孔中液体,加满洗涤液,静放三分钟,反复三次,最后将反应板倒置在吸水纸上,使孔中洗涤液流尽。
3.加封闭液200微升,37℃放置一小时。
4.洗涤同2。
5. 加被检血清:用稀释液将被检血清作几种稀释,,每孔200微升。
同时作稀释液对照。
37℃放置2小时。
6.洗涤同2。
7.加辣根过氧化物酶羊抗兔I g G,每孔200微升,放置37℃1小时。
8.洗涤同2。
9.加底物:邻苯二胺溶液加200m l,室温暗处10--15分钟。
10.加终止液:每孔50微升。
11.观察结果:用酶联免疫检测仪记录490n m读数。