Human modification of global water vapor flows
黄海海雾的观测和基于WRF模式的数值模拟研究

中国海洋大学博士学位论文黄海海雾的观测和基于WRF模式的数值模拟研究姓名:李鹏远申请学位级别:博士专业:气象学指导教师:傅刚;陆春谷2011-06摘要??黄海海雾的观测和基于WRF模式的数值模拟研究摘要海雾是悬浮在海洋大气边界层中的大量水滴使得海上大气水平能见度小于1km的一种天气现象。
黄海海域是我国沿海海雾频发的海域之一。
与海雾相伴随的大气低能见度对陆路,航空以及海上运输造成的经济损失正随着人类在沿岸地区和海上的活动的日益增多而增大。
本文首先对发生在2003-2008年的六次黄海海雾过程进行了详尽的观测分析,并利用WRFV3模式对其中的2005年3月9日和2008年7月7日两次海雾过程进行了数值模拟研究,对比分析了两个个例的异同。
对六个黄海海雾个例发生时的大气能见度,海平面气压,温度,相对湿度等相关因子进行了分析,发现根据地面观测站的海平面气压随时间变化将六个个例可以分为两类:气压减弱型和气压增强型。
前者发生在春季,后者则发生在夏季。
在黄海海域与西北太平洋高压相伴随的西南气流为海雾生成输送水汽。
海雾的消散主要与风向转变(即西北太平洋高压南撤或东退,黄海海域盛行风由偏南风转向偏北风)和大气层结稳定度的降低(即逆温层的消失)有关。
有利于黄海海雾形成的条件有:(1)2-10 m/s的弱的偏南风,(2)西北太平洋高压位于(25-35 °N, 120-140 °E),(3)大气逆温层的存在(7-20 ??/km,2-6 ?? /300m),(4)南北海温梯度(4-16 ??)。
这些是黄海平流冷却型海雾生成的重要因素。
对2005年3月9日春季海雾过程的数值模拟分析发现本次海雾个例的发生发展以及消散都与低空急流有密切的联系,在海雾的发生发展以及成熟阶段,925 hPa 以下,黄海位于低压前部和高压后部的等压线密集区,西南风急流形成于此区域并不断增强。
海雾消散阶段,850 hPa以下,黄海处于低压后部和高压前部的等压线密集区,该区域偏北风急流的出现加速了海雾的消散。
Parker Compressed Air Dryer安装、运行和维护手册说明书

Bulletin TI-CM0080-35AFigure 1 - Assembly DrawingAll installation, operation, and maintenance procedures for the Parker Compressed Air Dry-ers should be performed by suitable personnel using reasonable care.Warning: Use PTFE tape on all threaded components . Use of pipe sealants other than PTFE tape may damage the membrane and void the warranty.If your dryer system is unassembled, unpack the components and assemble as pictured above (see Figure 1). Following the flow arrow on the compressed air prefilter, attach the inlet of the membrane module to the outlet of the compressed air filter. A tee is provided to allow for vertical or horizontal configuration. (Note: The compressed air filter and separator must be mounted vertically, as shown.)Mount the compressed air dryer to a vertical surface close to the point of use. All mounting hard-ware should be adequately sized to support the weight of the dryer in its mounted position.General DescriptionThese instructions must be thoroughly read and understood before installing and operat-ing this product. Any modification of the unit will result in voiding the warranty. If you have any questions or concerns, please call the Technical Services Department at 800-343-4048, 8AM to 5PM Eastern Time (North America only). For other locations, please contact your localrepresentative.Emailusat:*****************************.The Parker Compressed Air Dryer (see Figure 1) provides clean, dry compressed air from an existing compressed air supply through the use of state-of-the-art membrane technology. The dryers are capable of delivering dry air with a dewpoint of 35°F (2°C), depending on compressed air delivery pressure and flow rate. Flow capacities for the different models are compiled in the Specifications section of this bulletin (page 4). No electrical supply is required to use the Parker Compressed Air Dryer. Each dryer is equipped with a high capacity condensate separator and a high efficiency coalescing prefilter to remove oil, water, and particulate contamination to 0.01 micron. The Parker dryer is available with an additional prefilter for added protection in contami-nated air streams.Installation and OperationAssemblyMountingTechnicalFigure 2 - Recommended Dryer InstallationInstallation and OperationCM SeriesThe compressed air supply pressure should be between 60 psig and 150 psig (4.1 barg and 10.3 barg) for proper operation of the dryer. Dewpoints specified for saturated inlet air at 95°F (35°C) and 100 psig (6.9 barg) for optimal operation of compressed air system. Do not exceed rec-ommended inlet air temperatures or the performance and life of the module may be adversely affected and the warranty will be void. If the dryer is located far from the receiver tank (D) or the air supply comes from an elevated air line, a drip leg must be installed directly upstream from the dryer. If the compressed air supply contains excess water and/or oil, install an additional coalescing prefilter (Grade DX) upstream from the compressed air dryer.A Compressor : Piston, screw, liquid ring*, or vane compressor. Max pressure at the dryer 150 psig, min 60 psi.BAftercooler : Sized to bring the air temperature below 100°F (38°C).C Condensate Separators : Install the first centrifugal separator in line after the aftercooler. This separator removes excesscondensate from the cooling action of the aftercooler. Parker Hannifin recommends a second centrifugal separator after the receiver tank to remove excess condensate that may occur during warmer weather. Separators must be equipped with automatic drains.D Receiver Tank : For vertical tanks, the air line should enter the tank in the lower 1/5th of the vessel, exit at the top 1/5th .For horizontal tanks, the air line should enter through the side of the tank and exit from the top. In either case, install a timed solenoid drain at base of tank.E Pressure Regulator : Install to control line pressure and ensure that it does not exceed 150 psig at the dryer.FDryer System : Shown with three stages of filtration: Separator, DX grade (optional), BX grade. The DX grade may be op-tional in installations far from the compressor. Air flow must be controlled downstream from the dryer to prevent overflow operation.Each drain line should be vented to atmosphere. Do not tie together. Assure that the ambient temperature does not exceed 100°F (38°C) and condensate collected according to local regulations.* In liquid ring compressors, steps should be made to eliminate sources of potential corrosion, such as chlorine from the compressor feedwater. The membrane dryer contains aluminum components which may corrode. Failure to follow these guidelines will void the warranty.Flow control devices should be installed downstream from the dryer, or should be integral to the equipment the dryer is supplying. If the maximum flow rate of the dryer is ex-ceeded, the output air may not meet the published dewpoint specification.The compressed air dryers maintain a constant "sweep" flow to carry water vapor laden air away from the membrane module. This sweep flow may result in a constant "hiss" of air from the inlet end of the module. The total compressed air consumption of the dryer is the sum of the downstream demand plus the "sweep" flow (see specifications section, page 4). The compressed air supply should be adequately sized to supply this volume.Compressed Air40°F MIN. TO 100°F MAX.60PSI MIN. TO 150 PSI MAX.Drain LinesOperationDepressurize the dryer prior to performing any service.The only maintenance required by the compressed air dryer is the annual replacement of the prefilter cartridge and separator cartridge (see Figure 1).*The filter cartridges in the prefilter assemblies are removed by loosening the collar from the filter assembly or turning the bowl 90° counterclockwise, lowering the filter bowl away from the filter head, and unscrewing the element retainer from the base of the cartridge. Insert the new filter cartridge and reassemble the housing in reverse order. The time required to change the prefilter cartridge on the compressed air dryer is approximately 5 minutes. The separator cartridge can be accessed by unscrewing the collar and lowering the bowl awayfrom the housing.* To ensure consistent product performance and reliability use only genuine Balston replacement parts and filter cartridges.** DX Grade for -DX Models only.Operation and MaintenanceCM SeriesMaintenanceThe high efficiency coalescing prefilter integral to the compressed air dryer is equipped with an automatic drain. The drain will pass small quantities of water and compressor oil and should be piped away to a suitable containment device or drain, depending on local waste disposal requirements.To operate the compressed air dryer, simply open the shutoff valve (customer installed) on the inlet air line, adjust the inlet air pressure using the (customer installed) pressure regulator, and adjust the outlet flow using the (customer installed) flow control device.To activate your warranty go to /warranty registrations.For additional information call toll-freeNotes:1 Dewpoint specified for saturated inlet air at 95°F (35°C) and 100 psig (6.9 barg). Outlet flows will vary slightly for other inlet conditions.2 Total Air Consumption =Regeneration + Outlet Flow.3 If compressed air is extremely contaminat-ed, a Grade DX prefilter should be installed directly upstream from the membrane dryer.Member ofParker Hannifin (UK) Ltd Industrial DivisionSuite 42, Kent House, Romney PlaceMaidstone, Kent ME15 6LH United KingdomTel: +44 (0)1622 772440 Fax: +44 (0)1622 \pagParker Hannifin Corporation Filtration and Separation Division 242 Neck RoadHaverhill, MA 01835Tel: 978-858-0505 Fax: 。
65Ma

DOI: 10.1126/science.1059412, 686 (2001);292Science et al.James Zachos,65 Ma to Present Trends, Rhythms, and Aberrations in Global Climate This copy is for your personal, non-commercial use only..clicking here colleagues, clients, or customers by , you can order high-quality copies for your If you wish to distribute this article to others .here following the guidelines can be obtained by Permission to republish or repurpose articles or portions of articles(this information is current as of April 3, 2010 ):The following resources related to this article are available online at /cgi/content/full/292/5517/686version of this article at:including high-resolution figures, can be found in the online Updated information and services, /cgi/content/full/292/5517/686/DC1 can be found at:Supporting Online Material /cgi/content/full/292/5517/686#otherarticles , 27 of which can be accessed for free: cites 61 articles This article 1329 article(s) on the ISI Web of Science. cited by This article has been /cgi/content/full/292/5517/686#otherarticles 89 articles hosted by HighWire Press; see: cited by This article has been/cgi/collection/atmos Atmospheric Science: subject collections This article appears in the following registered trademark of AAAS.is a Science 2001 by the American Association for the Advancement of Science; all rights reserved. The title Copyright American Association for the Advancement of Science, 1200 New York Avenue NW, Washington, DC 20005. (print ISSN 0036-8075; online ISSN 1095-9203) is published weekly, except the last week in December, by the Science o n A p r i l 3, 2010w w w .s c i e n c e m a g .o r g D o w n l o a d e d f r o mregional mantle response.For sites far from the ice sheets,the primary contribution is from the region-al response to the change in water load,although there remains a component of global flow in re-sponse to the distant glacial unloading,and the resulting viscosity estimate will partly reflect man-tle conditions beneath the ice sheets.Likewise,for sites near the rebound centers,the response will be largely determined by the mantle beneath the ice load,but there will remain a smaller component that is determined by mantle conditions further away.Thus,although the regional results should indicate whether lateral variation is likely to be important,they will not lead to definitive values.80.M.Nakada,mbeck,in Glacial Isostasy,Sea -leveland Mantle Rheology ,R.Sabadini,mbeck,E.Boschi,Eds.(Kluwer,Dordrecht,Netherlands,1991),pp.79–94.81.W.R.Peltier,Science 265195(1994).mbeck,J.Geol.Soc.London 152,437(1995).83.,Antiquity 70,588(1996).84.,Earth Planet.Sci.Lett.142,43(1996).85.T.W.Jacobson,Sci.Am.234,343(1976).86.T.H.van Andel,in Landscapes and People of theFranchthi Region ,T.W.Jacobson,Ed.(Indiana Univ.Press,Bloomington,IN,1987),pp.3–64.87.G.Roux,Ancient Iraq (Penguin,London,1992).88.G.Roux,in Initiation in l’Orient Ancien ,J.Botte ´ro,Ed.(Editions du Seuil,Paris,1992),pp.37–56.89.R.Jones,Annu.Rev.Anthropol.24,423(1995).90.R.Cosgrove,J.Allen,B.Marshall,Antiquity 64,59(1990).91.J.F.O’Connell,J.Allen,Evol.Anthropol.6,132(1998).92.A.Thorne et al.,J.Hum.Evol.36,591(1999).93.R.Gru ¨n et al.,J.Hum.Evol.38,733(2000).94.J.Gibb,R.Soc.N.Z.Bull.24,377(1986).95.P.L.Woodworth et al.,Geophys.J.Int.136,651(1999).96.M.Ekman,Global Planet.Change 21,215(1999).R E V I E WTrends,Rhythms,and Aberrations in Global Climate 65Ma to PresentJames Zachos,1*Mark Pagani,1Lisa Sloan,1Ellen Thomas,2,3Katharina Billups 4Since 65million years ago (Ma),Earth’s climate has undergone a signifi-cant and complex evolution,the finer details of which are now coming to light through investigations of deep-sea sediment cores.This evolution includes gradual trends of warming and cooling driven by tectonic pro-cesses on time scales of 105to 107years,rhythmic or periodic cycles driven by orbital processes with 104-to 106-year cyclicity,and rare rapid aberrant shifts and extreme climate transients with durations of 103to 105years.Here,recent progress in defining the evolution of global climate over the Cenozoic Era is reviewed.We focus primarily on the periodic and anomalous components of variability over the early portion of this era,as constrained by the latest generation of deep-sea isotope records.We also consider how this improved perspective has led to the recognition of previously unforeseen mechanisms for altering climate.Through study of sedimentary archives,it has become increasingly apparent that dur-ing much of the last 65million years and beyond,Earth’s climate system has experi-enced continuous change,drifting from ex-tremes of expansive warmth with ice-free poles,to extremes of cold with massive continental ice-sheets and polar ice caps.Such change is not unexpected,because the primary forces that drive long-term climate,Earth’s orbital geometry and plate tecton-ics,are also in perpetual motion.Much of the higher frequency change in climate (104to 105years)is generated by periodic and quasi-periodic oscillations in Earth’s orbit-al parameters of eccentricity,obliquity,and precession that affect the distribution and amount of incident solar energy (Fig.1)(1).Whereas eccentricity affects climate by modulating the amplitude of precession and thus influencing the total annual/seasonalsolar energy budget,obliquity changes the latitudinal distribution of insolation.Be-cause the orbital parameters vary with dis-tinct tempos that remain stable for tens of millions of years (2),they provide a steady and,hence,predictable pacing of climate.The orbitally related rhythms,in turn,oscillate about a climatic mean that is con-stantly drifting in response to gradual changes in Earth’s major boundary condi-tions.These include continental geography and topography,oceanic gateway locations and bathymetry,and the concentrations of atmospheric greenhouse gases (3).These boundary conditions are controlled largely by plate tectonics,and thus tend to change gradually,and for the most part,unidirec-tionally,on million-year (My)time scales.Some of the more consequential changes in boundary conditions over the last 65My include:North Atlantic rift volcanism,opening and widening of the two Antarctic gateways,Tasmanian and Drake Passages (4);collision of India with Asia and sub-sequent uplift of the Himalayas and Tibetan Plateau (5);uplift of Panama and closure of the Central American Seaway (6)(Figs.1and 2);and a sharp decline in pCO 2(7).Each of these tectonically driven events triggered a major shift in the dynamics ofthe global climate system (8–15).More-over,in altering the primary boundary con-ditions and/or mean climate state,some or all of these events have altered system sen-sitivity to orbital forcing (16),thereby in-creasing the potential complexity and di-versity of the climate spectrum.This would include the potential for unusually rapid or extreme changes in climate (17,18).Although Earth’s climatic history has been reconstructed with an array of proxies applied to both marine and terrestrial sedi-ment archives,much of the progress in resolving the rates and scales of Cenozoic climate change can be attributed to the development of high-resolution deep-sea oxygen (␦18O)and carbon (␦13C)isotope records (19).Since the early 1970s,␦18O data have served as the principal means of reconstructing global and regional climate change on a variety of geologic time-scales,from millennial to tectonic.These records are multidimensional in that they provide both climatic and stratigraphic information,and can be quickly generated with automat-ed mass spectrometers.The first marine isotope records were relatively coarse,but still provided valuable insight into the gen-eral structure of the Pleistocene glacial and interglacial cycles (20).These were fol-lowed by records delineating the long-term patterns of Cenozoic climate change (21–23)and,eventually,the first global compi-lation of records for the Cenozoic (resolu-tion of 105to 106years)(24).The last decade has witnessed a rapid growth in the inventory of high-resolution isotope records across the Cenozoic,aided by the greater availability of high-quality sedi-ment cores recovered by the Deep Sea Dril-ling Project (DSDP)and Ocean Drilling Pro-gram (ODP).The improved perspective pro-vided by these records has led to some of the most exciting scientific developments of the1Earth Sciences Department,University of California,Santa Cruz,CA 95064,USA.2Department of Earth and Environmental Sciences,Wesleyan University,Middletown,CT 06459,USA.3Center for the Study of Global Change,Yale University,New Haven,CT 06520–8105,USA.4College of Marine Studies,Uni-versity of Delaware,Lewes,DE 19958,USA.*To whom correspondence should be addressed.E-mail:jzachos@27APRIL 2001VOL 292SCIENCE 686 o n A p r i l 3, 2010w w w .s c i e n c e m a g .o r g D o w n l o a d e d f r o m SCIENCE VOL29227APRIL200168727APRIL 2001VOL 292SCIENCE 688 o n A p r i l 3, 2010w w w .s c i e n c e m a g .o r g D o w n l o a d e d f r o m SCIENCE VOL29227APRIL200168927APRIL 2001VOL 292SCIENCE 690 o n A p r i l 3, 2010w w w .s c i e n c e m a g .o r g D o w n l o a d e d f r o m SCIENCE VOL29227APRIL2001691crossing of a thermal threshold via long-term deep-sea warming (110),to more abrupt deep-sea warming resulting from sudden changes in ocean circulation (113,114),to massive regional slope failure (115).In contrast to the LPTM,the much smaller magnitude and positive carbon isotope excur-sions for the Oi-1and Mi-1events indicate that greenhouse gas forcing was probably not the primary causal mechanism,but instead may have served as a positive or amplifying feedback.In this scenario,tectonic forcing is viewed at the primary triggering mechanism that drives the climate system across a phys-ical threshold (i.e.,temperature),which then initiates rapid growth of ice-sheets along with reorganization of ocean/atmosphere circula-tion (17).The physical changes,in turn,trig-ger large-scale biogeochemical feedbacks in the carbon cycle that initially amplify the climatic changes (18).Such feedbacks would be short-lived,because other coupled biogeo-chemical processes would eventually restore equilibrium to the system.Orbital forcing may have had a hand in triggering these events as well,possibly as a means of providing the climate system with a final and relatively rapid push across a cli-matic threshold,or even as the principal driv-ing force.For example,the Mi-1event ap-pears to be in phase with a long series of regular low-frequency oscillations (i.e.,ϳ400ky cycles)(27).Comparison of the Site 929isotope records with the orbital curve (2),revealed that the low-frequency (400ky)gla-cial maxima,including Mi-1,coincided with,and hence,were being paced by eccentricity minima (60).A normal cycle of low eccen-tricity,however,fails to explain the unusual amplitude of Mi-1.What is unusual is the congruence this low in eccentricity with a protracted node in obliquity (34).This rare orbital alignment involved four consecutive cycles of low-amplitude variance in obliquity (a node)coincident with the low eccentricity that resulted in an extended period (ϳ200ky)of cool summer orbits,and possibly,ice-sheet expansion on Antarctica.In sum,it now appears that extreme aber-rations in global climate can arise through a number of mechanisms.This would explain both the random distribution and frequency of such events over time.Some,such as rare anomalies in Earth’s orbit,are predictable,at least to the extent that the orbital computa-tions are correct.Others,like catastrophic methane release,are less so,although closer scrutiny of earlier time intervals when bound-ary conditions were similar to those preced-ing the LPTM might reveal the existence of similar aberrations (116).Correlation does not necessarily prove causation,but in the case of aberrations,the short time scales in-volved significantly reduces the number of potential variables,thereby rendering the taskof identifying and testing mechanisms a more tractable proposition.Moreover,the abrupt transitions and transients offer a unique op-portunity to study the dynamics of a rapidly changing climate system,as well as the re-sponse of the biosphere and biogeochemical cycles on global or regional scales to signif-icant,sudden changes in greenhouse gas lev-els.To this end,future efforts should concen-trate on establishing,in greater temporal de-tail,the global-and regional-scale changes associated with these short-lived events,par-ticularly in climatically and/or environmen-tally sensitive regions,both marine and ter-restrial (i.e.,high latitudes,tropics,marginal seas,and continental interiors).References and Notes1.J.D.Hays,J.Imbrie,N.J.Shackleton,Science 194,1121(1976).skar,F.Joutel,F.Boudin,Astron.Astrophys.270,522(1993).3.T.J.Crowley,K.G.Burke,Eds.,Tectonic Boundary Conditions for Climate Reconstructions ,vol.39(Ox-ford Univ.Press,New York,1998).wver,L.M.Gahagan,in (3),pp.212–226.5.P.Copeland,in (15),pp.20–40.6.G.H.Haug,R.Tiedemann,Nature 393,673(1998).7.P.N.Pearson,M.R.Palmer,Nature 406,695(2000).8.E.J.Barron,W.H.Peterson,Palaeogeogr.Palaeocli-matol.Palaeoecol.83,1(1991).9.M.E.Raymo,W.F.Ruddiman,Nature 359,117(1992).10.J.E.Kutzbach,W.L.Prell,W.F.Ruddiman,J.Geol.101,177(1993).11.U.Mikolajewicz,E.Maierreimer,T.J.Crowley,K.Y.Kim,Paleoceanography 8,409(1993).12.R.A.Berner,Am.J.Sci.294,56(1994).13.L.C.Sloan,D.K.Rea,Palaeogeogr.Palaeoclimatol.Palaeoecol.119,275(1996).14.U.Mikolajewicz,T.J.Crowley,Paleoceanography 12,429(1997).15.W.F.Ruddiman,Ed.,Tectonic Uplift and ClimateChange (Plenum,New York,1997).16.D.A.Short,J.G.Mengel,T.J.Crowley,W.T.Hyde,G.R.North,Quat.Res.35,157(1991).17.T.J.Crowley,G.R.North,Science 240,996(1988).18.J.C.Zachos,K.C.Lohmann,J.C.G.Walker,S.W.Wise,J.Geol.101,191(1993).19.All data are expressed in the delta notation ␦(‰)ϭ(18O/16O samp /18O/16O standard Ϫ1)1000,and are reported relative to the VPDB (Vienna Pee Dee Belem-nite)standard.The ratios of the stable isotopes of oxygen (18O/16O)in the calcite (CaCO 3)shells of marine organisms such as benthic foraminifera provide information on temperature and the isotopic compo-sition of seawater (i.e.,ice volume).In general,calcite ␦18O increases as temperature decreases (0.25‰/°C),or as the mass of continental ice increases (0.1‰/10m sea-level change).The ratios of stable carbon iso-topes (13C/12C)in benthic foraminifera,on the other hand,reflect on changes in the ratio of the dissolved inorganic carbon (DIC)of ambient seawater.Secular variations in the mean ␦13C DIC of the ocean,in turn,reflect on changes in the rates of carbon supply and removal from organic and inorganic reservoirs [Web note 2(36)](38).20.C.Emiliani,G.Edwards,Nature 171,887(1953).21.N.J.Shackleton,J.P.Kennett,in Initial Reports ofthe Deep Sea Drilling Project (ernment Printing Office,Washington,DC,1975),vol.29,pp.743–755.22.S.M.Savin,R.G.Douglas,F.G.Stehli,Geol.Soc.Am.Bull.86,1499(1975).23.R.K.Matthews,R.Z.Poore,Bull.Am.Assoc.Petrol.Geol.65,954(1981).ler,M.E.Katz,Micropaleontology 33,97(1987).25.J.P.Kennett,L.D.Stott,Nature 353,225(1991).26.T.J.Bralower et al.,Paleoceanography 10,841(1995).27.J.C.Zachos,B.P.Flower,H.Paul,Nature 388,567(1997).28.S.Bains,R.M.Corfield,R.D.Norris,Science 285,724(1999).29.N.J.Shackleton,S.J.Crowhurst,G.P.Weedon,J.Laskar,Philos.Trans.R.Soc.London Ser.A 357,1907(1999).30.U.Ro ¨hl,T.J.Bralower,R.D.Norris,G.Wefer,Geology 28,927(2000).31.L.R.Kump,M.A.Arthur,in (15),pp.399–426.32.L.C.Sloan,J.C.G.Walker,T.C.Moore,D.K.Rea,J.C.Zachos,Nature 357,320(1992).33.G.R.Dickens,J.R.O’Neil,D.K.Rea,R.M.Owen,Paleoceanography 10,965(1995).34.J.C.Zachos,N.J.Shackleton,J.S.Revenaugh,H.Pa ¨like,B.P.Flower,Science 292,274(2001).35.J.Alroy,P.L.Koch,J.C.Zachos,in Deep Time:Paleobiology’s Perspective ,D.H.Erwin,S.L.Wing,Eds.(The Paleontological Society,Lawrence,KS,2000),vol.26,pp.259–288.36.Supplementary material is available at www./cgi/content/full/292/686/5517/DC1.37.W.A.Berggren,D.V.Kent,C.C.I.Swisher,M.-P.Aubry,in Geochronology Time Scales and Global Stratigraphic Correlation ,D.V.Kent,M.-P.Aubry,J.Hardenbol,Eds.(Society for Sedimentary Geology,Tulsa,OK,1995),vol.54,pp.129–212.38.N.J.Shackleton,Geol.Soc.Spec.Publ.26,423(1987).39.J.D.Wright,ler,in The Antarctic Paleoen-vironment:A Perspective on Global Change ,J.P.Kennet,D.A.Warnke,Eds.(American Geophysical Union,Washington,DC,1993),pp.1–25.40.The presumption of a negligible contribution fromice sheets prior to the earliest Oligocene,and large ice-sheets thereafter,is supported by several lines of evidence,including the distribution of glacioma-rine sediment or ice-rafted debris near or on Ant-arctica,and by changes in the distribution and abun-dances of clay minerals associated with physical weathering in proximal margin and deep-sea sedi-ments (47,48,117–122).41.J.C.Zachos,L.D.Stott,K.C.Lohmann,Paleocean-ography 9,353(1994).42.C.H.Lear,H.Elderfield,P.A.Wilson,Science 287,269(2000).43.J.E.Francis,Arctic 41,314(1988).44.L.D.Stott,J.P.Kennet,Proc.Ocean Drill.ProgramSci.Results 113,849(1990).45.E.Barrera,B.T.Huber,Proc.Ocean Drill.ProgramKerguelen Plateau Prydz Basin 119,736(1991).46.P.W.Ditchfield,J.D.Marshall,D.Pirrie,Palaeo-geogr.Palaeoclimatol.Palaeoecol.107,79(1994).47.R.V.Dingle,S.A.Marenssi,velle,J.S.Am.EarthSci.11,571(1998).48.M.J.Hambrey,W.U.Ehrmann,rsen,Proc.Ocean Drill.Program Sci.Results 119,77(1991).49.J.D.Wright,ler,R.G.Fairbanks,Paleocean-ography 7,357(1992).ler,J.D.Wright,R.G.Fairbanks,J.Geophys.Res.96,6829(1991).51.E.Vincent,J.S.Killingley,W.H.Berger,Geol.Soc.Am.Mem.163,103(1985).52.B.P.Flower,Paleoceanography 10,1095(1995).53.J.P.Kennett,P.F.Barker,Proc.Ocean Drill.ProgramSci.Results 113,937(1990).54.J.Thiede,T.O.Vorren,Mar.Geol.119,179(1994).55.R.Z.Poore,L.C.Sloan,Mar.Micropaleontol.27,1(1996).56.N.J.Shackleton,J.Imbrie,N.G.Pisias,Philos.Trans.R.Soc.London Ser.B 318,679(1988).57.M.A.Maslin,X.S.Li,M.F.Loutre,A.Berger,Quat.Sci.Rev.17,411(1998).58.R.Tiedemann,M.Sarnthein,N.J.Shackleton,Pale-oceanography 9,619(1994).59.B.P.Flower,J.P.Kennett,Palaeogeogr.Palaeocli-matol.Palaeoecol.108,537(1994).60.H.A.Paul,J.C.Zachos,B.P.Flower,A.Tripati,Paleoceanography 15,471(2000).61.J.C.Zachos,T.M.Quinn,K.A.Salamy,Paleocean-ography 11,251(1996).27APRIL 2001VOL 292SCIENCE 692 o n A p r i l 3, 2010w w w .s c i e n c e m a g .o r g D o w n l o a d e d f r o m62.K.A.Salamy,J.C.Zachos,Palaeogeogr.Palaeocli-matol.Palaeoecol.145,61(1999).63.M.Mudelsee,K.Stattegger,Geol.Rundsch.86,499(1997).64.W.F.Ruddiman,M.Raymo,A.McIntyre,Earth Plan-et.Sci.Lett.80,117(1986).65.M.Raymo,W.F.Ruddiman,N.J.Shackleton,D.Oppo,Earth Planet.Sci.Lett.97,353(1992).66.A.C.Mix et al.,Proc.Ocean Drill.Program Sci.Results 138,371(1995).67.S.C.Clemens,R.Tiedemann,Nature 385,801(1997).68.L.Diester-Haass,R.Zahn,Geology 24,163(1996).69.D.P.Schrag,G.Hampt,D.W.Murray,Science 272,1930(1996).70.N.J.Shackleton,Science 289,1897(2000).71.,M.Hall,Proc.Ocean Drill.Program Sci.Results 154,367(1997).72.K.Billups,A.C.Ravelo,J.C.Zachos,Paleoceanogra-phy 13,459(1998).73.E.Thomas,N.J.Shackleton,in Correlation of theEarly Paleogene in Northwest Europe ,R.O.Knox,R.M.Corfield,R.E.Dunay,Eds.(Geologic Society,London,1996),vol.247,pp.481–496.74.D.C.Kelly,T.J.Bralower,J.C.Zachos,I.P.Silva,E.Thomas,Geology 24,423(1996).75.D.J.Thomas,T.J.Bralower,J.C.Zachos,Paleocean-ography 14,561(1999).76.C.Robert,J.P.Kennett,Mar.Geol.103,99(1992).77.T.G.Gibson,L.M.Bybell,D.B.Mason,Sediment.Geol.134,65(2000).78.P.L.Koch,J.C.Zachos,P.D.Gingerich,Nature 358,319(1992).79.R.M.Corfield,Earth Sci.Rev.37,225(1994).80.D.Beerling,D.W.Jolley,J.Geol.Soc.London 155,591(1998).81.B.Schmitz et al.,Palaeogeogr.Palaeoclimatol.Palaeoecol.133,49(1997).82.E.Thomas,in Late Paleocene Early Eocene Climaticand Biotic Events in the Marine and Terrestrial Records ,M.P.Aubry,S.G.Lucas,W.A.Berggren,Eds.(Columbia Univ.Press,New York,1998),pp.214–243.83.G.Y.Lu,T.Adatte,G.Keller,N.Ortiz,Eclogae Geol.Helv.91,293(1998).84.E.M.Crouch et al.,Geology 29,315(2001).85.P.L.Koch,J.C.Zachos,D.L.Dettman,Palaeogeogr.Palaeoclimatol.Palaeoecol.115,61(1995).86.W.C.Clyde,P.D.Gingerich,Geology 26,1011(1998).87.S.L.Wing,in (85),pp.380–400.88.K.C.Beard,M.R.Dawson,Bull.Soc.Geol.Fr.170,697(1999).89.S.Bains,R.D.Norris,R.M.Corfield,K.L.Faul,Nature407,171(2000).90.D.J.Beerling,Palaeogeogr.Palaeoclimatol.Palaeo-ecol.161,395(2000).91.J.G.Baldauf,in Eocene-Oligocene Climatic and Bi-otic Evolution ,D.A.Prothero,W.A.Berggren,Eds.(Princeton Univ.Press,Princeton,NJ,1992),pp.310–326.92.E.Thomas,J.C.Zachos,T.J.Bralower,in WarmClimates in Earth History ,B.Huber,K.G.MacLeod,S.L.Wing,Eds.(Cambridge Univ.Press,New York,2000),pp.132–160.93.The calcite compensation depth (CCD)representsthe depth in the ocean at which dissolved carbon-ate ion content [CO 3]transitions from being sat-urated to undersaturated.Virtually no biogenic calcite is preserved in sediments beneath this level,which at present is roughly 4500m in the Atlantic and 3500m in the Pacific.Because the degree of [CO 3]saturation is sensitive to fluxes of respired CO 2and dissolved ions to the ocean,the CCD is constantly changing with time.94.T.H.Van Andel,Earth Planet.Sci.Lett.26,187(1975).95.N.J.Shackleton,M.A.Hall,I.Raffi,L.Tauxe,J.Zachos,Geology 28,447(2000).96.D.R.Prothero,W.A.Berggren,Eds.,Late Eocene-Oligocene Climatic and Biotic Evolution (Princeton Univ.Press,Princeton,NJ,1992).97.R.E.Fordyce,Am.Paleontologist 8,2(2000).98.J.A.Wolfe,in Cenozoic Climate and Paleogeo-graphic Changes in the Pacific Region ,K.Ogasawara,J.A.Wolfe,Eds.(1994).99.E.N.Edinger,M.J.Risk,Palaios 9,576(1994).100.M.Pagani,M.A.Arthur,K.H.Freeman,Paleocean-ography 14,273(1999).101.P.Huybrechts,Geografiska Annaler Stockholm 75A ,221(1993).102.L.R.Bartek,S.A.Henrys,J.B.Anderson,P.J.Barrett,Mar.Geol.130,79(1996).103.N.W.Driscoll,G.H.Haug,Science 282,436(1998).104.L.J.Lourens,F.J.Hilgen,Quat.Int.40,43(1997).105.B.Cramer,Earth Planet.Sci.Lett.,in press.106.W.F.Ruddiman,A.McIntyre,Science 212,617(1981).107.N.G.Pisias,A.C.Mix,R.Zahn,Paleoceanography 5,147(1990).108.T.J.Crowley,K.-Y.Kim,J.G.Mengel,D.A.Short,Science 255,705(1992).109.T.D.Herbert,Proc.Natl.Acad.Sci.U.S.A.94,8362(1997).110.G.R.Dickens,M.M.Castillo,J.C.G.Walker,Geology25,259(1997).111.G.R.Dickens,Bull.Soc.Geol.Fr.171,37(2000).112.J.C.Zachos,G.R.Dickens,GFF 122,188(2000).113.K.Kaiho et al.,Paleoceanography 11,447(1996).114.T.J.Bralower et al.,Geology 25,963(1997).115.M.E.Katz,D.K.Pak,G.R.Dickens,ler,Science 286,1531(1999).116.S.P.Hesselbo et al.,Nature 406,392(2000).117.A.Berger,M.F.Loutre,Quat.Sci.Rev.10,297(1991).118.N.J.Shackleton,M.A.Hall,A.Boersma,InitialReports of the Deep Sea Drilling Project (-ernment Printing Office,Washington,DC,1984),vol.74,pp.599–612.119.P.J.Barrett,C.J.Adams,W.C.McIntosh,C.C.Swisher,G.S.Wilson,Nature 359,816(1992).120.S.W.Wise,J.R.Breza,D.M.Harwood,W.Wei,inControversies in Modern Geology (Academic,San Diego,CA,1991),pp.133–171.121.W.U.Ehrmann,A.Mackensen,Palaeogeogr.Palaeo-climatol.Palaeoecol.93,85(1992).122.J.C.Zachos,J.R.Breza,S.W.Wise,Geology 20,569(1992).123.W.Ehrmann,Palaeogeogr.Palaeoclimatol.Palaeo-ecol.139,213(1998).124.P.F.Barker,P.J.Barrett,A.K.Cooper,P.Huybrechts,Palaeogeogr.Palaeoclimatol.Palaeoecol.150,247(1999).125.Supported by NSF grant EAR-9814883. SCIENCE VOL 29227APRIL 2001693o n A p r i l 3, 2010w w w .s c i e n c e m a g .o r g D o w n l o a d e d f r o m。
Unit 4 Warming up and Reading 课件-高中英语人教新课标选修六

• 大气层
8. fossil fuel
• 化石燃料
9. carbon dioxide
• 二氧化碳
10. renewable source
• 可再生资源
11. non-renewable source
• 不可再生资源
12. Natural resources
• 天然资源
• Now that we have learned some sources of energy are non-renewable, What should we do with energy ?
Carbon dioxide has caused the global temperature to __g_o__u_p____. An increase of five degrees would be a _c_a_ta_s_t_r_o_p_h_e_ and could be _v_e_r_y__s_e_ri_o_u_s__.
giving examples, using graphs, explanation
Part3 (6)
List two different attitudes among scientists towards global warming.
giving examples, making contrast
makes the greenhouse
_h_e_a_t_u_p___and so the
plants can grow throughout the cold period.
What function do greenhouse gases play?
Greenhouse gases perform the same function
NBR rubber foam manufacturer
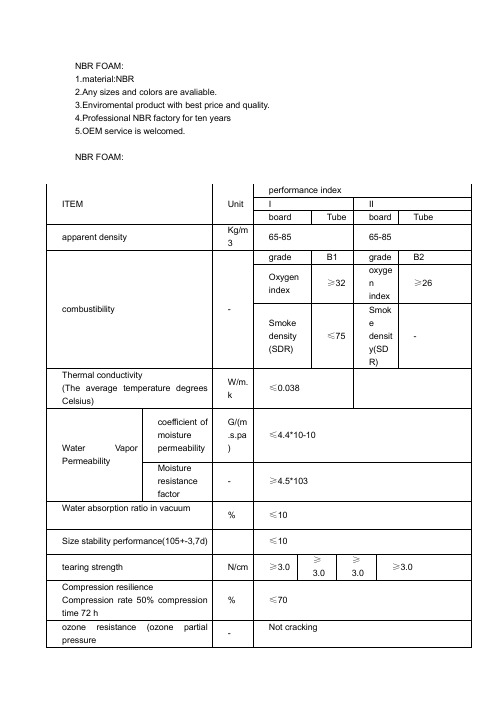
NBR FOAM:1.material:NBR2.Any sizes and colors are avaliable.3.Enviromental product with best price and quality.4.Professional NBR factory for ten years5.OEM service is welcomed.NBR FOAM:ITEM Unit performance indexI IIboard Tube board Tubeapparent density Kg/m365-85 65-85combustibility - grade B1 grade B2Oxygenindex≥32oxygenindex≥26Smokedensity(SDR)≤75Smokedensity(SDR)-Thermal conductivity(The average temperature degrees Celsius) W/m.k≤0.038Water Vapor Permeability coefficient ofmoisturepermeabilityG/(m.s.pa)≤4.4*10-10Moistureresistancefactor- ≥4.5*103Water absorption ratio in vacuum% ≤10 Size stability performance(105+-3,7d) ≤10tearing strength N/cm ≥3.0 ≥3.0≥3.0≥3.0Compression resilienceCompression rate 50% compressiontime 72 h% ≤70ozone resistance (ozone partial pressure -Not cracking202Pa 200h)ageing resistance (150h) - Slight wrinkle, no crack, no pinhole, deformation NBR rubber foaming product does not contain the damag e the ozone layer of atmosphere of chlorine fluoride. Production process does not produce waste gas andwater, toxic wastes, not a fibrous, construction installation process won't stimulate theskin, not endanger human body health, accord with environmenta l protection requirementof the international ISO14000.Rubber and plastic products have good characteristics of rubber, after production process improvement, material modification, the company plastic foaming products in itsoriginal good performance, and on the basis of naisuanjian corrosion ability, ultravioletability, ability to further improve the ozone resistance, anti-aging performanceenhancement, the service life is longer.Shanghai Jingke Industrial Co.,Ltd pleased to provide you all kinds of NBR foamproduct,welcome to contact us anytime!Shanghai Jingke Industrial Co.,ltd was established in 2002,Shanghai,China.We have over 235 employees, an annual sales figure that exceeds USD50 million and arecurrently exporting 60% of our products worldwide.Main Market:USA, Canada, South America, Australia, the Middle East and Southeast Asian countriesMain Products:EV A foam, PE foam(XPE ,IXPE),CR foam,SBR foam,EPDM foam,NBR/PVC foammaterials ,EPE foam,LDPE foam,PEF foam,PU foam and so on.We also produce:Foam Tape (PE foam tape,EV A foam tape,Double Sticky Tape ,etc),Heat Insulation Materials(PEinsulating tube ,NBR insulating tube,etc),Y ogo mat,Camping Mat,Floor Mats,Mouse Pad,CornerProtection,Inner Lining,EV A art products,Non-slip mat,Sports Equipments and so on.Shanghai Jingke Industrial Co.,LtdContact:Ms.Peggy ZhangAdd:No.2548,Zhennan Road,Putuo Area, Shanghai China(Urban Industrial Zone) Tel:86-021-********-818Fax:86-021-********Email:peggy@Msn:morning20101@Skype:mylove...80 (morning)W eb: 。
地球化学之氮循环
8」2地球氮循环8.12.1介绍&12.2生物地球化学反应& 12.2.1初始反应:活性氮的产生8.12.2.2大气圈8.12.2.2.1无机还原氮8.12.2.2.2无机氧化氮8.12.2.2.3还原有机氮8.12.2.2.4氧化有机氮8.12.2.3生物圈&12.3氮库及英交换8.12.3.1陆地到大气8.12.3.2海洋到大气8.12.3.3大气到表面8.12.3.4陆地到海洋&12.4产生活性氮8」2.4.1介绍8」2.4.2闪电一一自然8」2.4.3陆地生物固氮——自然8.12.4.4人类活动8.12.4.4J 介绍8.12.4.4.2食品生产8.12.4.4.3能量产物8」2.4.5从1860到2000产生活性氮的速率8.12.5全球陆地氮收支8.12.5.1 介绍& 12.5.2产生活性氮2.5.3活性氮的分布& 12.5.4活性氮转化成氮气8.12.6全球海洋氮收支8.12.7区域氮预算8.12.8结果8.12.&1 介绍8.12.&2大气圈&12.&3陆地生态系统8.12.8.4水生生态系统8.12.9展望8.12.10 总结致谢参考文献8.12.1介绍曾几何时,氮气不存在。
今天它却存在。
在宇宙形成的这段时间里,氮气被创造岀来, 地球诞生了,它的大气和海洋也形成了!在对地球氮循环的分析中,我首先概述了与氮有关的重要事件,然后继续进行更为传统的氮循环本身的分析以及人类在其变化中的作用。
宇宙有150亿年。
即使在形成之后,仍然存在一段不存在氮的时期。
在大爆炸发30万年后,宇'由需要足够的冷却来创造原子:氢和氮首先形成。
氮通过核合成过程形成在恒星中。
当恒星的质量变得足够大以达到必要的压力和温度时,氨气开始融合成更重的元素,包括氮。
在地球形成之前已经过去了100亿年(45亿年前),这是由于多级过程中预装配材料的积累。
Aspen培训资料03
Aspen Plus® 11 Update for Version 10 Users
© 2002 AspenTech. All Rights Reserved.
Lesson Objectives
• Review updates to Columns, Heat exchangers, and Reactors; plus new Manipulator blocks
– Reduce utilities cost – Improve energy efficiency – Reduce capital investment (by improved driving forces) – Facilitate column debottlenecking
• These capabilities are available for the RadFrac, MultiFrac, and PetroFrac column models.
© 2002 AspenTech. All Rights Reserved.
Column Targeting (2)
• The thermal analysis capability is based on the concept of minimum thermodynamic condition for a distillation column. The minimum thermodynamic condition pertains to thermodynamically reversible column operation.
on any given section of the column.
提高超细纤维合成革透湿透气性能的研究进展
提高超细纤维合成革透湿透气性能的研究进展刘凡;钱晓明【摘要】本文简要介绍了超细纤维合成革与天然皮革的结构与特点,指出了超细纤维合成革相比天然皮革透湿透气性差的原因,综述了提高超细纤维合成革透湿透气性能的方法——革基布改性、聚氨酯树脂改性以及加工工艺的改进.【期刊名称】《纺织导报》【年(卷),期】2017(000)008【总页数】3页(P78-80)【关键词】超细纤维合成革;透湿透气性;改性方法【作者】刘凡;钱晓明【作者单位】天津工业大学纺织学院;天津工业大学纺织学院【正文语种】中文【中图分类】TS56天然皮革是由动物毛皮经过物理化学处理后而制成的高分子材料,具有优良的耐化学、耐细菌、耐热湿稳定性能,弹性好,穿着舒适,广受消费者的喜爱。
但是近年来随着资源环境因素的影响,真皮开发受到限制,开发性能优良的超细纤维合成革是目前代替天然皮革的最佳途径。
以下主要介绍超细纤维合成革与天然皮革的结构及特性,分析超细纤维合成革透湿透气性差的成因,探讨了提高超细纤维合成革透湿透气性能的方法。
1.1 天然皮革的结构与特点天然皮革基本由胶原纤维构成,占全部质量的95% ~98%,结构基本分为 3 层:粒面层、过渡层和网状层。
表面称为粒面层,纤细的胶原纤维水平地布满表面,形成致密紧实的层结构及自然美观的凹凸纹路;其下面一层是由毛管、血管、汗腺等空洞组成的过渡层;再往下是由粗壮的胶原纤维相互交联形成的网状层。
从粒面层到网状层,具有纤维纤度和编织结构的连续变化。
作为典型的两性聚合电解质,天然皮革中的胶原蛋白包含许多氨基和活性基团,具有显著的亲水性和生物相容性,胶原蛋白以及内部所形成的独特的三维立体编织结构使天然皮革具有良好的透湿导湿性能以及透气性能,穿着舒适,广受消费者的喜爱。
1.2 超细纤维合成革的结构与特点超细纤维合成革,简称超纤革,是以超细纤维为原料制作的非织造布为基布,在基布上浸渍聚氨酯浆料,再经一系列复杂工艺加工而成的第 3 代人工革。
ZSM-5性能调控及其催化裂解石油轻组分研究进展
第51卷第5期2022年5月应用化工Applied Chemical IndustryVol.51No.5May2022 ZSM-5性能调控及其催化裂解石油轻组分研究进展张莹V,焦念明彳,张凯伦2,3,张香平1,2,李涛1,王慧2,4(1.郑州大学化工学院,河南郑州450001;2.中国科学院绿色过程制造创新研究院中国科学院过程工程研究所离子液体清洁过程北京市重点实验室,北京100190;3.中国科学院大学化学科学学院,北京100049;4.郑州中科新兴产业技术研究院,河南郑州450000)摘要:总结了ZSM-5酸性和孔结构的调控方法,包括:碱金属与碱土金属、过渡金属、稀土金属、非金属元素以及复合金属的掺入调控酸性;酸碱处理、水蒸气处理和引入模板剂等调控孔道结构,并综述了近年来改性分子筛在石油轻组分催化裂解中的应用进展。
在此基础上,分析了ZSM-5分子筛在催化裂解过程中存在的主要问题,并对其发展前景进行了展望。
关键词:ZSM-5分子筛;性能调控;石油轻组分;催化裂解中图分类号:TQ530.51文献标识码:A文章编号:1671-3206(2022)05-1433-06Research progress on modification of ZSM-5and its catalyticperformance in cracking of light components in petroleumZHANG Ying1-2JIAO Nian-ming2,ZHANG Kai-lun'3,ZHANG Xiang-ping'1,LI Tao,WANG Hui2'4(1.School of Chemical Engineering,Zhengzhou University,Zhengzhou450001,China;2.Beijing Key Laboratoryof Ionic Liquids Clean Process,Institute of Process Engineering,Innovation Academy for Green Manufacture, Chinese Academy of Sciences,Beijing100190,China;3.School of Chemical Sciences,University of Chinese Academy of Sciences,Beijing100049,China;4.Zhengzhou Institute of Emerging Industrial Technology,Zhengzhou450000,China)Abstract:This review summarizes the methods to modify the acidity and pore structure of ZSM-5:the introduction of alkali metals and alkaline earth metals,transition metals,rare earth metals,nonmetal elements and composite metals to regulate the acidity;treatment by acid-base,or water vapor treatment or introduction of a template agent to modify the channel structure・Moreover,the application of modified ZSM-5in catalytic cracking of light components in petroleum in recent years is reviewed.Based on the current progress,the problems in catalytic cracking by ZSM-5are analyzed,and the development prospects of ZSM-5are given.Key words:ZSM-5molecular sieve;property modification;light components of petroleum;catalytic cracking乙烯和丙烯是重要基础有机化工原料,通过不同路线高效获得乙丙烯是石化行业不断追求的重点之一。
Q235_碳钢表面SiO2
第52卷第9期表面技术2023年9月SURFACE TECHNOLOGY·209·Q235碳钢表面SiO2/PDMS超疏水涂层的制备及防腐性能研究于元昊,董玉花,邢静,陈亚敏,宁浩良,赵彤,彭淑鸽*(河南科技大学 化学化工学院 洛阳市产业废物资源化利用工程重点实验室,河南 洛阳 471000)摘要:目的提高Q235碳钢的耐腐蚀性能。
方法在Q235表面先提拉聚二甲基硅氧烷(PDMS),预固化后再次提拉含疏水气相二氧化硅的PDMS分散液,完全固化后在Q235表面构建一个SiO2/PDMS超疏水涂层。
通过扫描电镜、激光共聚焦显微镜、能谱、接触角、砂纸磨损、划格试验对涂层的形貌、结构和表面性质进行分析;采用电化学工作站对涂层的耐腐蚀性和耐久性进行评价。
结果SiO2纳米粒子被镶嵌在PDMS中,在Q235表面形成了一种微纳粗糙结构,平均粗糙度为2.2 μm;涂层表面能仅为5.6 mJ/m2,接触角为152.6°;涂层机械稳定性和结合力优异,砂纸磨损15个周期及划格试验30个周期后,仍保持超疏水。
电化学研究表明,在Q235表面引入SiO2/PDMS后,阻抗提升了2个数量级,电容降低了6个数量级;腐蚀电位正向移动了0.419 2 V,腐蚀电流密度降低了3个数量级;涂层对Q235的防腐效率高达99.8%,呈现出优异的耐腐蚀性。
在腐蚀液中浸泡一周后,SiO2/PDMS涂层仍保持超疏水和优异的耐腐蚀性,表明涂层耐久性良好。
结论以PDMS为疏水层,纳米SiO2为填料构筑粗糙表面,通过条件控制实现防腐底层和超疏水表层间的界面融合,从而引入稳定的SiO2/PDMS超疏水涂层,提高了Q235的耐腐蚀性和耐久性。
本研究为在金属表面构筑稳定的超疏水涂层提供了一种方法,有望拓展金属在恶劣环境中的应用。
关键词:超疏水;耐腐蚀;复合涂层;Q235碳钢;聚二甲基硅氧烷;SiO2中图分类号:TG172 文献标识码:A 文章编号:1001-3660(2023)09-0209-11DOI:10.16490/ki.issn.1001-3660.2023.09.017Preparation and Anti-corrosion Properties of SiO2/PDMSSuper-hydrophobic Coating on Q235 Carbon Steel YU Yuan-hao, DONG Yu-hua, XING Jing, CHEN Ya-min, NING Hao-liang, ZHAO Tong, PENG Shu-ge*(Luoyang Key Laboratory of Industrial Waste Resource Utilization, School of Chemistry & Chemical Engineering,Henan University of Science and Technology, Henan Luoyang 471000, China)ABSTRACT: Metal corrosion has brought huge losses to human society, so it is of great significance to study the corrosion and protection of materials. To improve the corrosion resistance of Q235 carbon steel, the work aims to prepare the SiO2/PDMS super-hydrophobic coating on the surface of Q235, and discuss the corrosion resistance and mechanism of the composite coating.收稿日期:2022-07-15;修订日期:2022-12-13Received:2022-07-15;Revised:2022-12-13基金项目:国家自然科学基金(22175057)Fund:The National Natural Science Foundation of China (22175057)引文格式:于元昊, 董玉花, 邢静, 等. Q235碳钢表面SiO2/PDMS超疏水涂层的制备及防腐性能研究[J]. 表面技术, 2023, 52(9): 209-219. YU Yuan-hao, DONG Yu-hua, XING Jing, et al. Preparation and Anti-corrosion Properties of SiO2/PDMS Super-hydrophobic Coating on Q235·210·表面技术 2023年9月In this study, Q235 with a diameter of 13.5 mm and a thickness of 2.0 mm was selected as the metal substrate, and was ultrasonically cleaned by acetone, ethanol and deionized water respectively. Then, the pretreated Q235 was immersed in polydimethylsiloxane (PDMS) dispersion and hydrophobic vapor silica nanoparticles/PDMS dispersion successively, and was pulled at a speed of 1 mm/min to introduce SiO2/PDMS super-hydrophobic composite coating on the surface of Q235. The morphology, microstructure, and surface characteristics were investigated by field emission scanning electron microscope (FESEM, JSM-7610FPlus), confocal laser scanning confocal microscope (CLSM, KEYENCE/VK-X1100), energy dispersive X-ray spectrometer (EDS), contact angle measuring instrument (SDC-100), sandpaper abrasion test, knife scratching and tape stripping test. The anti-corrosion property of the SiO2/PDMS super-hydrophobic coating was evaluated by electrochemical impedance spectrum (EIS) and Tafel polarization curve with 3.5wt.% sodium chloride solution as the corrosive medium. The FESEM, CLSM and EDS characterization results showed that the SiO2/PDMS super-hydrophobic coating had been successfully coated on the surface of Q235, and the surface of Q235 became rough and presented a strewn gully structure after the super-hydrophobic coating modification. The average roughness was2.2 μm. The surface energy of coating was only 5.6 mJ/m2, the contact angle was 152.6°, and the coating remainedsuper-hydrophobic after 15 cycles of sandpaper wear and 30 cycles of taping and peeling, indicating that the surface of Q235 had excellent super-hydrophobicity. In addition, the EIS results showed that the introduction of SiO2/PDMS super-hydrophobic coating on the surface of Q235 increased the impedance value by two orders of magnitude and decreased the capacitance value by six orders of magnitude. The Tafel curve showed that the corrosion potential of super-hydrophobic coating/Q235 was 0.419 2 V higher than that of the bare Q235, the corrosion current was reduced by three orders of magnitude, and the protection efficiency of the coating could be as high as 99.8%, demonstrating that the coating had excellent corrosion resistance. In addition, the durability test showed that the SiO2/PDMS coating retained super-hydrophobicity and excellent corrosion resistance after a week of immersion in corrosion solution, implying that the SiO2/PDMS coating had good anti-corrosion durability.In conclusion, with PDMS as hydrophobic coating and SiO2 nanoparticles as filler to construct rough surface, a stable SiO2/PDMS super-hydrophobic coating can be prepared on the surface of Q235 by a simple dipping and pulling process. The dense PDMS coating plays a shielding role on the corrosive solution, and its excellent adhesion makes it become the intermediate bridge between the metal substrate and SiO2. The introduction of nano-sized SiO2 makes the surface of Q235 showa rough structure of microscopic convex, and enhances the stability of the system. The synergistic effect of PDMS and SiO2realizes the transformation from hydrophilic to super-hydrophobic surface of Q235 and improves the corrosion resistance of Q235. This study provides a facile method to construct a robust super-hydrophobic surface on metal surface, which is expected to expand the application of metal in harsh environment.KEY WORDS: super-hydrophobic; anti-corrosion; composite coating; Q235 carbon steel; polydimethylsiloxane; SiO2Q235碳钢作为一种重要的金属工程材料,在交通建筑、制造业、航空等行业中应用广泛。
- 1、下载文档前请自行甄别文档内容的完整性,平台不提供额外的编辑、内容补充、找答案等附加服务。
- 2、"仅部分预览"的文档,不可在线预览部分如存在完整性等问题,可反馈申请退款(可完整预览的文档不适用该条件!)。
- 3、如文档侵犯您的权益,请联系客服反馈,我们会尽快为您处理(人工客服工作时间:9:00-18:30)。
Humanmodificationofglobalwatervaporflowsfromthelandsurface
LineJ.Gordon*†,WillSteffen‡,BrorF.Jo¨nsson§,CarlFolke*,MalinFalkenmark¶,andÅseJohannessen*Departmentsof*SystemsEcologyand§Meteorology,StockholmUniversity,SE-10691Stockholm,Sweden;‡BureauofRuralSciences,DepartmentofAgriculture,FisheriesandForestry,AustralianGovernment,G.P.O.Box858,CanberraACT2601,Australia;and¶StockholmInternationalWaterInstitute,Hantverkargatan5,SE-11221Stockholm,Sweden
EditedbyStephenR.Carpenter,UniversityofWisconsin,Madison,WI,andapprovedApril11,2005(receivedforreviewJanuary10,2005)ItiswelldocumentedthathumanmodificationofthehydrologicalcyclehasprofoundlyaffectedtheflowofliquidwateracrosstheEarth’slandsurface.Alterationofwatervaporflowsthroughland-usechangeshasreceivedcomparativelylessattention,de-spitecompellingevidencethatsuchalterationcaninfluencethefunctioningoftheEarthSystem.Weshowthatdeforestationisaslargeadrivingforceasirrigationintermsofchangesinthehydrologicalcycle.Deforestationhasdecreasedglobalvaporflowsfromlandby4%(3,000km3͞yr),adecreasethatisquantitativelyaslargeastheincreasedvaporflowcausedbyirrigation(2,600km3͞yr).Althoughthenetchangeinglobalvaporflowsisclosetozero,thespatialdistributionsofdeforestationandirrigationaredifferent,leadingtomajorregionaltransformationsofvapor-flowpatterns.Weanalyzethesechangesinthelightoffutureland-use-changeprojectionsthatsuggestwidespreaddeforestationinsub-SaharanAfricaandintensificationofagriculturalproductionintheAsianmonsoonregion.Furthermore,significantmodificationofvaporflowsinthelandsaroundtheIndianOceanbasinwillincreasetheriskforchangesinthebehavioroftheAsianmonsoonsystem.Thisanalysissuggeststhattheneedtoincreasefoodproductioninoneregionmayaffectthecapabilitytoincreasefoodproductioninanother.AtthescaleoftheEarthasawhole,ourresultsemphasizetheneedforclimatemodelstotakeland-usechange,inbothlandcoverandirrigation,intoaccount.
deforestation͉irrigation͉land-usechanges͉climatechange͉evapotranspiration
Meetingwaterrequirementsforfuturefoodproduction
withoutcompromisingthewaterneedsofotherhumanlife-supportsystemsisamajorchallengeforfuturefreshwatermanagement(1,2).Foodproductioninvolvesthetransformationofliquidwater(fromirrigationorprecipitation)towatervapor(evapotranspiration),andrecentestimationsshowthatannualglobalvaporflowsfromfuturefoodproductionarelikelytodoublewithinthenext25–50yr(3,4).Itiswellknownthatirrigationis,byfar,thelargestwateruserintermsofliquidwaterwithdrawalfromriversandaquifers(5,6)andthathumanmodificationofthehydrologicalcyclehasprofoundlyaffectedtheflowofliquidwateracrosstheEarth’slandsurface(7–10).Alterationofwatervaporflowsthroughland-useandland-coverchangeshasreceivedlessattention,comparedtoliquidflows,althoughthereiscompellingevidencethatsuchalterationscaninfluencethefunctioningoftheEarthSystem(11–15).Severalexamplesfromaroundtheworldshowthatchangesinvaporflowsduetoland-coverchangeandirrigationhaveaffectedthefunctioningoftheterrestrialbiosphereandinfluencedclimateatlocalandregionalscales.Forexample,irrigatedcroplandshaveincreasedvaporflowsfromacon-vertedsteppeinColoradoby120%(16),contributingtohigherprecipitation,lowertemperature,andanincreaseinthunder-stormactivity(17,18).Large-scaledeforestationforcrop-andgrasslandsinAustraliahascauseda10%decreaseinvaporflowsonthatcontinent,withconsequentwidespreadandirreversibledrylandsalinitythathasreducedcropproductivity
insomeregionsandmadefarmingimpossibleinothers(13).Simulationsofchangedvaporflowsduetoland-coverchangeinEastAsiahaveaffectedthebehavioroftheEastAsianMonsoon,includingaweakeningofthesummermonsoonlow-pressuresystemandanincreaseinirregularnortherlyflow(12,19).Modeledvegetationchangesforagriculturalexpan-sioninWestAfricahaveshownpotentiallydramaticimpactsonrainfallintheAfricanmonsooncirculation,especiallythroughdeforestationalongthesoutherncoast,becausethisdeforestationdecreasesthevaporflowintotheregion(20).Theseexamples,however,addressonlylocaltoregionalchanges.Nospatiallyexplicitanalysisexistsoftheextentofvapor-flowchangesataglobalscale.Here,wepresentaspatiallyexplicitglobalestimateofchangesinvaporflowsasaconse-quenceofbothirrigationanddeforestation.Weelucidatewhichregionshaveexperiencedsubstantialchangesinvaporflowsasaconsequenceofhumanactionsandthescaleanddirectionofthosechanges.WeanalyzethesechangesandaddressthechallengesfacingfuturefreshwatermanagementtoincreasevaporflowsforfoodproductionwithoutcompromisingthecapacityoftheEarthSystemtosupporthumanwelfare.