Hydrodynamics of self-propelled hard rods
EDEM理论参考指南

物理学名词
1/4波片quarter-wave plateCG矢量耦合系数Clebsch-Gordan vector coupling coefficient; 简称“CG[矢耦]系数”。
X射线摄谱仪X-ray spectrographX射线衍射X-ray diffractionX射线衍射仪X-ray diffractometer[玻耳兹曼]H定理[Boltzmann] H-theorem[玻耳兹曼]H函数[Boltzmann] H-function[彻]体力body force[冲]击波shock wave[冲]击波前shock front[狄拉克]δ函数[Dirac] δ-function[第二类]拉格朗日方程Lagrange equation[电]极化强度[electric] polarization[反射]镜mirror[光]谱线spectral line[光]谱仪spectrometer[光]照度illuminance[光学]测角计[optical] goniometer[核]同质异能素[nuclear] isomer[化学]平衡常量[chemical] equilibrium constant[基]元电荷elementary charge[激光]散斑speckle[吉布斯]相律[Gibbs] phase rule[可]变形体deformable body[克劳修斯-]克拉珀龙方程[Clausius-] Clapeyron equation[量子]态[quantum] state[麦克斯韦-]玻耳兹曼分布[Maxwell-]Boltzmann distribution[麦克斯韦-]玻耳兹曼统计法[Maxwell-]Boltzmann statistics[普适]气体常量[universal] gas constant[气]泡室bubble chamber[热]对流[heat] convection[热力学]过程[thermodynamic] process[热力学]力[thermodynamic] force[热力学]流[thermodynamic] flux[热力学]循环[thermodynamic] cycle[事件]间隔interval of events[微观粒子]全同性原理identity principle [of microparticles][物]态参量state parameter, state property[相]互作用interaction[相]互作用绘景interaction picture[相]互作用能interaction energy[旋光]糖量计saccharimeter[指]北极north pole, N pole[指]南极south pole, S pole[主]光轴[principal] optical axis[转动]瞬心instantaneous centre [of rotation][转动]瞬轴instantaneous axis [of rotation]t 分布student's t distributiont 检验student's t testK俘获K-captureS矩阵S-matrixWKB近似WKB approximationX射线X-rayΓ空间Γ-spaceα粒子α-particleα射线α-rayα衰变α-decayβ射线β-rayβ衰变β-decayγ矩阵γ-matrixγ射线γ-rayγ衰变γ-decayλ相变λ-transitionμ空间μ-spaceχ 分布chi square distributionχ 检验chi square test阿贝不变量Abbe invariant阿贝成象原理Abbe principle of image formation阿贝折射计Abbe refractometer阿贝正弦条件Abbe sine condition阿伏伽德罗常量Avogadro constant阿伏伽德罗定律Avogadro law阿基米德原理Archimedes principle阿特伍德机Atwood machine艾里斑Airy disk爱因斯坦-斯莫卢霍夫斯基理论Einstein-Smoluchowski theory 爱因斯坦场方程Einstein field equation爱因斯坦等效原理Einstein equivalence principle爱因斯坦关系Einstein relation爱因斯坦求和约定Einstein summation convention爱因斯坦同步Einstein synchronization爱因斯坦系数Einstein coefficient安[培]匝数ampere-turns安培[分子电流]假说Ampere hypothesis安培定律Ampere law安培环路定理Ampere circuital theorem安培计ammeter安培力Ampere force安培天平Ampere balance昂萨格倒易关系Onsager reciprocal relation凹面光栅concave grating凹面镜concave mirror凹透镜concave lens奥温电桥Owen bridge巴比涅补偿器Babinet compensator巴耳末系Balmer series白光white light摆pendulum板极plate伴线satellite line半波片halfwave plate半波损失half-wave loss半波天线half-wave antenna半导体semiconductor半导体激光器semiconductor laser半衰期half life period半透[明]膜semi-transparent film半影penumbra半周期带half-period zone傍轴近似paraxial approximation傍轴区paraxial region傍轴条件paraxial condition薄膜干涉film interference薄膜光学film optics薄透镜thin lens保守力conservative force保守系conservative system饱和saturation饱和磁化强度saturation magnetization本底background本体瞬心迹polhode本影umbra本征函数eigenfunction本征频率eigenfrequency本征矢[量] eigenvector本征振荡eigen oscillation本征振动eigenvibration本征值eigenvalue本征值方程eigenvalue equation比长仪comparator比荷specific charge; 又称“荷质比(charge-mass ratio)”。
聚合物流变学导论2006秋-04-特殊流变行为c
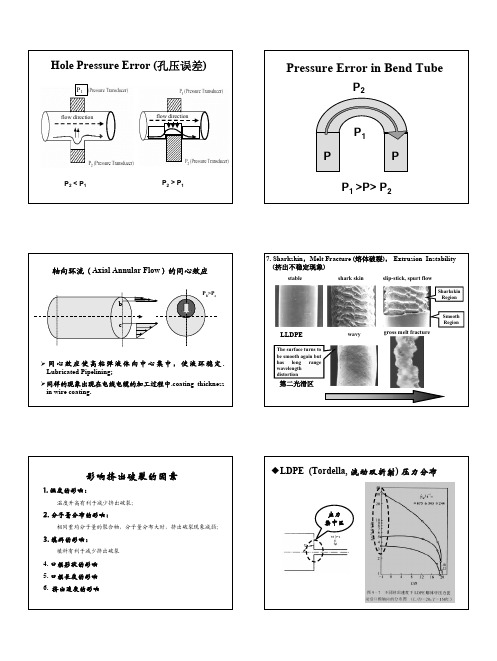
Addition of small amount of fluoropolymer prevents the occurrence of extrusion instability.
HDPE的粘-滑转变
LDPE, PS的粘-滑转变
LDPE
PS
为什么LDPE和PS在粘-滑转变现象不明显?
LDPE和PS都是支链型高分子,分子链的缠结不如 HDPE等线性高分子明显,其粘滑现象转变不显著。
L/D = 4
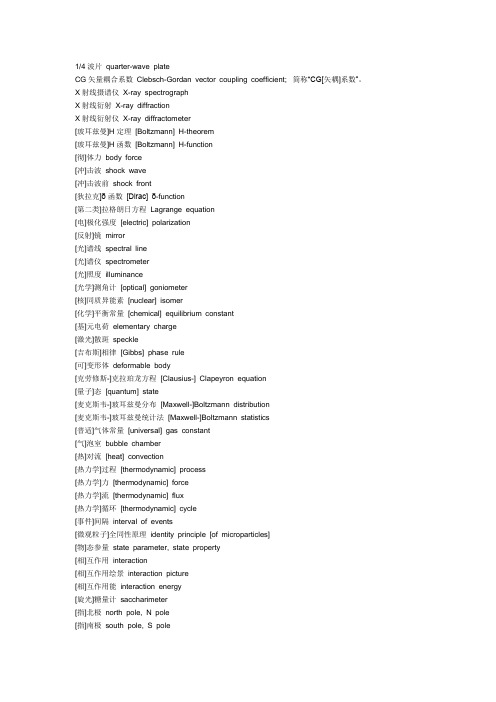
左图为剪切速率相同时, 不同长径比的毛细管内的 压力分布
L/D=20
但是, 对减少HDPE挤出 破裂不利,因为,HDPE挤 出破裂的主要原因的由于口 模内部的摩擦。
LDPE
HDPE
加 长 口 模 对 减 少 HDPE 挤 出 破 裂 不 利 , 因 为 , HDPE挤出破裂的主要原因的由于口模内部的摩擦。
1. Bulk Mold Composite (BMC) 2. Sheet Mold Composite (SMC)
Thixotropy of Paint
好的涂料: 受剪切时粘度小 剪切停止时,粘度迅速回复;
Poor leveling(流平性):
剪切力随时间的变化
Sagging(流淌)on a vertical wall or thickness of wet layer:
为什么LDPE和PS在高剪切应力下不发生滑动?
LDPE
HDPE
Shapes of experimental flow curves with no (a), one (b) and two (c) oscillation regimes, and with an oscillation regime with no left branch (d). The latter shape is observed with certain viscoplastic materials, such as food products.
分子配分函数

0 ∞
= ∫ e −Θ r y / T dy
0
∞
T −Θ r y / T ∞ T T |0 = − =− ⋅e ⋅ (0 − 1) = Θr Θr Θr
T 8π 2 IkT ∴qr = = 2 Θr h
用欧拉-麦克劳林公式对 进行变换, 用欧拉 麦克劳林公式对qr进行变换 可以得到配分函数更精确 麦克劳林公式对 的表达式. 的表达式
∴ qt=(2πmkT/h2)3/2·a·b·c π
=(2πmkT/h2)3/2 ·V abc=V π
(7)
1.0
y=f(nx)
0
N
平动对热力学函数的贡献: 平动对热力学函数的贡献:
1. U: : U=NkT2 [∂lnq/∂T]N,V =NkT2{∂/∂Tln[(2πmk/h2)3/2 ·V·(T)3/2]}N,V π = NkT2 · 3/2·1/T = 3/2nRT Um= 3/2RT (8) 2. CV,m: CV,m=(∂U/∂T)V=3/2R (9) 单原子分子只有平动, 单原子分子只有平动 CVm= 3/2R. 与统计力学推出的结果完全一致. 与统计力学推出的结果完全一致 3. F: F= -NkT·ln(eq/ N) (10) = -nRT·ln[(e/N)( 2πmkT /h2 )3/2·V] π
q = qn.qe.qt.qr.qv
形式对热力学函数贡献值的加和: 加和:
(1)
因为热力学函数与q的对数相关 因为热力学函数与 的对数相关, 故热力学函数值是各分运动 的对数相关 F=-NkT㏑q=-NkT㏑qn-NkT㏑qe-NkT㏑qt-NkT㏑qr-NkT㏑qv ㏑ ㏑ ㏑ ㏑ ㏑ ㏑
Mach_数和壁面温度对HyTRV_边界层转捩的影响
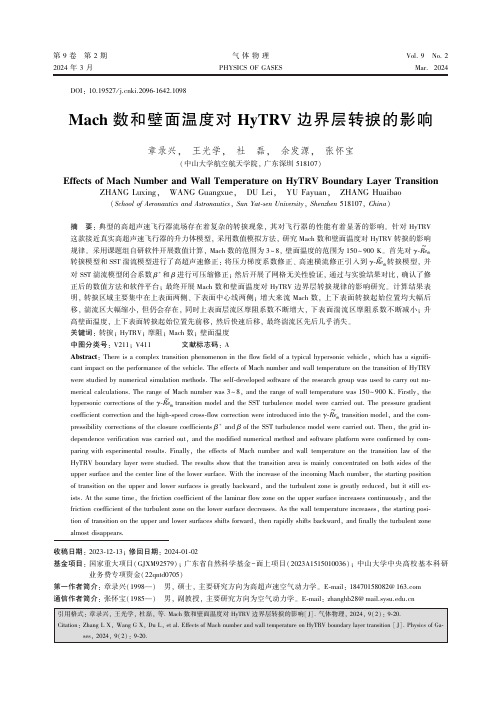
第9卷㊀第2期2024年3月气体物理PHYSICSOFGASESVol.9㊀No.2Mar.2024㊀㊀DOI:10.19527/j.cnki.2096 ̄1642.1098Mach数和壁面温度对HyTRV边界层转捩的影响章录兴ꎬ㊀王光学ꎬ㊀杜㊀磊ꎬ㊀余发源ꎬ㊀张怀宝(中山大学航空航天学院ꎬ广东深圳518107)EffectsofMachNumberandWallTemperatureonHyTRVBoundaryLayerTransitionZHANGLuxingꎬ㊀WANGGuangxueꎬ㊀DULeiꎬ㊀YUFayuanꎬ㊀ZHANGHuaibao(SchoolofAeronauticsandAstronauticsꎬSunYat ̄senUniversityꎬShenzhen518107ꎬChina)摘㊀要:典型的高超声速飞行器流场存在着复杂的转捩现象ꎬ其对飞行器的性能有着显著的影响ꎮ针对HyTRV这款接近真实高超声速飞行器的升力体模型ꎬ采用数值模拟方法ꎬ研究Mach数和壁面温度对HyTRV转捩的影响规律ꎮ采用课题组自研软件开展数值计算ꎬMach数的范围为3~8ꎬ壁面温度的范围为150~900Kꎮ首先对γ ̄Re~θt转捩模型和SST湍流模型进行了高超声速修正:将压力梯度系数修正㊁高速横流修正引入到γ ̄Re~θt转捩模型ꎬ并对SST湍流模型闭合系数β∗和β进行可压缩修正ꎻ然后开展了网格无关性验证ꎬ通过与实验结果对比ꎬ确认了修正后的数值方法和软件平台ꎻ最终开展Mach数和壁面温度对HyTRV边界层转捩规律的影响研究ꎮ计算结果表明ꎬ转捩区域主要集中在上表面两侧㊁下表面中心线两侧ꎻ增大来流Mach数ꎬ上下表面转捩起始位置均大幅后移ꎬ湍流区大幅缩小ꎬ但仍会存在ꎬ同时上表面层流区摩阻系数不断增大ꎬ下表面湍流区摩阻系数不断减小ꎻ升高壁面温度ꎬ上下表面转捩起始位置先前移ꎬ然后快速后移ꎬ最终湍流区先后几乎消失ꎮ关键词:转捩ꎻHyTRVꎻ摩阻ꎻMach数ꎻ壁面温度㊀㊀㊀收稿日期:2023 ̄12 ̄13ꎻ修回日期:2024 ̄01 ̄02基金项目:国家重大项目(GJXM92579)ꎻ广东省自然科学基金-面上项目(2023A1515010036)ꎻ中山大学中央高校基本科研业务费专项资金(22qntd0705)第一作者简介:章录兴(1998 )㊀男ꎬ硕士ꎬ主要研究方向为高超声速空气动力学ꎮE ̄mail:184****8082@163.com通信作者简介:张怀宝(1985 )㊀男ꎬ副教授ꎬ主要研究方向为空气动力学ꎮE ̄mail:zhanghb28@mail.sysu.edu.cn中图分类号:V211ꎻV411㊀㊀文献标志码:AAbstract:Thereisacomplextransitionphenomenonintheflowfieldofatypicalhypersonicvehicleꎬwhichhasasignifi ̄cantimpactontheperformanceofthevehicle.TheeffectsofMachnumberandwalltemperatureonthetransitionofHyTRVwerestudiedbynumericalsimulationmethods.Theself ̄developedsoftwareoftheresearchgroupwasusedtocarryoutnu ̄mericalcalculations.TherangeofMachnumberwas3~8ꎬandtherangeofwalltemperaturewas150~900K.Firstlyꎬthehypersoniccorrectionsoftheγ ̄Re~θttransitionmodelandtheSSTturbulencemodelwerecarriedout.Thepressuregradientcoefficientcorrectionandthehigh ̄speedcross ̄flowcorrectionwereintroducedintotheγ ̄Re~θttransitionmodelꎬandthecom ̄pressibilitycorrectionsoftheclosurecoefficientsβ∗andβoftheSSTturbulencemodelwerecarriedout.Thenꎬthegridin ̄dependenceverificationwascarriedoutꎬandthemodifiednumericalmethodandsoftwareplatformwereconfirmedbycom ̄paringwithexperimentalresults.FinallyꎬtheeffectsofMachnumberandwalltemperatureonthetransitionlawoftheHyTRVboundarylayerwerestudied.Theresultsshowthatthetransitionareaismainlyconcentratedonbothsidesoftheuppersurfaceandthecenterlineofthelowersurface.WiththeincreaseoftheincomingMachnumberꎬthestartingpositionoftransitionontheupperandlowersurfacesisgreatlybackwardꎬandtheturbulentzoneisgreatlyreducedꎬbutitstillex ̄ists.Atthesametimeꎬthefrictioncoefficientofthelaminarflowzoneontheuppersurfaceincreasescontinuouslyꎬandthefrictioncoefficientoftheturbulentzoneonthelowersurfacedecreases.Asthewalltemperatureincreasesꎬthestartingposi ̄tionoftransitionontheupperandlowersurfacesshiftsforwardꎬthenrapidlyshiftsbackwardꎬandfinallytheturbulentzonealmostdisappears.气体物理2024年㊀第9卷Keywords:transitionꎻHyTRVꎻfrictionꎻMachnumberꎻwalltemperature引㊀言高超声速飞行器具有突防能力强㊁打击范围广㊁响应迅速等显著优势ꎬ正逐渐成为各国空天竞争的热点[1]ꎮ高超声速飞行器边界层转捩是该类飞行器气动设计中的重要问题[2]ꎮ在边界层转捩过程中ꎬ流态由层流转变为湍流ꎬ飞行器的表面摩阻急剧增大到层流时的3~5倍ꎬ严重影响飞行器的气动性能与热防护系统ꎬ转捩还会导致飞行器壁面烧蚀㊁颤振加剧㊁飞行姿态控制难度大等一系列问题ꎬ对飞行器的飞行安全构成严重的威胁[3 ̄5]ꎬ开展高超声速飞行器边界层转捩研究具有十分重要的意义ꎮ影响边界层转捩的因素很多ꎬ例如ꎬMach数㊁Reynolds数㊁湍流强度㊁表面传导热等ꎮ在高超声速流动条件下ꎬ强激波㊁强逆压梯度㊁熵层等高超声速现象及其相互作用ꎬ会使得转捩流动的预测和研究难度进一步增大[6]ꎮ目前高超声速飞行器转捩数值模拟方法主要有直接数值模拟(DNS)㊁大涡模拟(LES)和基于Reynolds平均Navier ̄Stokes(RANS)的转捩模型方法ꎬ由于前两种计算量巨大ꎬ难以推广到工程应用ꎬ基于Reynolds平均Navier ̄Stokes的转捩模型在工程实践中应用最为广泛ꎬ其中γ ̄Re~θt转捩模型基于局部变量ꎬ与现代CFD方法良好兼容ꎬ目前已经有多项研究尝试从一般性的流动问题拓展到高超声速流动转捩模拟[6 ̄9]ꎮ目前高超声速流动转捩的研究对象主要是结构相对简单的构型ꎮMcDaniel等[10]研究了扩口直锥在高超声速流动条件下的转捩现象ꎮPapp等[11]研究了圆锥在高超声速流动条件下的转捩特性ꎮ美国和澳大利亚组织联合实施的HIFiRE计划[12]ꎬ研究了圆锥形状的HIFiRE1和椭圆锥形的HIFiRE5的转捩问题ꎮ杨云军等[13]采用数值模拟方法ꎬ分析了椭圆锥的转捩影响机制ꎬ并研究了Reynolds数对转捩特性的影响规律ꎮ另外ꎬ袁先旭等[14]于2015年成功实施了圆锥体MF ̄1航天模型飞行试验ꎮ以上对高超声速流动的转捩研究ꎬ都取得了比较理想的结果ꎬ然而所采用的模型都是圆锥㊁椭圆锥等简单几何外形ꎬ这与真实高超声速飞行器有较大差异ꎬ较难反映真实的转捩特性ꎮ为了有效促进对真实高超声速飞行器的转捩问题研究ꎬ中国空气动力研究与发展中心提出并设计了一款接近真实飞行器的升力体模型ꎬ即高超声速转捩研究飞行器(hypersonictransitionresearchvehicleꎬHyTRV)[15]ꎬ模型详细的参数见参考文献[16]ꎮHyTRV外形如图1所示ꎬ其整体外形较为复杂ꎬ不同区域发生转捩的情况也不尽相同ꎮ对HyTRV的转捩问题研究能够显著提高对真实高超声速飞行器转捩特性的认识水平ꎮLiu等[17]采用理论分析㊁数值模拟和风洞实验3种方法对HyTRV的转捩特性进行了研究ꎻ陈坚强等[15]分析了HyTRV的边界层失稳特征ꎻChen等[18]对HyTRV进行了多维线性稳定性分析ꎻQi等[19]在来流Mach数6㊁攻角0ʎ的条件下对HyTRV进行了直接数值模拟ꎻ万兵兵等[20]结合风洞实验与飞行试验ꎬ利用eN方法预测了HyTRV升力体横流区的转捩阵面形状ꎮ目前ꎬ相关研究主要集中在HyTRV的稳定性特征及转捩预测两个方面ꎬ而对若干关键参数ꎬ特别是Mach数和壁面温度对转捩的影响研究还比较少ꎮ(a)Frontview(b)Sideview㊀㊀㊀图1㊀HyTRV外形Fig.1㊀ShapeofHyTRV基于此ꎬ本文采用数值模拟方法ꎬ应用课题组自研软件开展Mach数和壁面温度对HyTRV转捩流动的影响规律研究ꎮ1㊀数值方法1.1㊀控制方程和数值方法控制方程为三维可压缩RANS方程ꎬ采用结构网格技术和有限体积方法ꎬ变量插值方法采用2阶MUSCL格式ꎬ通量计算采用低耗散的通量向量差分Roe格式ꎬ黏性项离散采用中心格式ꎬ时间推进方法采用LU ̄SGS格式ꎮ壁面采用等温㊁无滑移壁面条件ꎬ入口采用Riemann远场边界条件ꎬ出口采用零梯度外推边界条件ꎮ1.2㊀γ ̄Re~θt转捩模型γ ̄Re~θt转捩模型是Menter等[21ꎬ22]于2004年提01第2期章录兴ꎬ等:Mach数和壁面温度对HyTRV边界层转捩的影响出的一种基于拟合公式的间歇因子转捩模型ꎬ在2009年公布了完整的拟合公式及相关参数[23]ꎮ许多学者也开发了相应的程序ꎬ并进行了大量的算例验证[24 ̄28]ꎬ证明了该模型具有较好的转捩预测能力ꎬ预测精度较高ꎻ通过合适的标定ꎬγ ̄Re~θt转捩模型可以适用于多种情况下的转捩模拟ꎮ该模型构建了关于间歇因子γ的输运方程和关于转捩动量厚度Reynolds数Re~θt的输运方程ꎮ具体来说ꎬγ表示该位置是湍流流动的概率ꎬ取值范围为0<γ<1ꎮ关于γ的控制方程为Ə(ργ)Ət+Ə(ρujγ)Əxj=Pγ-Eγ+ƏƏxjμ+μtσfæèçöø÷ƏγƏxjéëêêùûúú其中ꎬPγ为生成项ꎬEγ为破坏项ꎮ关于Re~θt的输运方程为Ə(ρRe~θt)Ət+Ə(ρujRe~θt)Əxj=Pθt+ƏƏxjσθt(μ+μt)ƏRe~θtƏxjéëêêùûúú其中ꎬPθt为源项ꎬ其作用是使边界层外部的Re~θt等于Reθtꎬ定义式为Pθt=cθtρt(Reθt-Re~θt)(1.0-Fθt)Reθt采用以下经验公式Reθt=1173.51-589 428Tu+0.2196Tu2æèçöø÷F(λθ)ꎬTuɤ0.3Reθt=331.50(Tu-0.5658)-0.671F(λθ)ꎬTu>0.3ìîíïïïïF(λθ)=1+(12.986λθ+123.66λ2θ+405.689λ3θ)e-(Tu1.5)1.5ꎬ㊀λθɤ0F(λθ)=1+0.275(1-e-35.0λθ)e-(Tu0.5)ꎬλθ>0ìîíïïïï在实际计算中ꎬ通过γ ̄Re~θt转捩模型获得间歇因子ꎬ再通过间歇因子来控制SSTk ̄ω湍流模型中湍动能的生成ꎮγ ̄Re~θt转捩模型与SSTk ̄ω湍流模型耦合为Ə(ρk)Ət+Ə(ρujk)Əxj=γeffτijƏuiƏxj-min(max(γeffꎬ0.1)ꎬ1.0)ρβ∗kω+ƏƏxjμ+μtσkæèçöø÷ƏkƏxjéëêêùûúúƏ(ρω)Ət+Ə(ρujω)Əxj=γvtτijƏuiƏxj-βρω2+ƏƏxj(μ+σωμt)ƏωƏxjéëêêùûúú+2ρ(1-F1)σω21ωƏkƏxjƏωƏxj模型中具体参数定义见文献[23]ꎮ1.3㊀高超声速修正原始SST湍流模型及γ ̄Re~θt转捩模型都是基于不可压缩流动发展的ꎬ为了更好地预测高超声速流动转捩ꎬ本节引入了3种重要的高超声速修正方法ꎮ1.3.1㊀压力梯度修正压力梯度对边界层转捩的影响较大ꎬ在高Mach数情况下ꎬ边界层厚度较大ꎬ进而影响压力梯度的大小ꎬ因此在模拟高超声速流动时应该考虑Mach数对压力梯度的影响ꎮ本文采用张毅峰等[29]提出的压力梯度修正方法ꎬ具体修正形式如下λᶄθ=λθ1+γᶄ-12Maeæèçöø÷其中ꎬMae为边界层外缘Mach数ꎬγᶄ为比热比ꎮ1.3.2㊀高速横流修正在原始γ ̄Re~θt转捩模型中ꎬ没有考虑横流不稳定性对转捩的影响ꎬ对于横流模态主导的转捩ꎬ原始转捩模型计算的结果并不理想ꎮLangtry等[30]在2015年对γ ̄Re~θt转捩模型进行了低速横流修正ꎬ向星皓等[9]在Langtry低速横流修正的基础上ꎬ对高超声速椭圆锥转捩DNS数据进行了拓展ꎬ提出了高速横流转捩判据ꎬ本文直接采用向星皓提出的高速横流转捩方法ꎮLangtry将横流强度引入转捩发生动量厚度Reynolds数输运方程中Ə(ρRe~θt)Ət+Ə(ρujRe~θt)Əxj=Pθt+DSCF+ƏƏxjσθt(μ+μt)ƏRe~θtƏxjéëêêùûúú式中ꎬDSCF为横流源项ꎬLangtry低速横流修正为DSCF=cθtρtccrossflowmin(ReSCF-Re~θtꎬ0.0)Fθt2其中ꎬReSCF为低速横流判据ReSCF=θtρUlocal0.82æèçöø÷μ=-35.088lnhθtæèçöø÷+319.51+f(+ΔHcrossflow)-f(-ΔHcrossflow)其中ꎬh为壁面粗糙度高度ꎬθt为动量厚度ꎬ11气体物理2024年㊀第9卷ΔHcrossflow是横流强度抬升项ꎮ向星皓提出的高速横流转捩判据ꎬ其中高速横流源项DSCF ̄H为DSCF ̄H=cCFρmin(ReSCF ̄H-Re~θtꎬ0)FθtReSCF ̄H=CCF ̄1lnhlμ+CCF ̄2+(Hcrossflow)其中ꎬCCF ̄1=-9.618ꎬCCF ̄2=128.33ꎻlμ为粗糙度参考高度ꎬlμ=1μmꎻf(Hcrossflow)为抬升函数f(Hcrossflow)=60000.1066-ΔHcrossflow+50000(0.1066-ΔHcrossflow)2其中ꎬΔHcrossflow与Langtry低速横流修正中保持一致ꎮ1.3.3㊀SST可压缩修正高超声速流动具有强可压缩性ꎬ所以在进行高超声速计算时ꎬ应该对湍流模型进行可压缩修正ꎮSarkar[31]提出了膨胀耗散修正ꎬ对SST湍流模型中的闭合系数β∗ꎬβ进行了可压缩修正ꎬWilcox[32]在Sarkar修正的基础上考虑了可压缩生成项产生时的延迟效应ꎬ使得可压缩修正在湍流Mach数较小的近壁面关闭ꎬ在湍流Mach数较大的自由剪切层打开ꎬ本文采用Wilcox提出的可压缩性修正β∗=β∗0[1+ξ∗F(Mat)]β=β0-β∗0ξ∗F(Mat)其中ꎬβ0ꎬβ∗均为原始模型中的系数ꎬξ∗=1.5ꎮF(Mat)=[Mat-Mat0]H(Mat-Mat0)Mat0=1/4ꎬH(x)=0ꎬxɤ01ꎬx>0{其中ꎬMat=2k/a为湍流Mach数ꎬa为当地声速ꎮ2㊀网格无关性验证及数值方法确认2.1㊀网格无关性验证计算采用3套网格ꎬ考虑到HyTRV的几何对称性ꎬ生成3套半模网格ꎬ第1层网格高度为1ˑ10-6mꎬ确保y+<1ꎬ流向ˑ法向ˑ周向的网格数分别为:网格1是301ˑ201ˑ201ꎬ网格2是301ˑ301ˑ201ꎬ网格3是401ˑ381ˑ281ꎮ全模下表面如图2所示ꎬ选取y/L=0中心线和x/L=0.5处ꎬ对比3套网格的表面摩阻系数ꎬ计算结果如图3所示ꎮ采用网格1时ꎬ表面摩阻系数分布与另外两个结果存在明显差异ꎻ而采用网格2和网格3时ꎬ表面摩阻系数曲线基本重合ꎬ表明在流向㊁法向和周向均满足网格无关性ꎬ后续数值计算采用网格2ꎮ图2㊀截取位置示意图Fig.2㊀Schematicdiagramoftheinterceptionlocation(a)Surfacefrictionaty/L=0(b)Surfacefrictionatx/L=0.5图3㊀采用3套网格计算得到的摩阻对比Fig.3㊀Comparisonofthefrictiondragcalculatedusingthreesetsofgrids2.2㊀数值方法和自研软件的确认采用修正后的转捩模型对HyTRV开展计算ꎬ计算工况为Ma=6ꎬ来流温度Tɕ=97Kꎬ单位21第2期章录兴ꎬ等:Mach数和壁面温度对HyTRV边界层转捩的影响Reynolds数为Re=1.1ˑ107/mꎬ攻角α=0ʎꎬ来流湍流度FSTI=0.8%ꎬ壁面温度T=300Kꎮ为方便对比分析ꎬ计算结果与参考结果均采用上下对称形式布置ꎬ例如ꎬ图4是模型下表面计算结果与实验结果对比:对于下表面两侧转捩的起始位置ꎬ高超声速修正前的转捩位置在x=0.68m附近ꎬ高超声速修正后的计算结果与实验结果吻合良好ꎬ均在x=0.60m附近ꎬ并且湍流边界层区域形状基本一致ꎬ说明修正后的转捩模型能够较好地预测HyTRV转捩的位置ꎮ(a)Calculationofthefrictiondistribution(beforehypersoniccorrection)(b)Calculationofthefrictiondistribution(afterhypersoniccorrection)(c)Experimentalresultsoftheheatfluxdistribution[17]图4㊀下表面计算结果和实验结果对比Fig.4㊀Comparisonofthecalculatedandexperimentalresultsonthelowersurface3㊀HyTRV转捩的基本流动特性计算工况采用Ma=6ꎬ攻角α=0ʎꎬ来流湍流度FSTI=0.6%ꎬ分析HyTRV转捩的基本流动特性ꎮ从图5可以看出ꎬ模型两侧和顶端均出现高压区ꎬ高压区之间为低压区ꎬ横截面上存在周向压力梯度ꎬ流动从高压区向低压区汇集ꎬ从而在下表面中心线附近和上表面两侧腰部区域均形成流向涡结构(见图6)ꎬ沿流动方向ꎬ高压区域逐渐扩大ꎬ流向涡结构的影响范围也越大ꎮ在流向涡结构的边缘位置ꎬ壁面附近的低速流体被抬升到外壁面区域ꎬ外壁面区域的高速流体又被带入到近壁面区域ꎬ进而导致流向涡结构边缘处壁面的摩阻显著增加ꎬ最终诱发转捩ꎬ这些流动特征与文献[15]的结果一致ꎮ图7显示了上下表面摩阻的分布情况ꎬ其中上表面两侧区域在x/L=0.80附近ꎬ摩阻显著增加ꎬ出现明显的转捩现象ꎬ转捩区域分布在两侧边缘位置ꎻ而下表面两侧区域在x/L=0.75附近ꎬ也出现明显的转捩ꎬ转捩区域相对集中在中心线两侧ꎮ图5㊀不同截面位置处的压力云图Fig.5㊀Pressurecontoursatdifferentcross ̄sectionlocations图6㊀不同截面位置处的流向速度云图Fig.6㊀Streamwisevelocitycontoursatdifferentcross ̄sectionlocations31气体物理2024年㊀第9卷(a)Uppersurface㊀㊀㊀㊀㊀(b)Lowersurface图7㊀上下表面摩阻分布云图Fig.7㊀Frictioncoefficientcontoursontheupperandlowersurfaces4㊀不同Mach数对HyTRV转捩的影响保持来流湍流度FSTI=0.6%不变ꎬMach数变化范围为3~8ꎮ图8是不同Mach数条件下HyTRV上下表面的摩阻分布云图ꎬ从图中可知ꎬ随着Mach数的增加ꎬ上下表面的湍流区域均逐渐减少ꎬ其中上表面两侧转捩起始位置由x/L=0.56附近后移至x/L=0.92附近ꎬ下表面两侧转捩起始位置由x/L=0.48附近后移至x/L=0.99附近ꎬ上下表面两侧转捩起始位置均大幅后移ꎬ说明Mach数对HyTRV转捩的影响很大ꎮuppersurface㊀㊀㊀㊀㊀㊀㊀㊀㊀㊀㊀㊀㊀㊀㊀㊀lowersurface(a)Ma=3uppersurface㊀㊀㊀㊀㊀㊀㊀㊀㊀㊀㊀㊀㊀㊀㊀㊀lowersurface(b)Ma=4uppersurface㊀㊀㊀㊀㊀㊀㊀㊀㊀㊀㊀㊀㊀㊀㊀㊀lowersurface(c)Ma=541第2期章录兴ꎬ等:Mach数和壁面温度对HyTRV边界层转捩的影响uppersurface㊀㊀㊀㊀㊀㊀㊀㊀㊀㊀㊀㊀㊀㊀㊀㊀lowersurface(d)Ma=6uppersurface㊀㊀㊀㊀㊀㊀㊀㊀㊀㊀㊀㊀㊀㊀㊀㊀lowersurface(e)Ma=7uppersurface㊀㊀㊀㊀㊀㊀㊀㊀㊀㊀㊀㊀㊀㊀㊀㊀lowersurface(f)Ma=8图8㊀不同Mach数条件下摩阻系数分布云图Fig.8㊀FrictioncoefficientcontoursatdifferentMachnumbers上表面选取图7中z/L=0.12的位置ꎬ下表面选取z/L=0.10的位置进行分析ꎮ从图9中可以分析出ꎬ随着Mach数的增加ꎬ上表面转捩起始位置不断后移ꎬ当Mach数增加到7时ꎬ由于湍流区的缩小ꎬ此处位置不再发生转捩ꎬ此外ꎬMach数越高层流区摩阻系数越大ꎻ下表面转捩起始位置也不断后移ꎬ当Mach数增加到8时ꎬ此处位置不再发生转捩ꎬ此外ꎬMach数越高ꎬ湍流区的摩阻系数越小ꎬ这些结论与关于来流Mach数对转捩位置影响的普遍研究结论一致ꎮ(a)Uppersurface㊀㊀㊀㊀㊀(b)Lowersurface图9㊀不同位置摩阻系数随Mach数的变化Fig.9㊀VariationoffrictioncoefficientwithMachnumberatdifferentlocations51气体物理2024年㊀第9卷5㊀不同壁面温度对HyTRV转捩的影响保持来流湍流度FSTI=0.6%及Ma=6不变ꎬ壁面温度的变化范围为150~900Kꎮ图10是不同壁面温度条件下HyTRV上下表面的摩阻分布云图ꎬ可以看出随着壁面温度的增加ꎬ上表面两侧湍流区域先是缓慢扩大ꎬ在壁面温度为500K时湍流区域快速缩小ꎬ增加到900K时ꎬ已无明显湍流区域ꎻ下表面两侧湍流区域先是无明显变化ꎬ同样当壁面温度升高到500K时ꎬ湍流区域快速缩小ꎬ当壁面温度升高到700K时ꎬ两侧已经无明显的湍流区域ꎬ相比上表面两侧湍流区域ꎬ下表面湍流区域消失得更早ꎮ由此可以得出壁面温度对转捩的产生有较大的影响ꎬ壁面温度增加到一定程度将导致HyTRV没有明显的转捩现象ꎮuppersurface㊀㊀㊀㊀㊀㊀㊀㊀㊀㊀㊀㊀㊀㊀㊀㊀lowersurface(a)T=150Kuppersurface㊀㊀㊀㊀㊀㊀㊀㊀㊀㊀㊀㊀㊀㊀㊀㊀lowersurface(b)T=200Kuppersurface㊀㊀㊀㊀㊀㊀㊀㊀㊀㊀㊀㊀㊀㊀㊀㊀lowersurface(c)T=300Kuppersurface㊀㊀㊀㊀㊀㊀㊀㊀㊀㊀㊀㊀㊀㊀㊀㊀lowersurface(d)T=500K61第2期章录兴ꎬ等:Mach数和壁面温度对HyTRV边界层转捩的影响uppersurface㊀㊀㊀㊀㊀㊀㊀㊀㊀㊀㊀㊀㊀㊀㊀㊀lowersurface(e)T=700Kuppersurface㊀㊀㊀㊀㊀㊀㊀㊀㊀㊀㊀㊀㊀㊀㊀㊀lowersurface(f)T=900K图10㊀不同壁面温度条件下摩阻系数分布云图Fig.10㊀Frictioncoefficientcontoursatdifferentwalltemperatureconditions上表面选取z/L=0.125的位置ꎬ下表面选取z/L=0.100的位置进行分析ꎮ从图11中可以分析出ꎬ随着壁面温度的增加ꎬ上表面转捩起始位置先前移ꎬ当壁面温度增加到500K时ꎬ转捩起始位置后移ꎬ转捩区长度逐渐增加ꎬ层流区域的摩阻系数逐渐增加ꎬ当壁面温度增加到700K时ꎬ该位置已不再出现转捩ꎻ下表面转捩起始位置先小幅后移ꎬ当壁面温度增加到300K时ꎬ转捩起始位置开始后移ꎬ当壁面温度增加到700K时ꎬ由于湍流区域的减小ꎬ该位置不再发生转捩ꎮ(a)Uppersurface㊀㊀㊀㊀㊀(b)Lowersurface图11㊀不同位置摩阻系数随壁面温度的变化Fig.11㊀Variationoffrictioncoefficientwithwalltemperatureatdifferentlocations为进一步分析壁面温度的影响ꎬ本文分别在上下表面湍流区选取一点(0.9ꎬ0.029ꎬ0.14)ꎬ(0.97ꎬ-0.34ꎬ0.12)ꎬ分析边界层湍动能剖面ꎬ结果如图12所示ꎮ从图中可以看到ꎬ随着壁面温度升高ꎬ边界层厚度先略微变厚ꎬ再变薄ꎬ当壁面温度升高到700K时ꎬ边界层厚度迅速降低ꎮ这些结果与转捩位置先前移再后移的结论相符合ꎬ因为边界层厚度会影响不稳定波的时间和空间尺度ꎬ边界层厚度低时ꎬ不稳定波增长速度变慢ꎬ延迟转捩发生ꎮ需要指出的是ꎬ仅采用当前使用的方法ꎬ无法从更深层71气体物理2024年㊀第9卷次揭示转捩反转的流动机理ꎬ而须另外借助稳定性分析方法ꎬ例如ꎬ使用eN方法开展基于模态的稳定性研究ꎮ文献[33]采用该手段研究了大掠角平板钝三角翼随壁温比变化出现转捩反转的内在机理:壁温比升高促进横流模态和第1模态扰动增长ꎬ抑制第2模态发展ꎬ在第1㊁2模态联合作用影响下ꎬ出现转捩反转现象ꎮ我们将在后续开展进一步研究ꎮ(a)Uppersurface(b)Lowersurface图12㊀不同位置湍动能剖面随壁面温度的变化Fig.12㊀Variationofturbulentkineticenergywithwalltemperatureatdifferentlocations6㊀结论针对HyTRV转捩问题ꎬ在Mach数Ma=3~8ꎬ壁面温度T=150~900K的条件下ꎬ基于课题组自研软件ꎬ对γ ̄Re~θt转捩模型和SST湍流模型进行了高超声速修正ꎬ研究了Mach数和壁面温度对HyTRV转捩的影响ꎬ得出以下结论:1)经过高超声速修正后的γ ̄Re~θt转捩模型和SST湍流模型能够较为准确地预测HyTRV转捩位置ꎬ并且湍流边界层区域形状与实验结果基本一致ꎻHyTRV存在多个不同的转捩区域ꎬ上表面两侧转捩区域分布在两侧边缘位置ꎬ下表面两侧转捩区域分布在中心线两侧ꎮ2)Mach数的增加会导致上下表面转捩起始位置均大幅后移ꎬ湍流区大幅缩小ꎬ但当Mach数增加到8时ꎬ湍流区仍然存在ꎬ并没有消失ꎻ上表面层流区摩阻不断增加ꎬ下表面湍流区摩阻不断减小ꎮ3)壁面温度的增加会导致上下表面转捩起始位置先前移ꎬ再后移ꎬ这与边界层厚度变化规律一致ꎬ当壁面温度增加到700K时ꎬ下表面湍流区已经基本消失ꎬ当壁面温度增加到900K时ꎬ上表面湍流区也基本消失ꎻ上表面在层流区域的摩阻系数逐渐增大ꎬ在湍流区的摩阻系数逐渐减小ꎮ致谢㊀感谢中国空气动力研究与发展中心和空天飞行空气动力科学与技术全国重点实验室提供的HyTRV模型数据和实验数据ꎮ参考文献(References)[1]㊀OberingIIIHꎬHeinrichsRL.Missiledefenseforgreatpowerconflict:outmaneuveringtheChinathreat[J].Stra ̄tegicStudiesQuarterlyꎬ2019ꎬ3(4):37 ̄56. [2]ChengCꎬWuJHꎬZhangYLꎬetal.Aerodynamicsanddynamicstabilityofmicro ̄air ̄vehiclewithfourflappingwingsinhoveringflight[J].AdvancesinAerodynamicsꎬ2020ꎬ2(3):5.[3]BertinJJꎬCummingsRM.Fiftyyearsofhypersonics:whereweᶄvebeenꎬwhereweᶄregoing[J].ProgressinAerospaceSciencesꎬ2003ꎬ39(6/7):511 ̄536. [4]陈坚强ꎬ涂国华ꎬ张毅锋ꎬ等.高超声速边界层转捩研究现状与发展趋势[J].空气动力学学报ꎬ2017ꎬ35(3):311 ̄337.ChenJQꎬTuGHꎬZhangYFꎬetal.Hypersnonicboundarylayertransition:whatweknowꎬwhereshallwego[J].ActaAerodynamicaSinicaꎬ2017ꎬ35(3):311 ̄337(inChinese).[5]段毅ꎬ姚世勇ꎬ李思怡ꎬ等.高超声速边界层转捩的若干问题及工程应用研究进展综述[J].空气动力学学报ꎬ2020ꎬ38(2):391 ̄403.DuanYꎬYaoSYꎬLiSYꎬetal.Reviewofprogressinsomeissuesandengineeringapplicationofhypersonicboundarylayertransition[J].ActaAerodynamicaSinicaꎬ2020ꎬ38(2):391 ̄403(inChinese).[6]ZhangYFꎬZhangYRꎬChenJQꎬetal.Numericalsi ̄81第2期章录兴ꎬ等:Mach数和壁面温度对HyTRV边界层转捩的影响mulationsofhypersonicboundarylayertransitionbasedontheflowsolverchant2.0[R].AIAA2017 ̄2409ꎬ2017. [7]KrauseMꎬBehrMꎬBallmannJ.Modelingoftransitioneffectsinhypersonicintakeflowsusingacorrelation ̄basedintermittencymodel[R].AIAA2008 ̄2598ꎬ2008. [8]YiMRꎬZhaoHYꎬLeJL.Hypersonicnaturalandforcedtransitionsimulationbycorrelation ̄basedintermit ̄tency[R].AIAA2017 ̄2337ꎬ2017.[9]向星皓ꎬ张毅锋ꎬ袁先旭ꎬ等.C ̄γ ̄Reθ高超声速三维边界层转捩预测模型[J].航空学报ꎬ2021ꎬ42(9):625711.XiangXHꎬZhangYFꎬYuanXXꎬetal.C ̄γ ̄Reθmodelforhypersonicthree ̄dimensionalboundarylayertransitionprediction[J].ActaAeronauticaetAstronauticaSinicaꎬ2021ꎬ42(9):625711(inChinese).[10]McDanielRDꎬNanceRPꎬHassanHA.Transitiononsetpredictionforhigh ̄speedflow[J].JournalofSpacecraftandRocketsꎬ2000ꎬ37(3):304 ̄309.[11]PappJLꎬDashSM.Rapidengineeringapproachtomodelinghypersoniclaminar ̄to ̄turbulenttransitionalflows[J].JournalofSpacecraftandRocketsꎬ2005ꎬ42(3):467 ̄475.[12]JulianoTJꎬSchneiderSP.InstabilityandtransitionontheHIFiRE ̄5inaMach ̄6quiettunnel[R].AIAA2010 ̄5004ꎬ2010.[13]杨云军ꎬ马汉东ꎬ周伟江.高超声速流动转捩的数值研究[J].宇航学报ꎬ2006ꎬ27(1):85 ̄88.YangYJꎬMaHDꎬZhouWJ.Numericalresearchonsupersonicflowtransition[J].JournalofAstronauticsꎬ2006ꎬ27(1):85 ̄88(inChinese).[14]袁先旭ꎬ何琨ꎬ陈坚强ꎬ等.MF ̄1模型飞行试验转捩结果初步分析[J].空气动力学学报ꎬ2018ꎬ36(2):286 ̄293.YuanXXꎬHeKꎬChenJQꎬetal.PreliminarytransitionresearchanalysisofMF ̄1[J].ActaAerodynamicaSinicaꎬ2018ꎬ36(2):286 ̄293(inChinese).[15]陈坚强ꎬ涂国华ꎬ万兵兵ꎬ等.HyTRV流场特征与边界层稳定性特征分析[J].航空学报ꎬ2021ꎬ42(6):124317.ChenJQꎬTuGHꎬWanBBꎬetal.Characteristicsofflowfieldandboundary ̄layerstabilityofHyTRV[J].ActaAeronauticaetAstronauticaSinicaꎬ2021ꎬ42(6):124317(inChinese).[16]陈坚强ꎬ刘深深ꎬ刘智勇ꎬ等.用于高超声速边界层转捩研究的标模气动布局及设计方法.中国:109969374B[P].2021 ̄05 ̄18.ChenJQꎬLiuSSꎬLiuZYꎬetal.Standardmodelaero ̄dynamiclayoutanddesignmethodforhypersonicboundarylayertransitionresearch.CNꎬ109969374B[P].2021 ̄05 ̄18(inChinese).[17]LiuSSꎬYuanXXꎬLiuZYꎬetal.Designandtransitioncharacteristicsofastandardmodelforhypersonicboundarylayertransitionresearch[J].ActaMechanicaSinicaꎬ2021ꎬ37(11):1637 ̄1647.[18]ChenXꎬDongSWꎬTuGHꎬetal.Boundarylayertran ̄sitionandlinearmodalinstabilitiesofhypersonicflowoveraliftingbody[J].JournalofFluidMechanicsꎬ2022ꎬ938(408):A8.[19]QiHꎬLiXLꎬYuCPꎬetal.Directnumericalsimulationofhypersonicboundarylayertransitionoveralifting ̄bodymodelHyTRV[J].AdvancesinAerodynamicsꎬ2021ꎬ3(1):31.[20]万兵兵ꎬ陈曦ꎬ陈坚强ꎬ等.三维边界层转捩预测HyTEN软件在高超声速典型标模中的应用[J].空天技术ꎬ2023(1):150 ̄158.WanBBꎬChenXꎬChenJQꎬetal.ApplicationsofHyTENsoftwareforpredictingthree ̄dimensionalboundary ̄layertransitionintypicalhypersonicmodels[J].AerospaceTechnologyꎬ2023(1):150 ̄158(inChinese). [21]MenterFRꎬLangtryRBꎬLikkiSRꎬetal.Acorrelation ̄basedtransitionmodelusinglocalvariables PartⅠ:modelformulation[J].JournalofTurbomachineryꎬ2006ꎬ128(3):413 ̄422.[22]LangtryRBꎬMenterFRꎬLikkiSRꎬetal.Acorrelation ̄basedtransitionmodelusinglocalvariables PartⅡ:testcasesandindustrialapplications[J].JournalofTur ̄bomachineryꎬ2006ꎬ128(3):423 ̄434.[23]LangtryRBꎬMenterFR.Correlation ̄basedtransitionmodelingforunstructuredparallelizedcomputationalfluiddynamicscodes[J].AIAAJournalꎬ2009ꎬ47(12):2894 ̄2906.[24]孟德虹ꎬ张玉伦ꎬ王光学ꎬ等.γ ̄Reθ转捩模型在二维低速问题中的应用[J].航空学报ꎬ2011ꎬ32(5):792 ̄801.MengDHꎬZhangYLꎬWangGXꎬetal.Applicationofγ ̄Reθtransitionmodeltotwo ̄dimensionallowspeedflows[J].ActaAeronauticaetAstronauticaSinicaꎬ2011ꎬ32(5):792 ̄801(inChinese).[25]牟斌ꎬ江雄ꎬ肖中云ꎬ等.γ ̄Reθ转捩模型的标定与应用[J].空气动力学学报ꎬ2013ꎬ31(1):103 ̄109.MouBꎬJiangXꎬXiaoZYꎬetal.Implementationandcaliberationofγ ̄Reθtransitionmodel[J].ActaAerody ̄namicaSinicaꎬ2013ꎬ31(1):103 ̄109(inChinese). [26]郭隽ꎬ刘丽平ꎬ徐晶磊ꎬ等.γ ̄Re~θt转捩模型在跨声速涡轮叶栅中的应用[J].推进技术ꎬ2018ꎬ39(9):1994 ̄2001.91气体物理2024年㊀第9卷GuoJꎬLiuLPꎬXuJLꎬetal.Applicationofγ ̄Re~θttran ̄sitionmodelintransonicturbinecascades[J].JournalofPropulsionTechnologyꎬ2018ꎬ39(9):1994 ̄2001(inChinese).[27]郑赟ꎬ李虹杨ꎬ刘大响.γ ̄Reθ转捩模型在高超声速下的应用及分析[J].推进技术ꎬ2014ꎬ35(3):296 ̄304.ZhengYꎬLiHYꎬLiuDX.Applicationandanalysisofγ ̄Reθtransitionmodelinhypersonicflow[J].JournalofPropulsionTechnologyꎬ2014ꎬ35(3):296 ̄304(inChi ̄nese).[28]孔维萱ꎬ阎超ꎬ赵瑞.γ ̄Reθ模式应用于高速边界层转捩的研究[J].空气动力学学报ꎬ2013ꎬ31(1):120 ̄126.KongWXꎬYanCꎬZhaoR.γ ̄Reθmodelresearchforhigh ̄speedboundarylayertransition[J].ActaAerody ̄namicaSinicaꎬ2013ꎬ31(1):120 ̄126(inChinese). [29]张毅锋ꎬ何琨ꎬ张益荣ꎬ等.Menter转捩模型在高超声速流动模拟中的改进及验证[J].宇航学报ꎬ2016ꎬ37(4):397 ̄402.ZhangYFꎬHeKꎬZhangYRꎬetal.ImprovementandvalidationofMenterᶄstransitionmodelforhypersonicflowsimulation[J].JournalofAstronauticsꎬ2016ꎬ37(4):397 ̄402(inChinese).[30]LangtryRBꎬSenguptaKꎬYehDTꎬetal.Extendingtheγ ̄Reθtcorrelationbasedtransitionmodelforcrossfloweffects(Invited)[R].AIAA2015 ̄2474ꎬ2015. [31]SarkarS.Thepressure ̄dilatationcorrelationincompressi ̄bleflows[J].PhysicsofFluidsAꎬ1992ꎬ4(12):2674 ̄2682.[32]WilcoxDC.Dilatation ̄dissipationcorrectionsforadvancedturbulencemodels[J].AIAAJournalꎬ1992ꎬ30(11):2639 ̄2646.[33]马祎蕾ꎬ余平ꎬ姚世勇.壁温对钝三角翼边界层稳定性及转捩影响[J].空气动力学学报ꎬ2020ꎬ38(6):1017 ̄1026.MaYLꎬYuPꎬYaoSY.Effectofwalltemperatureonstabilityandtransitionofhypersonicboundarylayeronabluntdeltawing[J].ActaAerodynamicaSinicaꎬ2020ꎬ38(6):1017 ̄1026(inChinese).02。
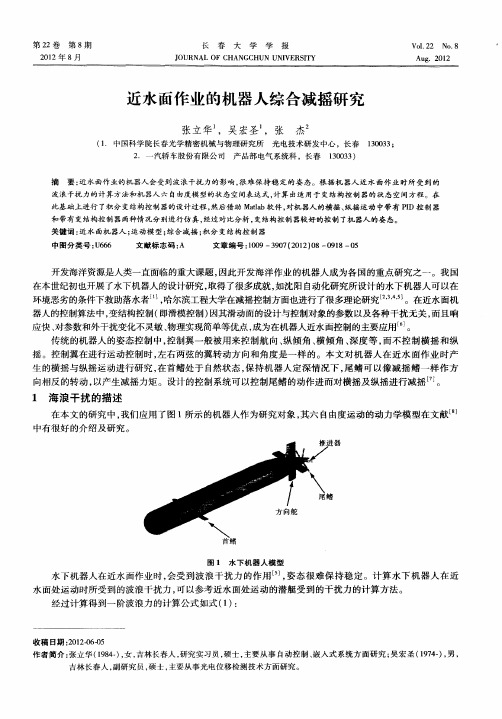
近水面作业的机器人综合减摇研究
其 中
=
[vp r zO uw qx  ̄ 0] yp 6 6n 印 ]
]
() 6 () 7
() 8
“是 控制 向量 , 由控 制翼 、 和推进器 速度 给 出 : 舵 /=[ Z
Y是输 出状 态 向量 :
第2 2卷
第 8期
长
春
大
学
学
报
Vo _ No. l22 8
Au . 2 2 g 01
21 02年 8月
J OURN AL 0F CHA NGC HU UNI ERS T N V IY
近水 面作 业 的 机 器 人综 合减 摇 研 究
张立 华 ,吴 宏 圣 ,张 杰
A。 A = ={ .6 , 系统二 和子 系统 四的极 点值 是 A: / 一00 }子 =l ={ 00 , 一 .5}子系统 五 和子 系统 六 的极 点值 是 A 以 = ={一 .3 。由前面切 换 面 的计 算 公 式 可 以得 到切 换 面 为 : , 0 0 , ] C 00 } C =C =[. 6 1 , =C 4=[ . 5 00 ,
1 5 1 0
—
5 0
鎏s 一
一
1 0
图 2 PD控 制 器 减 摇 时 的横 摇 角 I
一
o
靼
t /S
图 3 变 结 构 控 制 器 减 摇 时 的 横 摇 角
第 8期
张立华 , : 等 近水面作业 的机 器人综合减摇研究
机器 人 的首鳍 用于 控制水 下潜 水 的深度 , 尾鳍 用于 控制 水 下机 器 人保 持姿 态 J 。图 2可 以看 出整 个 运 动 过程 中 , 摇角度 值在 0角度 处左 右变 化 , 且变 化 幅值 很 大 , 大 值达 到 1。可 以看 出角 度 变化 曲线 的 横 并 最 5, 对称 轴在 0角 度轴 以上 。 因此 可 以推测 , 因为 受 波浪 力 的作用 , 波 浪遭 遇 角 为 9 。虽 然 有 PD控 制 器 保 且 0, I 持姿 态 , 但近 水面机 器人 横摇 角一边 的摇 摆 幅值大 于另一 边 的摇摆 幅值 , 很可 能会 发生侧 翻 。而 图 3变结 构 控 制器 控制 的近水 面机 器人 , 以看 出横 摇角 度值 在 0角度值 处变 化 , 且变 化 幅值很 小 。 可 并 图 4可 以看 出整个运 动过 程 中 , 纵摇 角度 值在 0角度 处上 下 变化 , 且变 化 幅值 很 大 , 并 最大 值达 到 1。 2。 尤 其在 6 s 10 的仿真 阶段 , 摇 角 度值 始 终 在 0角度 值 上 。而 图 5变 结 构 控 制 器 控 制 的 近水 面机 器 0 至 2s 纵
矢量推进自主水下航行器动力学建模及仿真
Wa n g Y u ,L i nXi u t a o ,S o n g S h i j u n ,L i uY u h o n g ,Z h a n gH o n g we i ,Wa n g S h u x i n
第4 7 卷 第 2期 2 0 1 4年 2月
【 ) 0I : 1 0 . 1 1 7 8 4 / t d x b z 2 0 1 2 0 5 0 5 5
天津大学学报 ( 自然科学与工程技术版) J o u r n a l o f T i a n j i n Un i v e r s i t y ( S c i e n c e a n d T e c h n o l o g y )
( S c h o o l o f Me c h a n i c a l E n g i n e e r i n g ,T i a n j i n U n i v e r s i t y ,T i a n j i n 3 0 0 0 7 2 ,C h i n a )
Ab s t r a c t :Co mp a r e d wi t h t h e a u t o n o mo u s u n d e r wa t e r v e h i c l e ( A UV) e q u i p p e d wi t h r u d d e r s ,t h e AU V wi t h v e c t o r e d
中图分类号 :T H1 1 3 . 2 文献标 志码 :A 文章编号 :0 4 9 3 . 2 1 3 7( 2 0 1 4 ) 0 2 . 0 1 4 3 . 0 6
Dy n a mi c Mo d e l i n g a n d S i mu l a t i o n o f Au t o n o mo u s Un d e r wa t e r
Structural Biological Materials-Critical Mechanics-Materials Connections
DOI: 10.1126/science.1220854, 773 (2013);339 Science et al.Marc André Meyers ConnectionsStructural Biological Materials: Critical Mechanics-MaterialsThis copy is for your personal, non-commercial use only.clicking here.colleagues, clients, or customers by , you can order high-quality copies for your If you wish to distribute this article to othershere.following the guidelines can be obtained by Permission to republish or repurpose articles or portions of articles): May 1, 2013 (this information is current as of The following resources related to this article are available online at/content/339/6121/773.full.html version of this article at:including high-resolution figures, can be found in the online Updated information and services, /content/339/6121/773.full.html#ref-list-1, 12 of which can be accessed free:cites 51 articles This article/cgi/collection/mat_sci Materials Sciencesubject collections:This article appears in the following registered trademark of AAAS.is a Science 2013 by the American Association for the Advancement of Science; all rights reserved. The title Copyright American Association for the Advancement of Science, 1200 New York Avenue NW, Washington, DC 20005. (print ISSN 0036-8075; online ISSN 1095-9203) is published weekly, except the last week in December, by the Science o n M a y 1, 2013w w w .s c i e n c e m a g .o r g D o w n l o a d e d f r o mStructural BiologicalMaterials:CriticalMechanics-Materials ConnectionsMarc AndréMeyers,1,2*Joanna McKittrick,1Po-Yu Chen3Spider silk is extraordinarily strong,mollusk shells and bone are tough,and porcupine quills and feathers resist buckling.How are these notable properties achieved?The building blocks of the materials listed above are primarily minerals and biopolymers,mostly in combination;the first weak in tension and the second weak in compression.The intricate and ingenious hierarchical structures are responsible for the outstanding performance of each material.Toughness is conferred by the presence of controlled interfacial features(friction,hydrogen bonds,chain straightening and stretching);buckling resistance can be achieved by filling a slender column with a lightweight foam.Here,we present and interpret selected examples of these and other biological materials.Structural bio-inspired materials design makes use of the biological structures by inserting synthetic materials and processes that augment the structures’capability while retaining their essential features.In this Review,we explain this idea through some unusual concepts.M aterials science is a vibrant field of in-tellectual endeavor and research.Thisfield applies physics and chemistry, melding them in the process,to the interrela-tionship between structure,properties,and perform-ance of complex materials with technological applications.Thus,materials science extends these rigorous scientific disciplines into complex ma-terials that have structures providing properties and synergies beyond those of pure and simple solids.Initially geared at synthetic materials,ma-terials science has recently extended its reach into biology,especially into the extracellular matrix, whose mechanical properties are of utmost im-portance in living organisms.Some of the semi-nal work and important contributions in this field are either presented or reviewed in(1–5).There are a number of interrelated features that define biological materials and distinguish them from their synthetic counterparts[inspired by Arzt(6)]: (i)Self-assembly.In contrast to many synthetic processes to produce materials,the structures are assembled from the bottom up,rather than from the top down.(ii)Multi-functionality.Many com-ponents serve more than one purpose.For exam-ple,feathers provide flight capability,camouflage, and insulation,whereas bones provide structural framework,promote the growth of red blood cells, and provide protection to the internal organs.(iii) Hierarchy.Different,organized scale levels(nano-to ultrascale)confer distinct and translatable prop-erties from one level to the next.We are starting to develop a systematic and quantitative understandingof this hierarchy by distinguishing the character-istic levels,developing constitutive descriptionsof each level,and linking them through appro-priate and physically based equations,enabling afull predictive understanding.(iv)Hydration.Theproperties are highly dependent on the level ofwater in the structure.There are some exceptions,such as enamel,but this rule applies to mostbiological materials and is of importance to me-chanical properties such as strength(which isdecreased by hydration)and toughness(which isincreased).(v)Mild synthesis conditions.Themajority of biological materials are fabricated atambient temperature and pressure as well as in anaqueous environment,a notable difference fromsynthetic materials fabrication.(vi)Evolution andenvironmental constraints.The limited availabil-ity of useful elements dictates the morphologyand resultant properties.The structures are notnecessarily optimized for all properties but arethe result of an evolutionary process leading tosatisfactory and robust solutions.(vii)Self-healingcapability.Whereas synthetic materials undergodamage and failure in an irreversible manner,biological materials often have the capability,due to the vascularity and cells embedded in thestructure,to reverse the effects of damage byhealing.The seven characteristics listed above arepresent in a vast number of structures.Nevertheless,the structures of biological materials can bedivided into two broad classes:(i)non-mineralized(“soft”)structures,which are composed of fibrousconstituents(collagen,keratin,elastin,chitin,lignin,and other biopolymers)that display widelyvarying mechanical properties and anisotropiesdepending on the function,and(ii)mineralized(“hard”)structures,consisting of hierarchicallyassembled composites of minerals(mainly,butnot solely,hydroxyapatite,calcium carbonate,and amorphous silica)and organic fibrous com-ponents(primarily collagen and chitin).The mechanical behavior of biological con-stituents and composites is quite diverse.Bio-minerals exhibit linear elastic stress-strain plots,whereas the biopolymer constituents are non-linear,demonstrating either a J shape or a curvewith an inflection point.Foams are characterizedby a compressive response containing a plastic orcrushing plateau in which the porosity is elim-inated.Many biological materials are compositeswith many components that are hierarchicallystructured and can have a broad variety of con-stitutive responses.Below,we present some of thestructures and functionalities of biological ma-terials with examples from current research.Here,we focus on three points:(i)How high tensilestrength is achieved(biopolymers),(ii)how hightoughness is attained(composite structures),and(iii)how bending resistance is achieved in light-weight structures(shells with an interior foam).Structures in Tension:Importance of BiopolymersThe ability to sustain tensile forces requires aspecific set of molecular and configurational con-formations.The initial work performed on exten-sion should be small,to reduce energy expenditure,whereas the material should stiffen close to thebreaking point,to resist failure.Thus,biopolymers,such as collagen and viscid(catching spiral)spidersilk,have a J-shaped stress-strain curve where mo-lecular uncoiling and unkinking occur with con-siderable deformation under low stress.This stiffening as the chains unfurl,straighten,stretch,and slide past each other can be repre-sented analytically in one,two,and three dimen-sions.Examples are constitutive equations initiallydeveloped for polymers by Ogden(7)and Arrudaand Boyce(8).An equation specifically proposedfor tissues is given by Fung(3).A simpler for-mulation is given here;the slope of the stress-strain(s-e)curve increases monotonically with strain.Thus,one considers two regimes:(i)unfurlingand straightening of polymer chainsd sd eºe nðn>1Þð1Þand(ii)stretching of the polymer chain backbonesd sd eºEð2Þwhere E is the elastic modulus of the chains.Thecombined equation,after integrating Eqs.1and2,iss=k1e n+1+H(e c)E(e–e c)(3)Here k1is a parameter,and H is the Heavisidefunction,which activates the second term at e=e c,where e c is a characteristic strain at whichcollagen fibers are fully extended.Subsequent straingradually becomes dominated by chain stretch-ing.The computational results by Gautieri et al.(9)on collagen fibrils corroborate Eq.3for n=1.This corresponds to a quadratic relation between1Department of Mechanical and Aerospace Engineering andMaterials Science and Engineering Program,University ofCalifornia,San Diego,La Jolla,CA92093,USA.2Department ofNanoengineering,University of California,San Diego,La Jolla,CA92093,USA.3Department of Materials Science and En-gineering,National Tsing Hua University,Hsinchu30013,Taiwan,Republic of China.*To whom correspondence should be addressed.E-mail:mameyers@ SCIENCE VOL33915FEBRUARY2013773o n M a y 1 , 2 0 1 3 w w w . s c i e n c e m a g . o r g D o w n l o a d e d f r o mstress and strain (s ºe 2),which has the char-acteristic J shape.Collagen is the most important structural bio-logical polymer,as it is the key component in many tissues (tendon,ligaments,skin,and bone),as well as in the extracellular matrix.The de-formation process is intimately connected to the different hierarchical levels,starting with the poly-peptides (0.5-nm diameter)to the tropocollagen molecules (1.5-nm diameter),then to the fibrils (~40-to 100-nm diameter),and finally to fibers (~1-to 10-m m diameter)and fascicles (>10-m m diameter).Molecular dynamics computations (9)of entire fibrils show the J -curve response;these computational predictions are well matched to atomic force microscopy (AFM)(10),small-angle x-ray scattering (SAXS)(11),and experiments by Fratzl et al .(12),as shown in Fig.1A.The effect of hydration is also seen and is of great impor-tance.The calculated density of collagen de-creases from 1.34to 1.19g/cm 3with hydration and is accompanied by a decrease in the Young ’s modulus from 3.26to 0.6GPa.The response of silk and spider thread is fascinating.As one of the toughest known ma-terials,silk also has high tensile strength and extensibility.It is composed of b sheet (10to 15volume %)nanocrystals [which consist of highly conserved poly-(Gly-Ala)and poly-Ala domains]embedded in a disordered matrix (13).Figure 1B shows the J -shape stress-strain curve and molecular configurations for the crystalline domains in silkworm (Bombyx mori )silk (14).Similar to collagen,the low-stress region corre-sponds to uncoiling and straightening of the pro-tein strands.This region is followed by entropic unfolding of the amorphous strands and then stiffening due to load transfer to the crystalline b sheets.Despite the high strength,the major mo-lecular interactions in the b sheets are weak hy-drogen bonds.Molecular dynamics simulations,Fig.1.Tensile stress-strain relationships in bio-polymers.(A )J -shaped curve for hydrated and dry collagen fibrils obtained from molecular dynamics (MD)simulations and AFM and SAXS studies.At low stress levels,considerable stretching occurs due to the uncrimping and unfolding of molecules;at higher stress levels,the polymer backbone stretches.Adapted from (9,12).(B )Stretching of dragline spider silk and molecular schematic of the protein fibroin.At low stress levels,entropic effects domi-nate (straightening of amorphous strands);at higher levels,the crystalline parts sustain the load.(C )Mo-lecular dynamics simulation of silk:(i)short stack and (ii)long stack of b -sheet crystals,showing that a higher pullout force is required in the short stack;for the long stack,bending stresses become im-portant.Hydrogen bonds connect b -sheet crystals.Adapted from (14).(D )Egg whelk case (bioelastomer)showing three regions:straightening of the a helices,the a helix –to –b sheet transformation,and b -sheet extension.A molecular schematic is shown.Adapted from (18).300.000.2Yield pointEntropic unfoldingMD simulationsStick slipStiffening β-crystal123456700012345670102030405050010001500200025050075010001250150017500.40.60.80.010.020.030.040.05MD wet (Gautieri et al)SAXS (Sasaki and Odajima)AFM (Aladin et al)MD dry (Gautieri et al)2520151050S t r e s s (M P a )S t r e s s(M P a )StrainABCDStrain (m/m)Length (nm)Length (nm)Stick-slip deformation (robust)"brittle" fracture (fragile)i iiP u l l -o u t f o r c e (p N )00.20.4Native state Unloading: reformation of α-helicesDomain 4: Extension andalignmentof β-sheets0.60.8ε=0ε4ε=01.0012345StrainS t r e s s (M P a )E n e r g y /v o l u m e (k c a l /m o l /n m 3)L e n g t hI I II II III IIIIVIVFDomain 3: Formation of β-sheetsfrom random coilsε3Domain 2: Extension of random coilsε2Domain 1: Unraveling of α-helicesinto random coilsε1Toughness (MD)Resilience (MD)T=-1°C T=20°C T=40°C T=60°C T=80°C15FEBRUARY 2013VOL 339SCIENCE 774REVIEWo n M a y 1, 2013w w w .s c i e n c e m a g .o r g D o w n l o a d e d f r o mshown in Fig.1C,illustrate an energy dissipative stick-slip shearing of the hydrogen bonds during failure of the b sheets (14).For a stack with a height L ≤3nm (left-hand side of Fig.1C),the shear stresses are more substantial than the flex-ure stresses,and the hydrogen bonds contribute to the high strength obtained (1.5GPa).How-ever,if the stack of b sheets is too high (right-hand side of Fig.1C),it undergoes bending with tensile separation between adjacent sheets.The nanoscale dimension of the b sheets allows for a ductile instead of brittle failure,resulting in high toughness values of silk.Thus,size affects the mechanical response considerably,changing the deformation characteristics of the weak hydro-gen bonds.This has also been demonstrated in bone (15–17),where sacrificial hydrogen bonds between mineralized collagen fibrils contribute to the excellent fracture resistance.Other biological soft materials have more complex responses,marked by discontinuities in d s /d e .This is the case for wool,whelk eggs,silks,and spider webs.Several mechanisms are responsible for this change in slope;for instance,the transition from a -to b -keratin,entropic changes with strain (such as those prevalent in rubber,where chain stretching and alignment decrease entropy),and others.The example of egg whelk is shown in Fig.1D (18).In this case,there is a specific stress at which a -keratin heli-ces transform to b sheets,with an associated change in length.Upon unloading,the reverse occurs,and the total reversible strain is,therefore,extensive.This stress-induced phase transforma-tion is similar to what occurs in shape-memory alloys.Thus,this material can experience sub-stantial reversible deformation (up to 80%)in a reversible fashion,when the stress is raised from 2to 5MPa,ensuring the survival of whelk eggs,which are continually swept by waves.These examples demonstrate the distinct properties of biopolymers that allow these ma-terials to be strong and highly extensible with distinctive molecular deformation characteristics.However,many interesting biological materials are composites of flexible biopolymers and stiff minerals.The combination of these two constit-uents leads to the creation of a tough material.Imparting Toughness:Importance of Interfaces One hallmark property of most biological com-posites is that they are tough.Toughness is defined as the amount of energy a material ab-sorbs before it fails,expressed asU ¼∫e fs d eð4Þwhere U is the energy per volume absorbed,s is the stress,e is the strain,and e f is the failure strain.Tough materials show considerable plastic deformation (or permanent damage)coupled with considerable strength.This maximizes the integral expression in Eq.4.Biological com-posite materials (for example,crystalline and noncrystalline components)have a plethora oftoughening mechanisms,many of which depend on the presence of interfaces.As a crack im-pinges on an interface or discontinuity in the material,the crack can be deflected around the interface (requiring more energy to propagate than a straight crack)or can drive through it.The strength of biopolymer fibers in tension im-pedes crack opening;bridges between micro-cracks are another mechanism.The toughening mechanisms have been divided into intrinsic (ex-isting in the material ahead of crack)and extrinsic (generated during the progression of failure)cat-egories (19).Thus,toughening is accomplished by a wide variety of stratagems.We illustrate this concept for four biological materials,shown in Fig.2.All inorganic materials contain flaws and cracks,which reduce the strength from the theo-retical value (~E /10to E /30).The maximum stress (s max )a material can sustain when a preexisting crack of length a is present is given by the Griffith equations max ¼ffiffiffiffiffiffiffiffiffiffi2g s E p a r ¼YK Icffiffiffiffiffip ap ð5Þwhere E is the Young ’s modulus,g s is the sur-face (or damage)energy,and Y is a geometric parameter.K Ic ¼Y −1ffiffiffiffiffiffiffiffiffiffi2g s E p is the fracture toughness,a materials property that expresses the ability to resist crack propagation.Abalone (Haliotis rufescens )nacre has a fracture tough-ness that is vastly superior to that of its major constituent,monolithic calcium carbonate,due to an ordered assembly consisting of mineral tiles with an approximate thickness of 0.5m m and a diameter of ~10m m (Fig.2A).Additionally,this material contains organic mesolayers (separated by ~300m m)that are thought to be seasonal growth bands.The tiles are connected by mineral bridges with ~50-nm diameter and are separated by organic layers,consisting of a chitin network and acidic proteins,which,when combined,have a similar thickness to the mineral bridge diame-ters.The Griffith fracture criterion (Eq.5)can be applied to predict the flaw size (a cr )at which the theoretical strength s th is achieved.With typical values for the fracture toughness (K Ic ),s th ,and E ,the critical flaw size is in the range of tens of nanometers.This led Gao et al .(20)to propose that at sufficiently small dimensions (less than the critical flaw size),materials become insensitive to flaws,and the theoretical strength (~E /30)should be achieved at the nanoscale.However,the strength of the material will be determined by fracture mechanisms operating at all hierar-chical levels.The central micrograph in Fig.2A shows how failure occurs by tile pullout.The interdigitated structure deflects cracks around the tiles instead of through them,thereby increasing the total length of the crack and the energy needed to fracture (increasing the toughness).Thus,we must de-termine how effectively the tiles resist pullout.Three contributions have been identified and are believed to operate synergistically (21).First,themineral bridges are thought to approach thetheoretical strength (10GPa),thereby strongly attaching the tiles together (22).Second,the tile surfaces have asperities that are produced during growth (23)and could produce frictional resist-ance and strain hardening (24).Third,energy is required for viscoelastic deformation (stretching and shearing)of the organic layer (25).One important aspect on the mechanical prop-erties is the effect of alignment of the mineral crystals.The oriented tiles in nacre result in an-isotropic properties with the strength and modulus higher in the longitudinal (parallel to the organic layers)than in the transverse direction.For a composite with a dispersed mineral m of volume fraction V m embedded in a biopolymer (bp)matrix that has a much lower strength and Young ’s modulus than the mineral,the ratio of the lon-gitudinal (L)and transverse (T)properties P (such as elastic modulus)can be expressed,in simpli-fied form,asP L P T ¼P mP bpV m ð1−V m Þð6ÞThus,the longitudinal properties are much higher than the transverse properties.This aniso-tropic response is also observed in other oriented mineralized materials,such as bone and teeth.Another tough biological material is the exo-skeleton of an arthropod.In the case of marine animals [for instance,lobsters (26,27)and crabs (28)],the exoskeleton structure consists of layers of mineralized chitin in a Bouligand arrange-ment (successive layers at the same angle to each other,resulting in a helicoidal stacking sequence and in-plane isotropy).These layers can be en-visaged as being stitched together with ductile tubules that also perform other functions,such as fluid transport and moisture regulation.The cross-ply Bouligand arrangement is effective in crack stopping;the crack cannot follow a straight path,thereby increasing the materials ’toughness.Upon being stressed,the mineral components frac-ture,but the chitin fibers can absorb the strain.Thus,the fractured region does not undergo physical separation with dispersal of fragments,and self-healing can take place (29).Figure 2B shows the structure of the lobster (Homarus americanus )exoskeleton with the Bouligand ar-rangement of the fibers.Bone is another example of a biological ma-terial that demonstrates high toughness.Skeletal mammalian bone is a composite of hydroxyapatite-type minerals,collagen and water.On a volu-metric basis,bone consists of ~33to 43volume %minerals,32to 44volume %organics,and 15to 25volume %water.The Young ’s modulus and strength increase,but the toughness decreases with increasing mineral volume fraction (30).Cortical (dense)mammalian bone has blood ves-sels extending along the long axis of the limbs.In animals larger than rats,the vessel is encased in a circumferentially laminated structure called the osteon.Primary osteons are surrounded by hypermineralized regions,whereas secondary SCIENCEVOL 33915FEBRUARY 2013775REVIEWo n M a y 1, 2013w w w .s c i e n c e m a g .o r g D o w n l o a d e d f r o m(remodeled)osteons are surrounded by a cement line (also of high mineral content)(31).In mam-malian cortical bone,the following intrinsic toughening mechanisms have been identified:molecular uncoiling and intermolecular sliding of collagen,fibrillar sliding of collagen bonds,and microcracking of the mineral matrix (19).Extrinsic mechanisms are collagen fibril bridging,uncracked ligament bridging,and crack deflec-tion and twisting (19).Rarely does a limb bone snap in two with smooth fracture surfaces;the crack is often deflected orthogonal to the crack front direction.In the case of (rehydrated)elk (Cervus elaphus )antler bone (shown in Fig.2C)(32),which has the highest toughness of any bone type by far (33),the hypermineralized re-gions around the primary osteons lead to crackdeflection,and the high amount of collagen (~60volume %)adds mechanisms of crack re-tardation and creates crack bridges behind the crack front.The toughening effect in antlers has been estimated as:crack deflection,60%;un-cracked ligament bridges,35%;and collagen as well as fibril bridging,5%(33).A particu-larly important feature in bone is that the fracture toughness increases as the crack propagates,as shown in the plot.This plot demonstrates the crack extension resistance curve,or R -curve,behavior,which is the rate of the total energy dissipated as a function of the crack size.This occurs by the activation of the extrinsic tough-ening mechanisms.In this manner,it becomes gradually more difficult to advance the crack.In human bone,the cracks are deflected and/ortwisted around the cement lines surrounding the secondary osteons and also demonstrate R -curve behavior (34).The final example illustrating how the presence of interfaces is used to retard crack propagation is the glass sea sponge (Euplectella aspergillum ).The entire structure of the V enus ’flower basket is shown in Fig.2D.Biological silica is amorphous and,within the spicules,consists of concentric layers,separated by an organic material,silicatein (35,36).The flexure strength of the spicule notably exceeds (by approximately fivefold)that of monolithic glass (37).The principal reason is the presence of interfaces,which can arrest and/or deflect the crack.Biological materials use ingenious meth-ods to retard the progression of cracks,therebyAbalone shell: NacreMineral bridgesLobsterDeer antlerChitin fibril networkHuman cortical boneMineral crystallitesPrimary osteonsSubvelvet/compact Subvelvet/cCompact Comp p actTransition zoneCancellousCollagen fibrilsDeep sea spongeSkeletonSpicules20 mm1 cmHuman cortical boneElk antlerTransverseIn-plane longitudinalASTM validASTM invalid Mesolayers ABCD0.1 mm500 nm500 nm ˜1 nm˜3 nm˜20 nmCrack extension, ⌬a (mm)T o u g h n e s s , J (k J m -2)50 nm200 nm 10 m500 nm2 m1 m200 m300 m˜10 m0.010.11101000.20.40.6500 00 nm50 nmFig.2.Hierarchical structures of tough biological materials demonstrating the heterogeneous interfaces that provide crack deflection.(A )Abalone nacre showing growth layers (mesolayers),mineral bridges between mineral tiles and asperities on the surface,the fibrous chitin network that forms the backbone of the inorganic layer,and an example of crack tortuosity in which the crack must travel around the tiles instead of through them [adapted from (4,21)].(B )Lobster exoskeleton showing the twisted plywood structure of the chitin (next to the shell)and the tubules that extend from the chitin layers to the animal [adapted from (27)].(C )Antler bone image showing the hard outer sheath (cortical bone)surrounding the porous bone.The collagen fibrils are highly aligned in the growth direction,with nanocrystalline minerals dispersed in and around them.The osteonal structure in a cross section of cortical bone illustrates the boundaries where cracks perpendicular to the osteons can be directed [adapted from (33)].ASTM,American Society for Testing and Mate-rials.(D )Silica sponge and the intricate scaffold of spicules.Each spicule is a circumferentially layered rod:The interfaces between the layers assist in ar-resting crack anic silicate in bridging adjacent silica layers is observed at higher magnification (red arrow)(36).15FEBRUARY 2013VOL 339SCIENCE776REVIEWo n M a y 1, 2013w w w .s c i e n c e m a g .o r g D o w n l o a d e d f r o mincreasing toughness.These methods operate at levels ranging from the nanoscale to the structur-al scale and involve interfaces to deflect cracks,bridging by ductile phases (e.g.,collagen or chitin),microcracks forming ahead of the crack,delocal-ization of damage,and others.Lightweight Structures Resistant to Bending,Torsion,and Buckling —Shells and FoamsResistance to flexural and torsional tractions with a prescribed deflection is a major attribute of many biological structures.The fundamental mechanics of elastic (recoverable)deflection,as it relates to the geometrical characteristics of beams and plates,is given by two equations:The first relates the bending moment,M ,to the curvature of the beam,d 2y /dx 2(y is the deflection)d 2y dx 2¼MEIð7Þwhere I is the area moment of inertia,which de-pends on the geometry of the cross section (I =p R 4/4,for circular sections,where R is the ra-dius).Importantly,the curvature of a solid beam,and therefore its deflection,is inversely propor-tional to the fourth power of the radius.The sec-ond equation,commonly referred to as Euler ’s buckling equation,calculates the compressive load at which global buckling of a column takes place (P cr )P cr ¼p 2EI ðkL Þ2ð8Þwhere k is a constant dependent on the column-end conditions (pinned,fixed,or free),and L is the length of the column.Resistance to buck-ing can also be accomplished by increasing I .Both Eqs.7and 8predict the principal designLongitudinal sectionToucan beak Keratin layers(i) Fibers(circumferential)Megafibrils and fibrilsBarbsBarbulesCortexCortical ridgesFoamRachisNodes(iii) Medulloidpith(ii) Fibers (longitudinal)Feather rachisPlant-Bird of ParadisePorcupine quillsNodesRebarClosed-cell foamTransverseLongitudinalCross sectionABCD5 mm 1 mm1 cm 0.1 mm5m 5 m m1c 1 c m1 mm100 m500 mFig.3.Low-density and stiff biological materials.The theme is a dense outer layer and a low-density core,which provides a high bending strength –to –weight ratio.(A )Giant bird of paradise plant stem showing the cellular core with porous walls.(B )Porcupine quill exhibiting the dense outer cortex surrounding a uniform,closed-cell foam.Taken from (42).(C )Toucan beak showing the porousinterior (bone)with a central void region [adapted from (43)].(D )Schematic view of the three major structural components of the feather rachis:(i)superficial layers of fibers,wound circumferentially around the rachis;(ii)the majority of the fibers extending parallel to the rachidial axis and through the depth of the cortex;and (iii)foam comprising gas-filled polyhedral structures.Taken from (45)SCIENCEVOL 33915FEBRUARY 2013777REVIEWo n M a y 1, 2013w w w .s c i e n c e m a g .o r g D o w n l o a d e d f r o m。
自主航行模式下二维摆动尾鳍的推进性能研究
v hil e c e,n me i a i lto fh d o y a c c r c e fs l— r p li n c u lfn wa o u rc lsmu a in o y r d n mi ha a tro efp o u so a da sc mpih p th n nd s l- r p so mo e n r c mp t d. e n me i a ac lto de o efprpu so t ic i g a efp o uli n v me twe e o u e Th u rc lc l u ai n mo l f s l- o lin c u a n wa sa ls e a d lf se t b ih d.Fu t e mo e,t e ef c fd fe e a a t r n t o sr t r n y r d n m- i rh r r h fe to ifr ntp r mee so hef w tucu ea d h d o y a l i e f r n e o a d lfn wa t d e n hev lct fs l- r p li n c u lfn wa t r n d.Ther s l c p ro ma c fc u a ssu i d a d t e o i o efp o u so a da sdee mie i y i e u t s o h tg e tp o uli n a d hih s e d a e a q ie h wst a r a r p so n g p e r c u r d whe he o clai g fe u n y o a d lfn i n r a — n t s iltn r q e c fc u a s i c e s i i .Th f c fc u a n i rilo h r p li n p ro ma c s d s u s d t r u h c mp rn o t x fe d ng e ef to a d lf ne a n t e p o u so e r n e i ic s e h o g o a i g v re l e i t f i sr cu e a d t e e ou i n p o e s u de h o tan d nd s l- o u so de tu t r n h v l to r c s n rt e c nsr i tmo e a efpr p lin mo .Th a c l t n r s ls e c lu a i e u t o a e i o d a r e n t he e o x e i n a a u e n n t i r t r r n g o g e me twih t s fe p rme t lme s r me ti he l e a u e. t
分等级大微孔、介孔大孔
ARTICLEOPENReceived11Dec2012|Accepted16May2013|Published14Jun2013A solid with a hierarchical tetramodalmicro-meso-macro pore size distributionYu Ren1,Zhen Ma2,3,Russell E.Morris1,Zheng Liu1,Feng Jiao4,Sheng Dai3&Peter G.Bruce1Porous solids have an important role in addressing some of the major energy-related pro-blems facing society.Here we describe a porous solid,a-MnO2,with a hierarchical tetramodalpore size distribution spanning the micro-,meso-and macro pore range,centred at0.48,4.0,18and70nm.The hierarchical tetramodal structure is generated by the presence ofpotassium ions in the precursor solution within the channels of the porous silica template;thesize of the potassium ion templates the microporosity of a-MnO2,whereas theirreactivity with silica leads to larger mesopores and macroporosity,without destroying themesostructure of the template.The hierarchical tetramodal pore size distribution influencesthe properties of a-MnO2as a cathode in lithium batteries and as a catalyst,changingthe behaviour,compared with its counterparts with only micropores or bimodalmicro/mesopores.The approach has been extended to the preparation of LiMn2O4with ahierarchical pore structure.1EaStCHEM,School of Chemistry,University of St Andrews,St Andrews KY169ST,UK.2Shanghai Key Laboratory of Atmospheric Particle Pollution and Prevention(LAP3),Department of Environmental Science and Engineering,Fudan University,Shanghai200433,China.3Chemical Sciences Division,Oak Ridge National Laboratory,Oak Ridge,T ennessee37831,USA.4Department of Chemical and Biomolecular Engineering,University of Delaware,Newark,Delaware19716,USA.Correspondence and requests for materials should be addressed to P.G.B.(email:p.g.bruce@).P orous solids have an important role in addressing some of the major problems facing society in the twenty-first century,such as energy storage,CO2sequestration,H2 storage,therapeutics(for example,drug delivery)and catalysis1–8. The size of the pores and their distribution directly affect their ability to function in a particular application2.For example, zeolites are used as acid catalysts in industry,but their micropores impose severe diffusion limitations on the ingress and egress of the reactants and the catalysed products9.To address such issues, great effort is being expended in preparing porous materials with a bimodal(micro and meso)pore structure by synthesizing zeolites or silicas containing micropores and mesopores10–17,or microporous metal–organic frameworks with ordered mesopores18.Among porous solids,porous transition metal oxides are particularly important,because they exhibit many unique properties due to their d-electrons and the variable redox state of their internal surfaces8,19–22.Here we describe thefirst solid(a-MnO2)possessing hierarchical pores spanning the micro,meso and macro range, centred at0.48,4.0,18and70nm.The synthesis method uses mesoporous silica as a hard template.Normally such a template generates a mesoporous solid with a unimodal23–31or,at most,a bimodal pore size distribution32–38.By incorporating Kþions in the precursor solution,within the silica template,the Kþions act bifunctionally:their size templates the formation of the micropores in a-MnO2,whereas their reactivity with silica destroys the microporous channels in KIT-6comprehensively, leading to the formation of a-MnO2containing large mesopores and,importantly,macropores,something that has not been possible by other methods.Significantly,this is achieved without destroying the silica template by alkaline ions.The effect of the tetramodal pore structure on the properties of the material is exemplified by considering their use as electrodes for lithium-ion batteries and as a catalyst for CO oxidation and N2O decomposition.The novel material offers new possibilities for combining the selectivity of small pores with the transport advantages of the large pores across a wide range of sizes.We also present results demonstrating the extension of the method to the synthesis of LiMn2O4with a hierarchical pore structure.ResultsComposition of tetramodal a-MnO2.The composition of the synthesized material was determined by atomic absorption ana-lysis and redox titration to be K0.08MnO2(the K/Mn ratio of the precursor solution was1/3).The material is commonly referred to as a-MnO2,because of the small content of Kþ19.N2sorption analysis of tetramodal a-MnO2.The tetramodal a-MnO2shows a type IV isotherm(Fig.1a).The pore size dis-tribution(Fig.1b)in the range of0.3–200nm was analysed using the density functional theory(DFT)method applied to the adsorption branch of the isotherm39–42,as this is more reliable than analysing the desorption branch43;note that this is not the DFT method used in ab initio electronic structure calculations. Plots were constructed with vertical axes representing ‘incremental pore volume’and‘incremental surface area’.Large (macro)pores can account for a significant pore volume while representing a relatively smaller surface area and vice versa for small(micro)pores.Therefore,when investigating a porous material with a wide range of pore sizes,for example,micropore and macropore,the combination of surface area and pore volume is essential to determine the pore size distribution satisfactorily (Fig.1b).Considering both pore volume and surface area, significant proportions of micro-,meso-and macropores are evident,with distinct maxima centred at0.70,4.0,18and70nm.To probe the size of the micropores more precisely than is possible with DFT,the Horvath–Kawazoe pore size distribution analysis was employed44.A single peak was obtained at0.48nm(Fig.1c),in good accord with the0.46-nm size of the2Â2channels of a-MnO2 (refs.19,21).The relatively small Brunauer–Emmett–Teller(BET) surface area of tetramodal a-MnO2(79–105m2gÀ1; Supplementary Table S1)compared with typical surface areas of mesoporous metal oxides(90–150m2gÀ1)45is due to the significant proportion of macropores(which have small surface areas)and relatively large(18nm)mesopores—a typical mesoporous metal oxide has only3–4nm pores.TEM analysis of tetramodal a-MnO2.Transmission electron microscopic(TEM)data for tetramodal a-MnO2,Fig.2, demonstrates a three-dimensional pore structure with a sym-metry consistent with space group Ia3d.From the TEM data,an a0lattice parameter of23.0nm for the mesostructure could be extracted,which is in good agreement with the value obtained from the low-angle powder X-ray diffraction(PXRD)data, a0¼23.4nm(Supplementary Fig.S1a).High-resolution TEM images in Fig.2c–e demonstrate that the walls are crystalline with a typical wall thickness of10nm.The lattice spacings of0.69,0.31 and0.35nm agree well with the values of6.92,3.09and3.46Åfor the[110],[310]and[220]planes of a-MnO2(International Centre for Diffraction Data(ICDD)number00-044-0141), respectively.The wide-angle PXRD data matches well with the PXRD data of bulk cryptomelane a-MnO2(Supplementary Fig. S1b),confirming the crystalline walls.The various pores in tetramodal a-MnO2can be observed by TEM directly:the0.48-nm micropores are seen in Fig.2e(2Â2 tunnels with dimensions of0.48Â0.48nm in the white box);the 4.0-nm pores are shown in Fig.2b–d;the18-nm pores are shown in Fig.2a;the70-nm pores are evident in Fig.2b(highlighted with white circles).Li intercalation.Li can be intercalated into bulk a-MnO2 (ref.46).Therefore,it is interesting to compare Li intercalation into bulk a-MnO2(micropores only)and bimodal a-MnO2 (micropores along with a single mesopore of diameter3.6nm,see Methods)with tetramodal a-MnO2(micro-,meso-and macropores).Each of the three a-MnO2materials was subjected to Li intercalation by incorporation as the positive electrode in a lithium battery,along with a lithium anode and a non-aqueous electrolyte(see Methods).The results of cycling(repeated intercalation/deintercalation of Li)the cells are shown in Fig.3. Although all exhibit good capacity to cycle Li at low rates of charge/discharge(30mA gÀ1),tetramodal a-MnO2shows sig-nificantly higher capacity(Li storage)at a high rate of 6,000mA gÀ1(corresponding to charge and discharge in3min). The tetramodal a-MnO2can store three times the capacity(Li) compared with bimodal a-MnO2,and18times that of a-MnO2 with only micropores,at the high rate of intercalation/deinter-calation(Fig.3).The superior rate capability of tetramodal a-MnO2over microporous and bimodal forms may be assigned to better Liþtransport in the electrolyte within the hierarchical pore structure of tetramodal a-MnO2.The importance of elec-trolyte transport in porous electrodes has been discussed recently35,47,48and the results presented here reinforce the beneficial effect of a hierarchical pore structure.Catalytic studies.CO oxidation and N2O decomposition were used as reactions to probe the three different forms of a-MnO2as catalysts(Supplementary Fig.S2).As shown in Supplementary Fig.S2a,tetramodal a-MnO2demonstrates better catalytic activity compared with only micropores or bimodal a-MnO2;thetemperature of half CO conversion (T 50)was 124°C for tetra-modal a -MnO 2,whereas microporous and bimodal a -MnO 2exhibited a T 50value of 275°C and 209°C,respectively.In the case of N 2O decomposition,a -MnO 2with only micropores demonstrated no catalytic activity in the range of 200–400°C,in accord with a previous report 49.Tetramodal and bimodal a -MnO 2showed catalytic activity and reached 32%and 20%of N 2O conversion,respectively,at a reaction temperature of 400°C.The differences in catalytic activity are related to the differences in the material.A detailed study focusing on the catalytic activity alonewould be necessary to demonstrate which specific features of the textural differences (pore size distribution,average manganese oxidation state,K þand so on)between the different MnO 2materials are responsible for the differences in behaviour.However,the preliminary results shown here do illustrate that such differences exist.Porous LiMn 2O 4.To demonstrate the wider applicability of the synthesis method,LiMn 2O 4with a hierarchical pore structurewas1801601401201008060402000.00.20.40.60.81.0V (c m 3 g –1)Pore diameter (nm)0.0120.0100.0080.0060.0040.0020.000I n c r e m e n t a l p o r e v o l u m e (c m 3 g –1)Pore width (nm)I n c r e m e n t a l s u r f a c e a r e a (m 2 g –1)I n c r e m e n t a l s u r f a c e a r e a (m 2 g –1)P /P 0Figure 1|N 2sorption analysis of tetramodal a -MnO 2.(a )N 2adsorption–desorption isotherms,(b )DFT pore size distribution and (c )Horvath–Kawazoe pore size distribution from N 2adsorption isotherm for tetramodal a -MnO 2.Figure 2|TEM images of tetramodal a -MnO 2.TEM images along (a )[100]direction,showing 18nm mesopores (scale bar,50nm);(b )4.0and 70nm pores (70nm pores are highlighted by white circles;scale bar,100nm);(c –e )high-resolution (HRTEM)images of tetramodal a -MnO 2showing 4.0and 0.48nm pores (scale bar,10nm).Inset is representation of a -MnO 2structure along the c axis,demonstrating the 2Â2micropores as shown in the HRTEM (white box)in e .Purple,octahedral MnO 6;red,oxygen;violet,potassium.synthesized in a way similar to that of tetramodal a -MnO 2.The main difference is the use of LiNO 3instead of KNO 3(see Methods).In this case,Li þreacts with the silica template col-lapsing/blocking the microporous channels in the KIT-6and resulting in the large mesopores and macropores (17and 50nm)in the LiMn 2O 4obtained.The use of Li þinstead of the larger K þdeters the formation of micropores because Li þis too small.TEM analysis illustrates the hierarchical pore structure of LiMn 2O 4(Supplementary Fig.S3):4.0nm pores are evident in Supplementary Fig.S3b;17nm pores in Supplementary Fig.S3a;and 50nm pores in Supplementary Fig.S3b (highlighted with white circles).The d-spacing of 0.47nm in the high-resolution TEM image (Supplementary Fig.S3c)is in good accordance with the values of 0.4655nm for the [111]planes of LiMn 2O 4(ICDD number 00-038-0789)and with the wide-angle PXRD data (Supplementary Fig.S4).The original DFT pore size distribution analysis from N 2sorption (adsorption branch)gives three pore sizes in the range of 1–100nm centred at 4.0,17and 50nm (Supplementary Fig.S5).A more in-depth presentation of the results for LiMn 2O 4will be given in a future paper;preliminary results presented here illustrate that the basic method can be applied beyond a -MnO 2.DiscussionTurning to the synthesis of the tetramodal a -MnO 2,the details are given in the Methods section.Hard templating using silica templates,such as KIT-6,normally gives rise to materials with unimodal or,at most,bimodal mesopore structures,and in the latter case the smaller mesopores dominate over the larger mesopores 8,32,35.Alkali ions are excellent templates for micropores in transition metal oxides 19,21,but they have been avoided in nanocasting from silica templates because of concerns that they would react with and,hence,destroy thesilica20018016014012010080604020D i s c h a r g e c a p a c i t y (m A h g –1)0Cycle numberx in Li x MnO 2Figure 3|Electrochemical behaviour of different a -MnO 2.Capacity retention for tetramodal a -MnO 2cycled at 30(empty blue circles)and 6,000mA g À1(filled blue circles);bulk a -MnO 2cycled at 30(empty red squares)and 6,000mA g À1(filled red squares);bimodal a -MnO 2cycled at 30(empty black triangle)and 6,000mA g À1(filled blacktriangles).18 nm pores70 nm poresTwo sets of mesoporeschannels connecting both sets of mesoporesEtching of silica Etching of silica Etching of silica template2discontinuously within one set of the KIT-6mesoporesFigure 4|Formation mechanism of meso and macropores in tetramodal a -MnO 2.When both KIT-6mesochannels are occupied by a -MnO 2and then the silica between them etched away,the remaining pore is 4nm (centre portion of figure).When a -MnO 2grows in only one set of mesochannels and then the KIT-6is dissolved away,the remaining metal oxide has 18nm pores (upper portion of figure).The comprehensive destruction of the microchannels in KIT-6by K þleads to a -MnO 2growing in only a proportion of one set of the KIT-6mesochannels,resulting in the formation of B 70nm pores (lower portion of figure).template50.Here,not only have alkali ions been used successfully in precursor solutions without destroying the template mesostructure but they give rise to macropores in the a-MnO2, thus permitting the synthesis of a tetramodal,micro-small,meso-large,meso-macro pore structure.Synthesis begins by impregnating the KIT-6silica template with a precursor solution containing Mn2þand Kþions.On heating,the Kþions template the formation of the micropores in a-MnO2,as the latter forms within the KIT-6template.KIT-6 consists of two interpenetrating mesoporous channels linked by microporous channels51–53.The branches of the two different sets of mesoporous channels in KIT-6are nearest neighbours separated by a silica wall of B4nm53;therefore,when both KIT-6mesochannels are occupied by a-MnO2and the silica between them etched away,the remaining pore is4nm(see centre portion of Fig.4).It has been shown previously,by a number of authors,that by varying the hydrothermal conditions used to prepare the KIT-6,the proportion of the microchannels can be decreased to some extent,thus making it difficult to simultaneouslyfill the neighbouring KIT-6mesoporous channels by the precursor solution of the target mesoporous metal oxide33–35.As a result,the target metal oxide grows in only one set of mesochannels of the KIT-6host but not both.When the KIT-6is dissolved away,the remaining metal oxide has B18nm pores,because the distance between adjacent branches of the same KIT-6mesochannels is greater than between the two different mesochannels in KIT-6.Here we propose that the Kþions have a similar effect on the KIT-6to that of the hydrothermal synthesis,but by a completely different mechanism.Reaction between the Kþions in the precursor solution with the silica during calcination results in the formation of Kþ-silicates,which cause collapse or blocking of the microporous channels in KIT-6,such that the a-MnO2grows in one set of the KIT-6mesochannels,giving rise to18nm pores in a-MnO2when the silica is etched away,see top portion of Fig.4. However,the reaction between Kþand the silica is more severe than the effect of varying the hydrothermal treatment.In the former case,the KIT-6microchannels are so comprehensively destroyed that the proportion of the large(18nm)to smaller (4nm)mesopores is greater than can be achieved by varying hydrothermal conditions.The comprehensive destruction of the microchannels in KIT-6by Kþ,perhaps augmented by some minor degradation of parts of the mesochannels,leads to a-MnO2 growing in only a proportion of one set of the KIT-6 mesochannels,resulting in the formation of B70nm pores in a-MnO2,see lower portion of Fig.4.In summary,the Kþreactivity with the silica goes beyond what can be achieved by varying the conditions of hydrothermal synthesis and is responsible for generating the tetramodal pore size distribution reported here. The mechanism of pore formation in a-MnO2by reaction between Kþand the silica template is supported by several findings.First,by the lower K/Mn molar ratio of thefinal tetramodal a-MnO2product(0.08)compared with the starting materials(0.33)implies that some of the Kþions in the impregnating solution have reacted with the silica.Second, support for collapse/blocking of the microporous channels in KIT-6due to reaction with Kþwas obtained by comparing the texture of KIT-6impregnated with an aqueous solution contain-ing only KNO3and calcined at300and500°C.The micropore volume in KIT-6is the greatest,with no KNO3in the solution;it then decreases continuously as the calcination temperature and calcination time is increased,such that after2and5h at500°C the micropore volume has decreased to zero(Supplementary Fig. S6).Third,we prepared tetramodal a-MnO2using a similar synthetic procedure to that described in the Methods section, except that this time we used a covered tall crucible for the calcination step.Sun et al.54have shown that using a covered,tall crucible when calcining results in porous metal oxides with much larger particle sizes.If the70-nm pores had arisen simply from the gaps between the particles,then the pore size would have changed;in contrast,it remained centred at70nm, Supplementary Fig.S7,consistent with the70-nm pores being intrinsic to the materials and arising from reaction with the Kþas described above.Fourth,if the synthesis of MnO2is carried out using the KIT-6template but in the absence Kþions,then the DFT pore size distribution shown in Supplementary Fig.S8is obtained.The0.48-and70-nm pores are now absent,but the4-and18-nm pores remain.This demonstrates the key role of Kþin the formation of the smallest and largest pores and,hence,in generating the tetramodal pore size distribution.The absence of Kþmeans that there is nothing to template the0.48nm pores and so a-MnO2is not formed;the b-polymorph is obtained instead.The absence of Kþalso means that the microchannels in the KIT-6template remain intact,resulting in no70nm pores and the dominance of the4-nm pores compared with the 18-nm pores.The hierarchical pore structure can be varied systematically by controlling the synthesis conditions,in particular the Kþ/Mn ratio of the precursor solution.A range of Kþ/Mn ratios,1/5,1/3and1/2,gave rise to a series of pore size distributions,in which the pore sizes remained the same but the relative proportions of the different pores varied (Supplementary Table S1).The higher the Kþ/Mn ratio,the greater the proportion of macropores and large mesopores.This is in accord with expectations,as the higher the Kþconcentra-tion in the precursor solution the greater the collapse/blocking of the microporous channels in the KIT-6(as noted above),and hence the greater the proportion of macropores and large mesopores.Indeed,these results offer further support for the mechanism of pore size distribution arising from reaction between Kþand the silica template.In conclusion,tetramodal a-MnO2,thefirst porous solid with a tetramodal pore size distribution,has been synthesized.Its hierarchical pore structure spans the micro,meso and macropore range between0.3and200nm,with pore dimensions centred at 0.48,4.0,18and70nm.Key to the synthesis is the use of Kþions that not only template the formation of micropores but also react with the silica template,therefore,breaking/blocking the micro-porous channels in the silica template far more comprehensively than is possible by varying the hydrothermal synthesis conditions, to the extent that macropores are formed,and without destroying the silica mesostructure by alkali ions,as might have been expected.The resulting hierarchical tetramodal structure demon-strates different behaviours compared with microporous and bimodal a-MnO2as a cathode material for Li-ion batteries,and when used as a catalyst for CO oxidation and N2O decomposi-tion.The method has been extended successfully to the preparation of hierarchical LiMn2O4.MethodsSynthesis.Tetramodal a-MnO2(surface area96m2gÀ1,K0.08MnO2)was pre-pared by two-solvent impregnation55using Kþand mesoporous silica KIT-6as the hard template.KIT-6was prepared according to a previous report (hydrothermal treatment at100°C)51.In a typical synthesis of tetramodal a-MnO2, 7.53g of Mn(NO3)2Á4H2O(98%,Aldrich)and1.01g of KNO3(99%,Aldrich)were dissolved in B10ml of water to form a solution with a molar ratio of Mn/K¼3.0. Next,5g of KIT-6was dispersed in200ml of n-hexane.After stirring at room temperature for3h,5ml of the Mn/K solution was added slowly with stirring.The mixture was stirred overnight,filtered and dried at room temperature until a completely dried powder was obtained.The sample was heated slowly to500°C (1°C minÀ1),calcined at that temperature for5h with a cover in a normal crucible unless is specified54and the resulting material treated three times with a hot aqueous KOH solution(2.0M),to remove the silica template,followed by washing with water and ethanol several times,and then drying at60°C.Bimodal a-MnO2(surface area58m2gÀ1,K0.06MnO2)with micropore and a single mesopore size of3.6nm was prepared by using mesoporous silica SBA-15as a hard template.The SBA-15was prepared according to a previous report56.Bulk a-MnO2(surface area8m2gÀ1,K0MnO2)was prepared by the reaction between325mesh Mn2O3(99.0%,Aldrich)and6.0M H2SO4solution at80°C for 24h,resulting in the disproportionation of Mn2O3into a soluble Mn2þspecies and the desired a-MnO2product46.Treatment of KIT-6with KNO3was carried out as follows:1.01g of KNO3was dissolved in B15ml of water to form a KNO3solution.Five grams of mesoporous KIT-6was dispersed in200ml of n-hexane.After stirring at room temperature for 3h,5ml of KNO3solution was added slowly with stirring.The mixture was stirred overnight,filtered and dried at room temperature until a completely dried powder was obtained.The sample was heated slowly to300or500°C(1°C minÀ1), calcined at that temperature for5h and the resulting material was washed with water and ethanol several times,and then dried at60°C overnight.The synthesis method for hierarchical porous LiMn2O4was similar to that of tetramodal a-MnO2.The main difference was to use1.01g of LiNO3instead of KNO3.After impregnation into KIT-6,calcination and silica etching,porous LiMn2O4was obtained.Characterization.TEM studies were carried out using a JEOL JEM-2011, employing a LaB6filament as the electron source,and an accelerating voltage of 200keV.TEM images were recorded by a Gatan charge-coupled device camera in a digital format.Wide-angle PXRD data were collected on a Stoe STADI/P powder diffractometer operating in transmission mode with Fe K a1source radiation(l¼1.936Å).Low-angle PXRD data were collected using a Rigaku/MSC,D/max-rB with Cu K a1radiation(l¼1.541Å)operating in reflection mode with a scintillation detector.N2adsorption–desorption analysis was carried out using a Micromeritics ASAP2020.The typical sample weight used was100–200mg. The outgas condition was set to300°C under vacuum for2h,and all adsorption–desorption measurements were carried out at liquid nitrogen tem-perature(À196°C).The original DFT method for the slit pore geometry was used to extract the pore size distribution from the adsorption branch usingthe Micromeritics software39–42.A Horvath–Kawazoe method was used to extract the microporosity44.Mn and K contents were determined by chemical analysis using a Philips PU9400X atomic adsorption spectrometer.The average oxidation state of framework manganese in a-MnO2samples was determined by a redoxtitration method57.Electrochemistry.First,the cathode was constructed by mixing the active material (a-MnO2),Kynar2801(a copolymer based on polyvinylidenefluoride),and Super S carbon(MMM)in the weight ratio80:10:10.The mixture was cast onto Al foil (99.5%,thickness0.050mm,Advent Research Materials,Ltd)from acetone using a Doctor-Blade technique.After solvent evaporation at room temperature and heating at80°C under vacuum for8h,the cathode was assembled into cells along with a Li metal anode and electrolyte(Merck LP30,1M LiPF6in1:1v/v ethylene carbonate/dimethyl carbonate).The cells were constructed and handled in anAr-filled MBraun glovebox(O2o0.1p.p.m.,H2O o0.1p.p.m.).Electrochemical measurements were carried out at30°C using a MACCOR Series4200cycler.Catalysis.Catalytic CO oxidation was tested in a plug-flow microreactor(Alta-mira AMI200).Fifty milligrams of catalyst was loaded into a U-shaped quartz tube (4mm i.d.).After the catalyst was pretreated inflowing8%O2(balanced with He) at400°C for1h,the catalyst was then cooled down,the gas stream switched to1% CO(balanced with air)and the reaction temperature ramped using a furnace(at a rate of1°C minÀ1above ambient temperature)to record the light-off curve.The flow rate of the reactant stream was37cm3minÀ1.A portion of the product stream was extracted periodically with an automatic sampling valve and was analysed using a dual column gas chromatograph with a thermal conductivity detector.To perform N2O decomposition reaction testing,0.5g catalyst was packed into a U-shaped glass tube(7mm i.d.)sealed by quartz wool,and pretreated inflowing 20%O2(balance He)at400°C for1h(flow rate:50cm3minÀ1).After cooling to near-room temperature,a gas stream of0.5%N2O(balance He)flowed through the catalyst at a rate of60cm3minÀ1,and the existing stream was analysed by a gas chromatograph(Agilent7890A)that separates N2O,O2and N2.The reaction temperature was varied using a furnace,and kept at100,150,200,250,300,350 and400°C for30min at each reaction temperature.The N2O conversion determined from GC analysis was denoted as X¼([N2O]in—[N2O]out)/[N2O]inÂ100%.References1.Corma,A.From microporous to mesoporous molecular sieve materials andtheir use in catalysis.Chem.Rev.97,2373–2419(1997).2.Davis,M.E.Ordered porous materials for emerging applications.Nature417,813–821(2002).3.Taguchi,A.&Schu¨th,F.Ordered mesoporous materials in catalysis.Micro.Meso.Mater.77,1–45(2005).4.Fe´rey,G.Hybrid porous solids:past,present,future.Chem.Soc.Rev.37,191–214(2008).5.Bruce,P.G.,Scrosati,B.&Tarascon,J.M.Nanomaterials for rechargeablelithium batteries.Angew.Chem.Int.Ed.47,2930–2946(2008).6.Zhai,Y.et al.Carbon materials for chemical capacitive energy storage.Adv.Mater.23,4828–4850(2011).7.Tu¨ysu¨z,H.&Schu¨th,F.in Advances in Catalysis.Chapter Two Vol.55pp127–239(Academic Press,2012).8.Ren,Y.,Ma,Z.&Bruce,P.G.Ordered mesoporous metal oxides:synthesis andapplications.Chem.Soc.Rev.41,4909–4927(2012).9.Corma,A.State of the art and future challenges of zeolites as catalysts.J.Catal.216,298–312(2003).10.Liu,Y.,Zhang,W.&Pinnavaia,T.J.Steam-stable aluminosilicatemesostructures assembled from zeolite type Y seeds.J.Am.Chem.Soc.122, 8791–8792(2000).11.Meng,X.J.,Nawaz,F.&Xiao,F.S.Templating route for synthesizingmesoporous zeolites with improved catalytic properties.Nano Today4,292–301(2009).12.Lopez-Orozco,S.,Inayat,A.,Schwab,A.,Selvam,T.&Schwieger,W.Zeoliticmaterials with hierarchical porous structures.Adv.Mater.23,2602–2615(2011).13.Na,K.et al.Directing zeolite structures into hierarchically nanoporousarchitectures.Science333,328–332(2011).14.Chen,L.-H.et al.Hierarchically structured zeolites:synthesis,mass transportproperties and applications.J.Mater.Chem.22,17381–17403(2012).15.Tsapatsis,M.Toward high-throughput zeolite membranes.Science334,767–768(2011).16.Zhang,X.et al.Synthesis of self-pillared zeolite nanosheets by repetitivebranching.Science336,1684–1687(2012).17.Jiang,J.et al.Synthesis and structure determination of the hierarchicalmeso-microporous zeolite ITQ-43.Science333,1131–1134(2011).18.Zhao,Y.et al.Metal–organic framework nanospheres with well-orderedmesopores synthesized in an ionic liquid/CO2/surfactant system.Angew.Chem.Int.Ed.50,636–639(2011).19.Feng,Q.,Kanoh,H.&Ooi,K.Manganese oxide porous crystals.J.Mater.Chem.9,319–333(1999).20.Tiemann,M.Repeated templating.Chem.Mater.20,961–971(2008).21.Suib,S.L.Structure,porosity,and redox in porous manganese oxide octahedrallayer and molecular sieve materials.J.Mater.Chem.18,1623–1631(2008).22.Zheng,H.et al.Nanostructured tungsten oxide–properties,synthesis,andapplications.Adv.Funct.Mater.21,2175–2196(2011).ha,S.C.&Ryoo,R.Synthesis of thermally stable mesoporous cerium oxidewith nanocrystalline frameworks using mesoporous silica templates.Chem.Commun.39,2138–2139(2003).24.Tian,B.Z.et al.General synthesis of ordered crystallized metal oxidenanoarrays replicated by microwave-digested mesoporous silica.Adv.Mater.15,1370–1374(2003).25.Zhu,K.K.,Yue,B.,Zhou,W.Z.&He,H.Y.Preparation of three-dimensionalchromium oxide porous single crystals templated by mun.39,98–99(2003).26.Tian,B.Z.et al.Facile synthesis and characterization of novel mesoporous andmesorelief oxides with gyroidal structures.J.Am.Chem.Soc.126,865–875 (2004).27.Jiao,F.,Shaju,K.M.&Bruce,P.G.Synthesis of nanowire and mesoporouslow-temperature LiCoO2by a post-templating reaction.Angew.Chem.Int.Ed.44,6550–6553(2005).28.Rossinyol,E.et al.Nanostructured metal oxides synthesized by hard templatemethod for gas sensing applications.Sens.Actuator B Chem.109,57–63(2005).29.Shen,W.H.,Dong,X.P.,Zhu,Y.F.,Chen,H.R.&Shi,J.L.MesoporousCeO2and CuO-loaded mesoporous CeO2:Synthesis,characterization,and CO catalytic oxidation property.Micro.Meso.Mater.85,157–162(2005).30.Wang,Y.Q.et al.Weakly ferromagnetic ordered mesoporous Co3O4synthesized by nanocasting from vinyl-functionalized cubic Ia3d mesoporous silica.Adv.Mater.17,53–56(2005).31.Ren,Y.et al.Ordered crystalline mesoporous oxides as catalysts for COoxidation.Catal.Lett.131,146–154(2009).32.Jiao,K.et al.Growth of porous single-crystal Cr2O3in a3-D mesopore system.mun.41,5618–5620(2005).33.Rumplecker,A.,Kleitz,F.,Salabas,E.L.&Schu¨th,F.Hard templating pathwaysfor the synthesis of nanostructured porous Co3O4.Chem.Mater.19,485–496 (2007).34.Jiao,F.et al.Synthesis of ordered mesoporous NiO with crystalline walls anda bimodal pore size distribution.J.Am.Chem.Soc.130,5262–5266(2008).35.Ren,Y.,Armstrong,A.R.,Jiao,F.&Bruce,P.G.Influence of size on therate of mesoporous electrodes for lithium batteries.J.Am.Chem.Soc.132, 996–1004(2010).。