Diet Energy Requirements of Growing Holsteins
NRC 2012最新饲养标准

Lys Arg His Ileu Leu Met Met + Cys Phe Phe + Tyr Thr Trp Val N
Average calcium and phosphorus requirements Total calcium STTD phosphorus
d nutrient requirements will differ slighty from those presented in Tables 16-1 and 16-5. This is attributed to a t fit of nutrient requirement curves across the different body weight ranges. Calculated
Level in diet 0.29 0.35 0.04 0.26 5.1 0.13 96 3.2 0.254 82 1803 197 12 0.48 0.05 0.42 0.29 28.8 9.0 3.0 1.0 4.0 15 0.10
% % % % mg/kg mg/kg mg/kg mg/kg mg/kg mg/kg IU/kg IU/kg IU/kg mg/kg mg/kg g/kg mg/kg mg/kg mg/kg mg/kg mg/kg mg/kg μg/kg %
Starting Pigs (< 20 kg Body Weight)
Note: Estimated nutrient requirements will dif less than perfect fit of nutrient requirement cur
INPUTS: Change inputs by altering values in white cells as appropriate. Results are calculated automatically. (To restore all values to defaults, click the Enter Default Inputs button.) Mean body weight, kg Diet DE content, kcal/kg Feed intake / (feed intake + wastage) 12 3300 0.95
NRC猪营养需要量1988

猪的营养需要量(NRC 1988)(自由采食、饲料干物质含量90%)采食量和生产水平猪体重(千克)1~5 5~10 10~20 20~50 50~110 预期增重(克/日) 200 250 450 700 820预期采食量(克/日) 250 460 950 1900 3110预期效率(增重/饲料) 0.8 0.543 0.474 0.368 0.264预期效率(饲料/增重) 1.25 1.84 2.11 2.71 3.79消化能采食量(千焦/日) 3556 6527 13514 27029 44225代谢能采食量(千焦/日) 3368 6234 12929 25941 42614能量浓度(千焦代谢能/千克饲13472 13556 13598 13640 13703 蛋白质(%) 24 20 18 15 13养分需要量(%或数量/千克饲粮)必需氨基酸(%)精氨酸0.6 0.5 0.4 0.25 0.1组氨酸0.36 0.31 0.25 0.22 0.18异亮氨酸0.76 0.65 0.53 0.46 0.38亮氨酸 1 0.85 0.7 0.6 0.5赖氨酸 1.4 1.15 0.95 0.75 0.6蛋氨酸+胱氨酸0.68 0.58 0.48 0.41 0.34苯丙氨酸+酪氨酸 1.1 0.94 0.77 0.66 0.55苏氨酸0.8 0.68 0.56 0.48 0.4色氨酸0.2 0.17 0.14 0.12 0.1缬氨酸0.8 0.68 0.56 0.48 0.4亚油酸(%) 0.1 0.1 0.1 0.1 0.1养分猪体重(千克)1~5 5~10 10~20 20~50 50~110 矿物质钙(%) 0.9 0.8 0.7 0.6 0.5总磷(%) 0.7 0.65 0.5 0.5 0.4有效磷(%) 0.55 0.4 0.32 0.23 0.15钠(%) 0.1 0.1 0.1 0.1 0.1氯(%) 0.08 0.08 0.08 0.08 0.08镁(%) 0.04 0.04 0.04 0.04 0.04钾(%) 0.3 0.28 0.26 0.23 0.17铜(毫克) 6 6 5 4 3碘(毫克) 0.14 0.14 0.14 0.14 0.14铁(毫克) 100 100 80 60 40锰(毫克) 4 4 3 2 2硒(毫克) 0.3 0.3 0.25 0.15 0.1锌(毫克) 100 100 80 60 50维生素维生素A(国际单位) 2200 2200 1750 1300 1300维生素D(国际单位) 220 220 200 150 150维生素E(国际单位) 16 16 11 11 11维生素K(甲萘醌)(毫克)0.5 0.5 0.5 0.5 0.5生物素(毫克) 0.08 0.05 0.05 0.05 0.05胆碱(克) 0.6 0.5 0.4 0.3 0.3叶酸(毫克) 0.3 0.3 0.3 0.3 0.3 有效尼克酸(毫克) 20 15 12.5 10 7泛酸(毫克) 12 10 9 8 7核黄素(毫克) 4 3.5 3 2.5 2硫胺素(毫克) 1.5 1 1 1 1维生素B6(毫克) 2 1.5 1.5 1 1维生素B12(微克) 20 17.5 15 10 5种猪的营养需要量(NRC 1988)养分种用青年母猪、哺乳青年母猪成年母猪和公猪和成年母猪消化能(千焦/千克饲粮) 13975 13975 代谢能(千焦/千克饲粮) 13431 13431 粗蛋白(%) 12 13养分需要量(%或数量/千克饲粮)必需氨基酸(%)精氨酸 0 0.4组氨酸 0.15 0.25异亮氨酸 0.3 0.39亮氨酸 0.3 0.48赖氨酸 0.43 0.6蛋氨酸加胱氨酸 0.23 0.36苯丙氨酸加酪氨酸 0.45 0.7苏氨酸 0.3 0.43色氨酸 0.09 0.12缬氨酸 0.32 0.6亚油酸(%) 0.1 0.1矿物元素钙(%) 0.75 0.75总磷(%) 0.6 0.6有效磷(%) 0.35 0.35钠(%) 0.15 0.2氯(%) 0.12 0.16镁(%) 0.04 0.04钾(%) 0.2 0.2铜(毫克) 5 5碘(毫克) 0.14 0.14铁(毫克) 80 80锰(毫克) 10 10硒(毫克) 0.15 0.15锌(毫克) 50 50维生素维生素A(国际单位) 4000 2000维生素D(国际单位) 200 200维生素E(国际单位) 22 22维生素K(甲萘醌)(毫克) 0.5 0.5生物素(毫克) 0.2 0.2胆碱(克) 1.25 1叶酸(毫克) 0.3 0.3有效尼克酸(毫克) 10 10泛酸(毫克) 12 12核黄素(毫克) 3.75 3.75硫胺素(毫克) 1 1维生素B6(毫克) 1 1维生素B12(微克) 15 15:表中需要量基于玉米-----豆饼型饲粮。
雏鸡的营养标准

指标
伊莎
迪卡
罗曼
代谢能MJ/㎏
11.91
11.95
11.95
粗蛋白%
18
20
20
能量蛋白
158/1
143/1
143/1
蛋氨酸%
0.45
0.44
0.44
赖氨酸%
1.05
1.04
1.04
钙%
1.0~1.1
1.0
1.0磷%0.48源自0.50.5钠%
0.20
0.20
0.20
锰mg/㎏
雏鸡的营养标准
雏鸡的营养标准高于成年鸡,特别是蛋白质及与生长发育直接相关的赖氨酸、蛋氨酸等,应给予满足。维生素、矿物质和微量元素也必须保证充足供给。
不同品种的鸡的营养需要是有差异的,按照蛋鸡育雏期饲养标准,确定营养全面的育雏料,对雏鸡生长发育、增重、群体均匀度、提高育雏率至关重要。表1列出伊莎、迪卡、罗曼三种蛋鸡的营养需要量。
70
—
—
锌mg/㎏
55
45
45
铁mg/㎏
50
90
90
碘mg/㎏
1
0.38
0.38
铜mg/㎏
5
15
15
硒mg/㎏
0.3
0.1
0.1
钴mg/㎏
0.3
—
—
维生素A IU
15000
11000
11000
维生素D3IU
3000
3000
3000
维生素B1mg
1.0
2.5
2.5
维生素B2mg
5.0
5.0
5.0
维生素B6mg
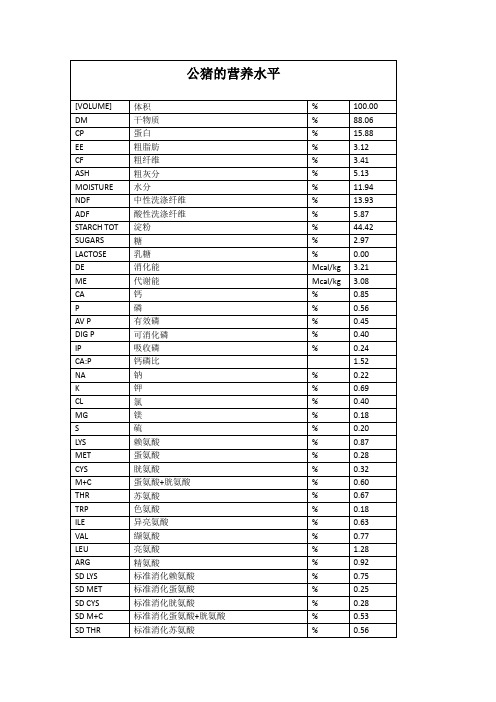
加裕公司种猪饲养标准
FE
铁
mg/kg
284.00
CU
铜
mg/kg
17.00
ZN
锌
mg/kg
170.00
MN
锰
mg/kg
34.60
CO
钴
mg/kg
0.00
SE
硒
mg/kg
0.34
I
碘
mg/kg
0.34
CR
铬
mg/kg
0.00
CAROTENE
胡萝卜素
mg/kg
0.00
VIT A
VA
UI/kg
11333.90
VIT D3
有效磷
%
0.45
DIG P
可消化磷
%
0.38
IP
吸收磷
%
0.20
CA:P
钙磷比
1.70
NA
钠
%
0.22
K
钾
%
0.79
CL
氯
%
0.41
MG
镁
%
0.17
S
硫
%
0.17
LYS
赖氨酸
%
1.15
MET
蛋氨酸
%
0.28
CYS
胱氨酸
%
0.33
M+C
蛋氨酸+胱氨酸
%
0.61
THR
苏氨酸
%
0.77
TRP
色氨酸
%
0.20
叶酸
mg/kg
1.80
VIT B12
VB12
mg/kg
0.03
VIT C
VC
奶牛脂肪肝及酮病的最新研究进展(美国瑞信胆碱Reashure )

New Insights into Fatty Liver and KetosisJames K. DrackleyDepartment of Animal SciencesUniversity of Illinois at Urbana-Champaignemail: drackley@IntroductionFatty liver and ketosis are interrelated disturbances of energy metabolism that impact dairy cows during the periparturient or transition period. The syndromes can directly decrease performance and adversely impact cow well-being; in addition, they can predispose cows to infectious diseases and other metabolic disorders. Both situations have been extensively researched during the last several decades and the scientific literature is plentiful – yet the disorders continue to plague dairy farmers worldwide. While the descriptive pathology and metabolic characteristics have been thoroughly described by these research efforts, the mechanism or mechanisms that trigger clinical disease and the cellular processes responsible for the resultant pathologies have remained elusive. Moreover, optimal management strategies for minimizing incidence and impact are still debated.Given the central importance of management to minimize metabolic disorder during the transition period in determining profitability and cow well-being, the objective of this presentation is to review some key questions. What are fatty liver and ketosis and how common are they? When and how do fatty liver and ketosis develop? How do fatty liver and ketosis affect health and productivity? What nutrition and management practices predispose to fatty liver and ketosis, and how can management prevent them? The focus will be on new information and theories surrounding development and consequences of ketosis and fatty liver, with emphasis on recent findings from our research program. For additional information, readers may refer to several comprehensive reviews on various aspects of transition cow biology and management (Drackley, 1999; Drackley et al., 2001, 2005; Grummer et al., 2004; Overton and Waldron, 2004; Drackley and Andersen, 2006; Goff, 2006; Drackley and Dann, 2008). Negative Energy Balance and the Ketosis-Fatty Liver ComplexDairy cows undergo tremendous changes during the transition from late gestation to early lactation. The fundamental driver of the physiological changes is to ensure provision of adequate nutrients for the calf, both prenatally and postnatally. Dairy production has capitalized on this metabolic drive by selecting for ever-higher milk production. After parturition, nutrient demand is not able to be met through feed intake alone because the rate of dry matter intake (DMI) increase is slower than the rate of milk energy output. As a result, the magnitude of metabolic challenge faced by modern dairy cows is almost staggering. As demonstrated in Table 1, requirements for net energy of lactation (NE L) essentially double “overnight” as cows calve and commence lactation.The fact that many cows are able to meet this challenge without difficulty speaks to the fact that the metabolic adaptations necessary to support milk production are a component of thefactors being genetically selected. The nutrient and energy deficits after parturition are met by mobilization of body reserves and by decreasing nonessential use of glucose in non-mammary tissues. Metabolic adaptations are mediated by an exquisite pattern of hormonal shifts and Table 1. Calculated net energy of lactation (NE L) requirements (Mcal/d) for dairy cows and heifers 2 days before vs. 2 days after parturition (Drackley et al., 2005).1600-lb cow 1250-lb heifer Function Pre-fresh Fresh Pre-fresh Fresh Maintenance 11.2 10.1 9.3 8.5 Pregnancy 3.3 --- 2.8 --- Growth --- --- 1.9 1.7 production --- 18.7 --- 14.9 MilkTotal 14.5 28.8 14.0 25.1Calculated from NRC (2001). Assumes precalving body weight with average decreasefor calf and fluid loss at calving, milk production of 55 lb/d for cow and 45 lb/d forheifer, each containing 4% fat.factors being genetically selected. The nutrient and energy deficits after parturition are met by mobilization of body reserves and by decreasing nonessential use of glucose in non-mammary tissues. Metabolic adaptations are mediated by an exquisite pattern of hormonal shifts and changes in tissue responsiveness to those hormones. For example, growth hormone (GH) is increased around parturition and in early lactation (Grum et al., 1996), which increases responsiveness of adipose tissue to lipolytic signals such as norepinephrine and decreases sensitivity of insulin-dependent tissues to the action of insulin, whose concentration also decreases because of negative energy balance (NEB). The resulting increase of nonesterified fatty acids (NEFA) from adipose tissue are used as alternate fuels for much of the rest of the body, and are also converted by the liver to ketone bodies. The ketones serve as alternate water-soluble fuels that can replace glucose in many tissues, thus conserving glucose for milk synthesis.While a majority of cows are able to weather the metabolic challenges associated with initiation of milk synthesis, the fact that, on average, roughly 1 in 2 cows succumbs to some health problem during the transition period (Ferguson, 2001) underscores the fragility of the system. The etiology of most of the periparal health disorders is directly or indirectly associated with NEB (Drackley et al., 2005). Increasingly strong evidence indicates that clinical and subclinical ketosis and fatty livers are key underlying factors in development of other earlylactation disorders and disease (Duffield, 2000; Bobe et al., 2004), as well as impaired fertility (Rukkwamsuk et al., Walsh et al., 2007a,b).Metabolic Changes during the Transition PeriodAs calving approaches, concentrations of progesterone in blood decrease and those of estrogen remain high or increase (Grummer, 1995). The high circulating estrogen may be one factor that contributes to decreased DMI around calving (Grummer, 1993). During the last 3 wk of pregnancy, nutrient demands by the fetal calf and placenta are at their greatest (Bell, 1995). At the same time, depending on diet composition, DMI may be decreased by 10 to 30% compared with intake during the early dry period. This in itself may not be cause for alarm, as decreased food or feed intake around parturition is a common finding in many mammalian species (Friggens, 2003). Maintaining good appetites through and after calving are likely more important.Cows are unable to consume sufficient energy-yielding nutrients from voluntary DMI after calving to meet energetic requirements for milk production. Consequently, a state of NEB almost always occurs for a period of days to weeks in early lactation. Postpartal NEB clearly results from initiation of milk synthesis because mastectomy before parturition greatly blunts the increased concentration of NEFA released from adipose tissue at and after calving (Goff et al., 2002). However, the degree of NEB in individual cows is poorly related to milk production, or more correctly, milk energy secretion. The depth and duration of NEB is highly related to DMI (Zurek et al., 1995; Drackley et al., 2005), and thus factors that impact appetite and consumption of feed after calving are critical.Like most mammals, a number of physiological adaptive mechanisms are invoked to allow the cow to cope with the challenges induced by NEB. Cows mobilize stored triglycerides (TG) in adipose tissues as an energy supply for milk production and maintenance functions. Glycerol released from lipolysis is used by the liver for glucose synthesis in the pathway of gluconeogenesis. The fatty acids released circulate as NEFA and are distributed with blood flow to all body tissues (Drackley et al., 2001). When NEFA concentrations are elevated during early lactation, the mammary gland takes them up efficiently and converts them to milk fat. High milk fat concentrations, or high milk ratios of fat to protein, are useful as indicators of ketosis in dairy cows.The liver receives about 1/3 of all blood flow from the heart. Consequently, the liver is flooded with NEFA when blood concentrations increase around calving. The liver takes up NEFA in proportion to their concentration in blood. Within liver cells, NEFA can be 1) oxidized to carbon dioxide with the generation of ATP for the liver’s energy needs, 2) partially oxidized to the ketone bodies β-hydroxybutyrate (BHBA) and acetoacetate, which results in ATP for the liver and water-soluble energy sources for muscle and heart, or 3) re-converted to TG. Because ruminant animals are unable to effectively export TG out of the liver as very-low density lipoproteins, TG can accumulate and cause fatty liver. Increased ketone body production, which occurs when carbohydrate (glucose) supply is limited during NEB, can result in ketosis (Drackley et al., 2001).Metabolic adaptations in carbohydrate and protein metabolism also occur around calving (Drackley et al., 2001, 2005). Low insulin concentrations result in decreased oxidative use of glucose by peripheral tissues, thereby sparing glucose for milk synthesis. In the liver, the efficiency of gluconeogenesis from propionate increases after parturition. Glucose synthesis from glycerol and glucogenic amino acids such as alanine increases around parturition to meet the glucose demand that cannot be supplied by propionate due to low DMI. Body protein mobilization increases during the first 3 weeks postpartum to supply amino acids for both milk protein synthesis and glucose synthesis. In practical terms, this emphasizes the importance of dietary provision of metabolizable protein. Lack of response in milk production to increased rumen-undegradable protein supplementation, except in first-calf heifers (Van Saun et al., 1993; Santos et al., 2001), has been common in the literature (see Bell et al., 2000) and in our own experience (Underwood et al., 2001). Nevertheless, the importance of maintenance of maternal stores of protein on long-term health, productivity, and reproduction is backed by strong indirect evidence (Bell et al., 2000).The onset of milk synthesis creates a large drain on the blood pool of free calcium, resulting in sometimes-marked decreases in blood calcium concentration. Hypocalcemia can be classified as subclinical (blood Ca between 8 and 5.5 mg/dL) or clinical. While the incidence of clinical hypocalcemia or milk fever is low, subclinical hypocalcemia is much more prevalent and insidious. Subclinical hypocalcemia is associated with decreased smooth muscle function, which manifests as decreased motility of the rumen and abomasum (which increases risk of displaced abomasum) and decreased contraction of the teat sphincter, thus increasing risk of mastitis (Goff, 2006). Decreased feed intake (thus increasing risk of subclinical ketosis) and decreased immune cell function also result from hypocalcemia (Kimura et al., 2006). Because of these widespread effects of hypocalcemia and the decrease in smooth muscle function in the uterus, reproductive performance may be impaired.Hypocalcemia is usually assessed by sampling blood during the first 24 hours after calving, when blood Ca is at its nadir. Hypocalcemia can persist during the first several days postpartum, which can contribute to sluggish starts to lactation and increased incidence of secondary health problems such as ketosis and fatty liver. Until the ability of the digestive tract to absorb calcium can increase, calcium must be obtained by breaking down bone. Metabolic acidosis caused by a negative dietary cation-anion difference (DCAD) favors mobilization of calcium from bone, whereas high dietary potassium concentrations and positive DCAD suppress this process (Horst et al., 1997).Metabolic adaptations are directed by endocrine and central nervous system controls that to some (as yet unknown) extent monitor and respond to the degree of NEB (Drackley et al., 2001, 2005). Major endocrine changes include increased secretion of somatotropin, decreased insulin and insulin-like growth factor-1 (IGF-1), and increased glucagon. Lipolysis in adipose tissue is stimulated mainly by the sympathetic nervous system in the presence of low insulin concentrations. The sympathetic nervous system responds to energy shortage or chronic stressors with greater activity. Although stressors and severe limitations in DMI can lead to NEB before calving, the degree is much less than the severe NEB that can occur following parturition. Severe or prolonged NEB can lead to increased TAG deposition in liver, increasedketone bodies such as BHBA and acetoacetate in blood, and depletion of body reserves of energy (largely fat) and protein.Function of the immune system also is depressed during the transition period (Mallard et al., 1998). The degree of immunosuppression seems to be greater in overconditioned cows (Lacetera et al., 2005) and in cows with fatty liver (Bobe et al., 2004). Decreased ability of the immune system to respond to infectious challenges likely is responsible for the high incidence of environmental mastitis around calving, as well as the high incidence of metritis. Reasons for the decreased immune function are not well understood. Vitamins A and E as well as a number of the trace minerals (selenium, copper, zinc) play a role in enhancing immune function. Recent evidence suggests that NEB or negative protein balance may be a major contributing factor (Goff, 1999). This finding relates well to the common observation that cows which seem to be the most stressed by nutrition and environmental factors, as judged by excessive loss of body condition, are the most likely to become ill. In particular, an inadequate supply of metabolizable protein has been related to impaired function of the immune system (Houdijk et al., 2001). Recent evidence linking retained placenta to a malfunction of the immune system (Kimura et al., 2002) suggests that protein nutrition also might impact the incidence of retained placenta.Fatty liverFatty liver is defined as an accumulation of TG (the same kind of fat as found in adipose tissue, milk fat, or vegetable oils) in the liver. Fatty liver does not occur when cows are in positive energy balance and gaining weight because the liver is not a place of storage for fat like the adipose or fat tissues throughout the body (backfat, organ fat, etc.). Dietary fats provided from oilseeds such as canola or soybeans, animal fats, or commercial fat supplements are handled by the cow differently than NEFA and largely bypass the liver. In situations where milk fat is depressed by feeding excessive supplemental fats and oils perhaps with monensin, the decreased milk fat results mainly from inhibition of fatty acid synthesis in the udder by CLA and other trans-fatty acids produced in the rumen. Therefore, there should be little concern about dietary fats or milk fat-depressing diets leading to fatty liver development.While the technical name is “hepatic lipidosis”, it is also called “fatty liver syndrome”, “fat cow syndrome”, or “lipomobilization syndrome”. The term “fatty liver syndrome” is probably the best name because it indicates that many other organ systems are affected besides the liver. Fatty liver is caused by excessive uptake of nonesterified fatty acids (NEFA) mobilized from body fat (adipose tissues) in response to NEB. All cows go through some degree of NEB after calving, and essentially all cows have body fat to mobilize. Thus, all cows are at risk for developing fatty livers, even those in thin body condition. However, overconditioning certainly is a major risk factor for development of fatty livers, because fat cows do not eat as well as thinner cows and easily break down body fat to NEFA.Fatty liver usually develops after calving, with peak incidence at about 10 days in milk (Figure 1). One research study from Michigan State University found that cows which developed severe fatty livers after calving actually had significant fat accumulation in the liver during the last 3 wk before calving. However, no other studies have confirmed this pre-calving fatty liver. Fatty liver can develop quickly after calving. Estimates of rates of body fatbreakdown and liver conversion of NEFA to triglyceride indicate that a severe fatty liver could develop within one to two days after calving (Drackley et al., 2001).Unfortunately, there are no reliable methods for diagnosis of fatty liver except for liver biopsy. Ultrasound techniques are being developed but are not yet reliable. Determination of liver TG content by small-needle biopsy is a useful and accurate indicator of the degree of metabolic disturbance faced by individual cows (Jorritsma et al., 2001). Biopsies obtained between 8 and 14 days postpartum are most useful in classifying cows. Liver lipid content can be estimated microscopically as the volume of hepatocytes occupied by lipid or chemically as the concentration of TG (Table 2). Concentrations of TG <5.0% and 5.0 to <10.0% are classified as mild and moderate fatty liver, respectively, whereas severe fatty liver is considered to be >10.0% TG (Gaal et al., 1983). Severe fatty liver likely is the only form that is clinically relevant (Gerloff et al., 1986), although moderate fatty liver is also associated with greater incidences of disease and impaired reproduction (Rukkwamsuk et al., 1999; Jorritsma et al., 2000). Surveys indicate that between 25% and 65% of cows have moderate or severe fatty liver in the first weeks after calving (Bobe et al., 2004). Measurement of glycogen in liver in addition to TG increases the usefulness of the information, as concentrations of TG and glycogen vary inversely during the early postpartum period (Figure 1; Drackley et al., 2005). However, liver biopsy is an invasive and time-consuming process, and analytical determination of TAG and glycogen is not well-adapted to rapid testing.Table 2. Classification of fatty liver by concentration of triglyceride(TG) or by cell volume occupied by lipidCategory TG (% wet liver) Proportion of volume as lipidNormal healthy <1.0 <0.05Mild fatty liver 1.0 – 5.0 0.05 - 0.20Moderate fatty liver 5.0 – 10.0 0.20 - 0.40Severe fatty liver >10.0 >0.40Maintaining optimal liver function is central to the ability of cows to make a smooth transition into heavy milk production. As the degree of fatty infiltration increases, normal functions of the liver are affected adversely. Cows with fatty liver have a greater degree of immune suppression around calving (Bobe et al., 2004), which may make them more susceptible to developing infectious diseases such as mastitis and metritis. Severe fatty liver usually appears as part of a multi-factor disease complex. Fat infiltration impairs the ability of the liver to detoxify ammonia to urea (Strang et al., 1998). Ammonia decreases the ability of the liver to convert propionate to glucose (Overton et al., 1999), thus linking fat accumulation to impaired gluconeogenesis in liver (Drackley et al., 2001).Fatty liver also impairs the ability of the liver to detoxify endotoxin, and thereby renders the cow extremely sensitive to endotoxic shock and death (Andersen et al., 1996). In severe fatty liver, normal functions of the liver are severely depressed, which results in the condition of "fatty liver syndrome" or "clinical fatty liver" (Morrow, 1976). Feed intake and carbohydrate status ofthe cow are important in determining the extent of body fat mobilization, fatty liver, and ketone body production in the liver. Fat infiltration per se evidently does not lead to liver failure (Rehage, 1996) but may be a contributing factor at least in some circumstances.Figure 1. Concentrations of total lipid, triacylglycerol (triglyceride), and glycogen in liver during the periparturient period. (From Drackley et al., 2005)Fatty liver is negatively associated with fertility (Rukkwamsuk et al., 1999). This association may be an indirect effect of the extreme NEB that exists in these cows. However, there also may be direct negative effects of hepatic lipid infiltration on reproduction. Blood flow through the liver may be altered by fat accumulation expanding cell volume and compressing hepatic sinusoids. Alternately, lipid accumulation may decrease the ability of the liver to metabolize or clear reproductive hormones, thus altering the normal signaling to reproductive tissues and the pituitary.While effects of fatty liver per se on milk production are less clear, overall the evidence for impairment of dairy cow health and productivity is strong.KetosisOriginal research summarized by Kronfeld (1982) resulted in his classification of ketosis in dairy cows into four types: 1) primary underfeeding ketosis – results because “the cow is not offered enough acceptable feed,” 2) secondary underfeeding ketosis – results because “the cow’svoluntary feed intake is diminished by disease,” 3) alimentary or ketogenic ketosis – results because “the cow is consuming excessive amount of highly ketogenic feed,” and 4) spontaneous ketosis – results under a condition when the diet appears nutritionally adequate. More recently, reference to type I and type II ketosis has been made (Holtenius and Holtenius, 1996), which appears to be a much more functional differentiation in modern dairy production (Herdt, 2000a). Type I ketosis, also known as spontaneous ketosis, occurs when the demand for glucose is greater than the liver capacity for gluconeogenesis (Herdt, 2000a). This occurs when the supply of glucose precursors is limiting for maximal glucose production when the gluconeogenic pathways are at maximal capacity (Herdt, 2000a). During type I ketosis, concentrations of glucose and insulin in blood typically are low, the insulin to glucagon ratio low, concentrations of blood ketones are elevated, a high rate of mitochondrial uptake of NEFA exists, and severe fatty liver is absent (Herdt, 2000a).Fatty liver is characteristically associated with so-called “type II ketosis”. Type II ketosis occurs when large amounts of NEFA are delivered to the liver when gluconeogenesis and ketogenesis are not maximally stimulated (Herdt, 2000a). Holtenius and Holtenius (1996) suggest that type II ketosis is associated with hyperglycemia, hyperinsulinemia prior to clinical signs, insulin resistance, lower concentrations of ketone bodies in blood, and higher concentrations of glucose in blood than in type I ketosis. This is the type of ketosis that that results from overfeeding during the dry period and having overconditioned cows that are set up for liver function impairment due to their high depression of DMI around calving. Ketogenic grass silages that contain large amounts of butyric acid may be a contributing factor to fatty liver development as well as butyric acid (alimentary) ketosis.The reported prevalence of ketosis varies among farms worldwide. Over the last 10 years, ketosis (particularly type II) has become the number one reason for farm consultations by the University of Wisconsin clinical veterinary staff (G. Oetzel and K. Nordlund, personal communication, 2007). Duffield (2000) reported that subclinical ketosis prevalence worldwide varied from 8.9% to 34% for cows during the first two months of lactation. Clinical ketosis prevalence was lower and varied from 2% to 15%. Both subclinical and clinical ketosis result in economic losses for dairy producers due to decreased milk yield and poorer reproductive performance. Cows with clinical ketosis had a loss of milk of 2.5 to 3.5 kg/d in the month following diagnosis, 0.3 to 0.7 kg/d during the following month, and no long-term loss of milk (Fourichon et al., 1999). Cows with clinical ketosis had more days to first service, a lower conception rate, and increased days open (Fourichon et al., 2000).Primary ketosis can be either subclinical or clinical (Baird, 1982). Clinical signs include decreased appetite, decreased milk production, loss of BW, hypoglycemia, and hyperketonemia. Ketone bodies (BHBA and acetoacetate) are found in blood, milk, and urine. Subclinical ketosis is diagnosed at serum BHBA concentrations above 10.4 mg/dL (1000 µmol/L) and clinical ketosis is diagnosed at BHBA concentrations above 27 mg/dL (2600 µmol/L; Duffield, 2000). Duffield (2000) pointed out that the values used to set the threshold for subclinical ketosis are arbitrary and that clinical signs of ketosis can occur with a large range of serum BHBA concentrations.Triggers for Clinical DiseaseAn age-old question and problem in the study of ketosis and fatty liver is why some cows eventually go on to develop signs and clinical pathology whereas others do not, despite roughly similar clinical biochemistry values (i.e., serum NEFA and BHBA concentrations, etc.). One of the most exciting recent areas of research is the study of gene expression in liver, using “microarray” techniques. These procedures allow quantification of the mRNA expression of thousands of gene sequences simultaneously on a microscope slide-sized glass plate. We have conducted several studies that have provided new insights into the molecular mechanisms of ketosis and fatty liver development, as well as the potential triggers for clinical disease (Loor et al., 2005, 2006, 2007).Briefly, we have uncovered evidence for several potential disease-causing mechanisms in cows subjected to a feed restriction protocol to induce ketosis in early lactation (Dann et al., 2005; Loor et al., 2007). These cows had elevated BHBA concentrations in blood and increased TG in liver, typical of ketosis. The theme areas for which evidence was obtained for impaired liver cellular functions included: 1) down-regulation of genes responsive to oxidative stress (e.g., SOD1, ATOX1, PRDS2, GLRX, GSTA4, et al.), but increase of potential sources of oxidants (e.g., ACOX1, UCP1); 2) up-regulation of genes indicating enhanced DNA fragmentation and apoptosis; 3) blunted repair response to DNA damage; 4) down-regulation of components of oxidative phosphorylation, suggesting that the liver’s ability to generate ATP for its functions eventually may be impaired; 5) down-regulation of enzymes in cholesterol synthesis (e.g., HMGCR), which may impair VLDL export and contribute to greater TG accumulation; 6) down-regulation of growth hormone signaling mechanism (e.g., GHR, IFG1, SOCS2), which may disrupt normal homeostatic and homeorhetic controls; 7) down-regulation of ubiquinone synthesis and ubiquitination activity, which are involved in targeting damaged or aberrant proteins for degradation; and 8) down-regulation of components of the immune system.Our working hypothesis in this line of investigation, then, is that as the pathophysiology of NEB continues and worsens, clinical disease eventually is triggered when accumulative cell damage in liver and other tissues prevents maintenance of homeostasis. Key functions that are compromised may include mitochondrial energy status, accumulation of aberrant proteins that cannot be properly cleared, and induction of apoptosis (programmed cell death).Risk Factors for Fatty Liver and KetosisSeveral factors increase the likelihood of cows developing fatty livers and ketosis. Among these may be individual herd-specific factors, parity, body condition score, genetics, and season (Duffield, 2000; Bobe et al., 2004). As mentioned earlier, overconditiong is a clear risk factor. Cows with long calving intervals or long dry periods thus may be at greater risk. Even cows that are not overconditioned but are fed diets too rich in energy for long periods in the dry period are at greater risk to develop fatty livers after calving than are cows fed to meet their requirements during the dry period.An interesting risk factor identified in recent studies is that DMI and feeding behavior during the last 2 weeks before calving are highly predictive of health problems in individual。
猪的能量需要量

猪的能量需要量1.维持需要(MEm)维持代谢能需要(EMm)包括维持机体所有功能和适度活动所需能量。
MEm通常以代谢体重(BW0.75)为基础表示。
每千克代谢体重代谢能需要量估测范围不每日418.4―523KJME/kgBW0.75,平均为每日443.5KJME/kgBW0.75,相当于460KJDE/kgBW0.75。
妊娠期间,能量需要量的60%-80%用于维持。
NRC(1988)根据所得到的有关文献,总结出妊娠母猪每天每千克代谢体重维持能量需要量为443.5kJME或460kJDE。
Beyer等(1994)根据文献报道所总结出的资料表明随着胎次增加,母猪维持能量需要量增高,第一胎每日389KJME/kgBW0.75,第二胎每日435KJME/kgBW0.75,第四胎每日473KJME/kgBW0.75。
泌乳母猪每日维持需要量为460kJDE/kgBW0.75,与妊娠母猪相同。
但有些建议哺乳母猪应比妊娠母猪高5%-10%。
国内多用每日502kJDE/kgBW0.75。
根据文献报道,对于生长猪,似乎每日维持能量需要量按460kJDE/kgBW0.75计算较适宜。
2.生长需要蛋白质存留所需能量范围为39.71-61.9MJDE/kg,平均为52.72MJDE/kg。
用于沉积脂肪的估计值为39.75―68.20MJDE/kg,平均值为52.3MJDE/kg。
从数字看沉积蛋白质和脂肪所需能值差不多,但lkg瘦肉组织只含20%-23%的蛋白质,而1kg脂肪组织含80%-95%的脂肪。
因此肌肉沉积消耗的能量比脂肪沉积耗能少得多。
3.妊娠需要妊娠母猪饲料和能量需要量因体重、妊期目标体重增重及其他管理和环境因素而异。
综述妊娠期能量采食量对母猪增重和繁殖性能的影响,建议经产母猪妊娠期中总增重为45千克,其中母体净增重25千克,妊娠产物(胎儿、羊水等)约为20千克。
妊娠母猪的能量需要,近30年来有趋于下降趋势。
从1950年每日需DE37.67―46.88MJ下降到26.37MJ。
罗曼粉蛋鸡的营养标准
罗曼粉蛋鸡的营养标准
罗曼粉蛋鸡是一种特殊品种的鸡,其营养需求可能与普通鸡有所不同。以下是一般情况下鸡 的营养需求,但具体的罗曼粉蛋鸡的营养标准可能需要参考该品种的专门研究或生产指南。
1. 蛋白质:蛋白质是鸡体生长和蛋生产的重要营养物质。成年鸡的蛋白质需求量通常为1618%,蛋鸡的蛋白质需求量可能更高。
5. 维生素和矿物质:鸡体需要适量的维生素和矿物质来等,常见的矿物质包括钙、磷、铁等。
请注意,以上是一般情况下鸡的营养需求,具体的罗曼粉蛋鸡的营养标准可能会有所不同 。建议根据具体情况参考相关的专门研究或生产指南,以确保罗曼粉蛋鸡获得适当的营养供 给。
2. 能量:能量是鸡体维持生命活动和生产的重要来源。通常以代谢能(ME)或总能量(GE )来衡量。蛋鸡的能量需求与生产阶段、环境温度等因素有关。
罗曼粉蛋鸡的营养标准
3. 碳水化合物:鸡体对碳水化合物的需求相对较低,但适量的碳水化合物可以提供能量。
4. 脂肪:脂肪是鸡体的能量储备物质,对于蛋鸡来说,适量的脂肪摄入可以促进蛋的形成 和产量。
猪各个阶段的营养需求标准
猪各个阶段的营养需求标准
1. 婴猪阶段(出生-21天)
主要需求:乳糖、蛋白质、脂肪、酪蛋白、防病毒成分等
2. 断奶仔猪阶段(21天-10周龄)
主要需求:高蛋白、易消化、低纤维饲料,维生素和矿物质
3. 生长猪阶段(10周龄-市场质量)
主要需求:高蛋白、适量脂肪、低纤维饲料,良好的矿物质(钙、磷、镁、硒、锌、铜、铁)含量
4. 繁殖母猪阶段
主要需求:良好的能量来源,高蛋白含量,良好的矿物质,维生素(尤其是维生素E),多种抗氧化物质(如硒、β-胡萝卜素等)
5. 开始哺乳期母猪阶段
主要需求:高蛋白、高能量含量,防止钙、磷、镁、铁等矿物质的不足,维生素(特别是B族维生素和叶酸)和抗氧化剂(如硒、维生素E等)的补充。
5美国NRC猪的营养需要(1998)
NRC(1998)第十版猪营养需要量表(美国,摘编)编者按:众所期待的 NRC<<猪的营养需要量>>(第十版)已于1998年初正式出版,为使其更快地被我国同行利用、参考,本刊摘译刊出其精髓参数部分,以读者。
NRC (1998)猪营养需要量表涉及仔猪、生长-肥育猪、妊娠母猪和泌乳母猪以及种公猪日粮中和每天对能量、氨基酸、维生素、矿物质和亚油酸的需要量。
其中氨基酸的需要量以回肠真可消化氨基酸、回肠表观可消化氨基酸和总氨基酸三种形式表述,其中前两者适用于所有类型的日粮,后者仅适用于玉米-豆粕型日粮。
表中所列各种类型猪对氨基酸的需要量仅是一个例子。
读者可以根据自己的实际情况(猪的瘦肉生长速度、采食量、日粮能量浓度、环境温度和饲养密度等),用各种模型(生长、妊娠、泌乳)确定适合当地条件的需要量。
矿物质和维生素的需要量包括饲料原料中的含量,而不是指需要额外添加的量。
它们是在一般的条件下,中等生产性能的猪的最适量,用模型进行推算所得结果可能会与表中所列情况略有出入。
表中所给的数值均是在适宜下的最低需要量,不包括安全系数。
实际生产中应结合饲料原料中养分的变异、养分的生物学效价、饲料毒素和抗营养因子、饲料配制和加工、储存中的养分损失等情况确定养分的供给量。
索引1、表1.生长猪日粮氨基酸需要量(自由采食、日粮含90%干物质)a2、表2.生长猪每天氨基酸需要量(自由采食、日粮含90%干物质)a3、表3.瘦肉生长速度不同的阉公猪和母猪日粮氨基酸需要量(自由采食,日粮含90%干物质)a4、表4.瘦肉生长速度不同的阉公猪和母猪每日氨基酸需要量(自由采食,含粮含90%干物质)a5、表5 生长猪日粮矿物质、维生素和亚油酸需要量(自由采食,日粮含90%干物质)a6、表6 生长猪每天矿物质、维生素和亚油酸需要量(自由采食,日粮含90%干物质)a7、表7 妊娠母猪日粮氨基酸需要量(日粮含90%干物质)a8、表 8. 妊娠母猪每天氨基酸需要量(日粮含90%干物质)a9、表 9. 妊娠母猪每天氨基酸需要量(日粮含90%干物质)10、表 10. 泌乳母猪每天氨基酸需要量(日粮含90%干物质)a11、表 11 妊娠和泌乳母猪日粮中矿物质、维生素和亚油酸的需要量(日粮含90%的干物质)a12、表 12 妊娠和泌乳母猪日粮中每天矿物质、维生素和亚油酸的需要量(日粮含90%干物质)a13、表13.种公猪配种期日粮和每天氨基酸、矿物质、维生素和亚油酸需要量(日粮含90%干物质)a表1.生长猪日粮氨基酸需要量(自由采食、日粮含90%干物质)a──────────────────────────────────────体重(kg)指标单位──────────────────────────3-5 5-10 10-20 20-50 50-80 80-120──────────────────────────────────────平均体重 kg 4 7.5 15 35 65 100消化能 kcal/kg 3400 3400 3400 3400 3400 3400代谢能 kcal/kgb 3265 3265 3265 3265 3265 3265消化能进食量 kcal/day 855 1690 3400 6305 8760 10450代谢能进食量 kcal/day 820 1620 3265 6050 8410 1003采食量 g/d(%) 250 500 1000 1855 2575 3075粗蛋白 (%)c 26.0 23.7 20.9 18.0 15.5 13.2──────────────────────────────────────回肠末端真可消化氨基酸需要量d──────────────────────────精氨酸 (%) 0.54 0.49 0.42 0.33 0.24 0.16 组氨酸 (%) 0.43 0.38 0.32 0.26 0.21 0.16 异亮氨酸 (%) 0.73 0.65 0.55 0.45 0.37 0.29 亮氨酸 (%) 1.35 1.20 1.02 0.83 0.67 0.51 赖氨酸 (%) 1.34 1.19 1.01 0.83 0.66 0.52 蛋氨酸 (%) 0.36 0.32 0.27 0.22 0.18 0.14 蛋+胱 (%) 0.76 0.68 0.58 0.47 0.39 0.31 苯丙氨酸 (%) 0.80 0.71 0.61 0.49 0.40 0.31 苯丙+酪氨酸 (%) 1.26 1.12 0.95 0.78 0.63 0.49 苏氨酸 (%) 0.84 0.74 0.63 0.52 0.43 0.34 色氨酸 (%) 0.24 0.22 0.18 0.15 0.12 0.10 缬氨酸 (%) 0.91 0.81 0.69 0.56 0.45 0.35 ──────────────────────────────────────回肠末端表观可消化氨基酸需要量──────────────────────────精氨酸 (%) 0.51 0.46 0.39 0.31 0.22 0.14 组氨酸 (%) 0.40 0.36 0.31 0.25 0.20 0.16 异亮氨酸 (%) 0.69 0.61 0.52 0.42 0.34 0.26 亮氨酸 (%) 1.29 1.15 0.98 0.80 0.64 0.50 赖氨酸 (%) 1.26 1.11 0.94 0.77 0.61 0.47 蛋氨酸 (%) 0.34 0.30 0.26 0.21 0.17 0.13 蛋+胱 (%) 0.71 0.63 0.53 0.44 0.36 0.29 苯丙氨酸 (%) 0.75 0.66 0.56 0.46 0.37 0.28 苯丙+酪 (%) 1.18 1.05 0.89 0.72 0.58 0.45 苏氨酸 (%) 0.75 0.66 0.56 0.46 0.37 0.30 色氨酸 (%) 0.22 0.19 0.16 0.13 0.10 0.08 缬氨酸 (%) 0.84 0.74 0.63 0.51 0.41 0.32 ──────────────────────────────────────总氨基酸需查量c──────────────────────────精氨酸 (%) 0.59 0.54 0.46 0.37 0.27 0.19 组氨酸 (%) 0.48 0.43 0.36 0.30 0.24 0.19 异亮氨酸 (%) 0.83 0.73 0.63 0.51 0.42 0.33 亮氨酸 (%) 1.50 1.32 1.12 0.90 0.71 0.54 赖氨酸 (%) 1.50 1.35 1.15 0.95 0.75 0.60 蛋氨酸 (%) 0.40 0.35 0.30 0.25 0.20 0.16 蛋+胱 (%) 0.86 0.76 0.65 0.54 0.44 0.35 苯丙氨酸 (%) 0.90 0.80 0.68 0.55 0.44 0.34 苯丙+酪 (%) 1.41 1.25 1.06 0.87 0.70 0.55 苏氨酸 (%) 0.98 0.86 0.74 0.61 0.51 0.41 色氨酸 (%) 0.27 0.24 0.21 0.17 0.14 0.11 缬氨酸 (%) 1.04 0.92 0.79 0.64 0.52 0.4 ──────────────────────────────────────注: a 公母按1:1混养,从20~120kg体重,每天沉积无脂瘦肉325g;b 消化能转化为代谢能的效率为96%,在本表中所列玉米-豆粕型日粮的粗蛋白条件下,消化能转化为代谢能的效率为94~96%;c 本表中所列粗蛋白含量适用于玉米-豆粕型日粮,对于采食含血浆或奶产品3~ 10kg仔猪,粗蛋白水平可以降低2~3%;d 总氨基酸的需要量基于以下日粮:3~5kg仔猪,玉米-豆粕日粮,含5%的血浆制品和25~50%的奶制品;5~10kg仔猪,玉米-豆粕日粮含5~25%的奶制品; 10~120kg生长猪,玉米-豆粕型日粮;e 3~20kg体重猪的总赖氨酸需要量是根据经验数据计算出来的,其它氨基酸是根据它们和赖氨酸的比例(真可消化基础)计算出来的,不过也有极个别数据是通过经验数据估算出来的;20~120kg体重猪的氨基酸需要量是通过生长模型计算出来的。
乳猪阶段营养标准
乳猪阶段营养标准
乳猪阶段(出生至断奶后20天)的营养标准包括能量、蛋白质、氨基酸、维生素和微量元素等。
在我国当前饲养条件下,哺乳阶段乳猪和断奶后10到20天的仔猪共用乳猪配合饲料,蛋白质含量19%-21%,消化能3400千卡/公斤较为合适。
以下为乳猪阶段饲粮的营养需要量(以NRC 1998为标准):
1.采食量:5到10公斤的乳猪,每500克体重所需的饲粮量为1000克;10-20公斤的乳猪,每500克体重所需的饲粮量为800克。
2. 营养成分:
能量:消化能,3400千卡/公斤。
蛋白质:粗蛋白质,23.7%-20.9%。
氨基酸:赖氨酸1.35%-1.15%。
维生素和微量元素:按需要量添加。
需要注意的是,乳猪的饲料营养应平衡、全面、含量高,以满足其生长发育需要。
能量和蛋白质的摄入尤为重要,因为仔猪的增重在很大程度上取决于能量的供给。
此外,还要根据乳猪的生长发育和市场需求选择合适的饲料类型和配方。
1。
- 1、下载文档前请自行甄别文档内容的完整性,平台不提供额外的编辑、内容补充、找答案等附加服务。
- 2、"仅部分预览"的文档,不可在线预览部分如存在完整性等问题,可反馈申请退款(可完整预览的文档不适用该条件!)。
- 3、如文档侵犯您的权益,请联系客服反馈,我们会尽快为您处理(人工客服工作时间:9:00-18:30)。
1998JDairySci81:840–845840ReceivedJuly16,1996.AcceptedMay13,1997.
DietEnergyRequirementsofGrowingHolsteinsD.E.JOHNSONandG.BERNALDepartmentofAnimalScience,ColoradoStateUniversity,FortCollins80523
ABSTRACTTheconceptualbasesofrecentNRCpublicationsofnutrientrequirementstomeetdietaryenergyneedsofgrowingHolsteins,emphasizingheifersgaining0.75kg/d,aredescribedandcomparedwithseveralworldsystemsandwithbodycompositiondata.Re-quirementsofHolsteinsfornetenergyformain-tenancearegenerallythoughttobehigher(from7to20%)thanthoseofBritishbeefbreeds.Totalesti-matesofmetabolizableenergyrequirementsarequitesimilarformostenergysystemsforcattleat200to400kgofbodyweight.Forheaviercattle,theenergydensityestimatesbasedonbeefbreedequationsprojecthighermetabolizableenergyforgainandtotalmetabolizableenergyrequirements.ExtrapolationsfromthechemicalcompositionofgrowingHolsteinheifersindicatethat,attheslowergrowththatistypicalofreplacements,energydensitiesarelowerthanformorerapidlygrowingheifersandthatnetenergyrequirementsareconsistentwithcurrentUSstandards.(Keywords:energyrequirements,bodycomposition,growingHolsteins)
Abbreviationkey:ADG=averagedailygain,eBW=emptyBW,MBW=matureBW,ME=metaboliza-bleenergy,MEm=MEformaintenance,NEg=net
energyforgain,NEm=netenergyformaintenance,
sBW=shrunkBW.
INTRODUCTIONForprovisionofdietaryneeds,awiderangeoffactorsmustbeconsideredthataffectrequirementsformaintenanceandtissuedeposition.Factorsin-cludetheuniqueHolsteingenotypeand,fordevelop-ingheifers,requirementsforslowtomoderateratesofgrowth.Severalmethodstodescribetheseneeds,particularlyforHolsteinheifersgrowingat0.75kg/d,arecomparedwithNRC(13)recommendations.Tis-suedepositionrequirementsarecomparedwiththeenergydensitiesdeterminedbychemicalcompositionofgrowingHolsteins.
GrowthRateofDevelopingHeifersTherearingofdairyreplacementsneedstocon-sidertheheifer,thefetus,andthemammarygland.Asthemetabolizableenergy(ME)intakeofheifersincreases,theageatonsetofpubertydecreases.Howeverhighenergyintakesduringtheprepubertalperiodcanlowerweightsofmammarysecretorytis-sue,lowerDNAcontents(16),andhavenegativeeffectsonyieldsoffirstandsubsequentlactations(11,15).Heifersfedtogain≥1000g/dhadmilkyieldsduringatleastthethreesubsequentlactationsthatwerelowerthanthoseforheifersgaining600g/d(11).Additionally,intheUnitedKingdom,conven-tionallyrearedcowswithanaveragedailygain(ADG)of0.74kg/dhadmammaryglandsthatweighed39%moreandcontained60%moresecretorytissuethandidglandsfromanimalsgrowingatarateof1.1kg/d(7).Basedonthesefindings,ourcompari-sonsfocusontherequirementsof0.75kgofADG.Requirementsdiscussedinthispaperdonotincludeneedsforpregnancy.
ComparisonofEstimatesbyEnergyRequirementSchemes
ThemostrecentNRCpublicationonrequirementsfordairycattle(13)incorporatesthepriorrequire-mentsforbeefcattlewithtwomodificationsforgrow-ingdairycattle.Maintenancerequirementswerein-creased,andthegainequationwaschangedslightly(Tables1and2).Mostschemesdescribedmain-tenancerequirementsasproportionaltoW0.75,where
W=BW;theBritishAgriculturalandFisheriesResearchCouncil(1),however,usedtheexponentof0.67,whichmayfitdevelopingcattlebestbutcompli-catesthefittomatureanimalsofthespecies,whichlikelyarebestfitbyanexponent>0.75.TheAus-tralianAgriculturalCouncilCommitteeonRuminants(3)introducedanexponentialfactorforageadjustmentthatdecreasestheMEformain-tenance(MEm)requiredasageincreases.There-
quirementsfora10-yr-oldcow,forexample,decreaseby24%belowthoseforyearlings.Forthecoefficientfoftheexpressionf×Wy,whichisusedtoexpress
MEmrequirements,mostschemeshaveincreasedf
whenitisappliedtoHolsteins.The1990AustralianJournalofDairyScienceVol.81,No.3,1998
SYMPOSIUM:ENERGYAVAILABILITY841TABLE1.Basisformaintenanceenergyrequirementofvariousnetenergysystems.
1Nutrientrequirementsystems:NRC1989(13),NRC1984(12),NRC1996(14),InstitutNational
delaRechercheAgronomique[INRA;(9)],AustraliaAgriculturalCouncil[ACC,(3)],andAgricultureandFoodResearchCouncil[AFRC;(1)].
2fWy=Kilocaloriesofnetenergyrequiredformaintenance(NEm)peranimalperday,Holstein
multiplier=ratioofHolsteintoBritishbeefbreedsincorporatedintof,andME=metabolizableenergy.
3TheNEmequivalentto120kcalofMEmsetasthebaseforrequirementsformaintenance.
4RatioofNEm/MEcalculatedbycubicequation(≈MEy)orbylinearequationwhereq=ME/gross
energy.
5IntakeofMEexpressedasmegacaloriesperday.
Netenergysystem1NRC1989NRC1984NRC1996INRAACCAFRCItem2DairyBeefBeefCattleCattleCattle
fWyf86779288393127y0.750.750.750.750.750.67Holsteinmultiplier1.12...1.2...1.07...NEm/ME4≈MEy≈MEy≈MEy≈0.24q≈0.35q≈0.35q