雅思小作文总结
雅思写作5小作文模板
雅思写作5小作文模板
开头段:
The given [chart/graph/table] provides information about [主题]. It is evident that there are significant variations and trends worth noting.
概述段:
Overall, a clear pattern emerges. [简述最显著的总体趋势或特点] For instance, [举一个最突出的例子来支持上述概述].
主体段 1:
Looking at [第一个具体方面/数据组], it can be observed that [描述第一个方面的具体情况和趋势]. Specifically, [给出具体数据和对比]. This trend is likely influenced [分析可能的原因或影响].
主体段 2:
In contrast, when it es to [第二个具体方面/数据组], [描述第二个方面的情况和趋势]. For example, [列举相关数据和细节]. The reason behind this might be [探讨背后的原因].
主体段 3(如有需要):
Another aspect to consider is [第三个具体方面/数据组]. Here, we see that [阐述第三个方面的状况]. This could be attributed to [分析相关因素].
结尾段:。
雅思写作小作文范文汇总 雅思写作高分范文.doc

雅思写作小作文范文汇总雅思写作高分范文相比于大作文而言,雅思写作小作文的分数要低一些,只占到整个写作的三分之一。
相应的,它的套路也更加明显,类型更加固定。
到目前为止,小作文的图表一共也就出现过柱状图bar chart,饼状图pie chart,线状图line graph,表格table,地图map,以及流程图flow chart等。
其描述方式翻来覆去也就那么几种:上升、下降、极值等。
因此,小作文更加容易得到高分,能够在一定程度上提升写作的整体成绩。
为了帮助大家备考,小编搜集了一些小作文方面的考官范文或者高分范文。
大家可以从中学习整篇文章的布局,每一段落所描述的内容,在数据较多的时候如何进行选取,如何进行分类比较,如何进行综述,描述变化或者对比都有哪些词汇,具体的句子结构又该如何变化等。
希望大家到最后都能取得理想的成绩。
点击这里查看雅思写作大作文的高分范文柱状图bar chart雅思写作小作文范文雅思写作柱状图离婚与结婚数量雅思写作小作文范文雅思写作柱状图bar chart 游戏与上网时间雅思写作小作文范文雅思写作柱状图bar chart 通话时间雅思写作小作文范文雅思写作柱状图bar chart 法国与印度年龄分布雅思写作小作文范文雅思写作柱状图bar chart 游戏销售量雅思写作小作文范文雅思写作柱状图bar chart 大胃王比赛雅思写作小作文范文雅思写作柱状图bar chart 金牌数量雅思写作小作文范文雅思写作柱状图bar chart 学习背后的原因雅思写作小作文范文雅思写作柱状图bar chart 交通事故雅思写作小作文范文雅思写作柱状图bar chart 房价变化雅思写作小作文范文雅思写作柱状图bar chart 日常花费雅思写作小作文范文雅思写作柱状图bar chart 教育与科研的参与度雅思写作小作文范文雅思写作柱状图bar chart 欧国国家垃圾处理雅思写作小作文范文雅思写作柱状图bar chart 医院急救对象雅思写作小作文范文雅思写作柱状图bar chart 快餐食用频率雅思写作小作文范文雅思写作柱状图bar chart 男女休闲时间雅思写作小作文范文雅思写作柱状图bar chart 无报酬工作时间雅思写作小作文范文雅思写作柱状图bar chart 不同国家电话数量雅思写作小作文范文雅思写作柱状图bar chart 影响工作表现的因素雅思写作小作文范文雅思写作柱状图bar chart 唱片购买人群雅思写作小作文范文雅思写作柱状图bar chart 文盲比例雅思写作小作文范文雅思写作柱状图bar chart 就业率雅思写作小作文范文雅思写作柱状图bar chart 六种商品的花费雅思写作小作文范文雅思写作柱状图bar chart 监狱关押人数雅思写作小作文范文雅思写作柱状图bar chart 上下班交通方式雅思写作小作文范文雅思写作柱状图bar chart 医疗资金与死亡数量雅思写作小作文范文雅思写作柱状图bar chart 美国心脏病患者数量雅思写作小作文范文雅思写作柱状图bar chart 阿联酋大学毕业生雅思写作小作文范文雅思写作柱状图bar chart 海湾国家女性生育率fertility rate 饼状图pie chart雅思写作小作文范文雅思写作饼状图pie chart 宾馆调查问卷雅思写作小作文范文雅思写作饼状图pie chart 城市用水雅思写作小作文范文雅思写作饼状图pie chart 学校花费雅思写作小作文范文雅思写作饼状图pie chart 健康饮食雅思写作小作文范文雅思写作饼状图pie chart 电力来源雅思写作小作文范文雅思写作饼状图pie chart 宾馆服务满意度雅思写作小作文范文雅思写作饼状图pie chart 英国景点数据统计雅思写作小作文范文雅思写作饼状图pie chart 美国居民花费表格题table雅思写作小作文范文雅思写作表格题table 六个城市的地铁信息雅思写作小作文范文雅思写作表格题table 咖啡与香蕉雅思写作小作文范文雅思写作表格题table 垃圾数量雅思写作小作文范文雅思写作表格题table 骑行上班人数雅思写作小作文范文雅思写作表格题table 手机的不同用途雅思写作小作文范文雅思写作表格题table 生活花费雅思写作小作文范文雅思写作表格题table 时间分配雅思写作小作文范文雅思写作表格题table 不同家庭类型分布雅思写作小作文范文雅思写作表格题table 城市地铁系统雅思写作小作文范文雅思写作表格题table 教育问题雅思写作小作文范文雅思写作表格题table 餐厅销量雅思写作小作文范文雅思写作表格题table 耐用消费品情况雅思写作小作文范文雅思写作表格题table 国家社会经济指数雅思写作小作文范文雅思写作表格题table 不同职业睡眠模式雅思写作小作文范文雅思写作表格题table 每年休息时间雅思写作小作文范文雅思写作表格题table 伦敦房租情况London rental charges 雅思写作小作文范文雅思写作表格题table 澳大利亚贫困家庭线状图(折线图)雅思写作小作文范文雅思写作折线图(线状图)使用互联网的人口比例雅思写作小作文范文雅思写作折线图(线状图)美国肉类消耗量雅思写作小作文范文雅思写作折线图(线状图)交通方式雅思写作小作文范文雅思写作折线图(线状图)老年人口比例雅思写作小作文范文雅思写作折线图(线状图)家庭汽车数量雅思写作小作文范文雅思写作折线图(线状图)酸雨雅思写作小作文范文雅思写作折线图(线状图)英国孩子运动雅思写作小作文范文雅思写作折线图(线状图)公司垃圾数量雅思写作小作文范文雅思写作折线图(线状图)世界食物与石油价格雅思写作小作文范文雅思写作折线图(线状图)新西兰国际游客花费雅思写作小作文范文雅思写作折线图(线状图)伦敦地铁乘客雅思写作小作文范文雅思写作折线图(线状图)迪拜黄金销量雅思写作小作文范文雅思写作折线图(线状图)音乐网站访客流程图flow chart雅思写作小作文范文雅思写作流程图flow chart 洪水与堤防雅思写作小作文范文雅思写作流程图flow chart 太阳能发电雅思写作小作文范文雅思写作流程图flow chart 纸张回收雅思写作小作文范文雅思写作流程图flow chart 蜜蜂生命周期雅思写作小作文范文雅思写作流程图flow chart 咖啡制作过程雅思写作小作文范文雅思写作流程图flow chart 水循环water cycle 雅思写作小作文范文雅思写作流程图flow chart 天气预报雅思写作小作文范文雅思写作流程图flow chart 水泥制造过程雅思写作小作文范文雅思写作流程图flow chart 消费品制造过程雅思写作小作文范文雅思写作流程图flow chart 夏威夷岛地图题map雅思写作小作文范文雅思写作地图题map 学校变化雅思写作小作文范文雅思写作地图题map 地区变化雅思写作小作文范文雅思写作地图题map 超市选址雅思写作小作文范文雅思写作地图题map 楼层改造雅思写作小作文范文雅思写作地图题map 城镇改造混合图雅思写作小作文范文雅思写作混合类可口可乐销量数据雅思写作小作文范文雅思写作混合图独居的人雅思写作小作文范文雅思写作混合图温度与降水雅思写作小作文范文雅思写作混合图各产业用水量雅思写作小作文范文雅思写作混合图国际移民雅思写作小作文范文雅思写作混合图出行原因与相关因素雅思写作小作文范文雅思写作混合图前往澳大利亚的游客雅思写作小作文范文雅思写作混合图英国居民出行的原因与目的地雅思写作小作文范文雅思写作混合图疫苗实验Flu vaccine trial以上就是雅思写作小作文范文的汇总情况,雅思会持续更新此目录汇总,方便烤鸭们查阅学习并练习,更多雅思备考资料请随时关注官网最新动态以及微信消息,祝各位烤鸭们雅思备考顺利,早日拿到理想的分数和offer!。
雅思写作小作文句型总结
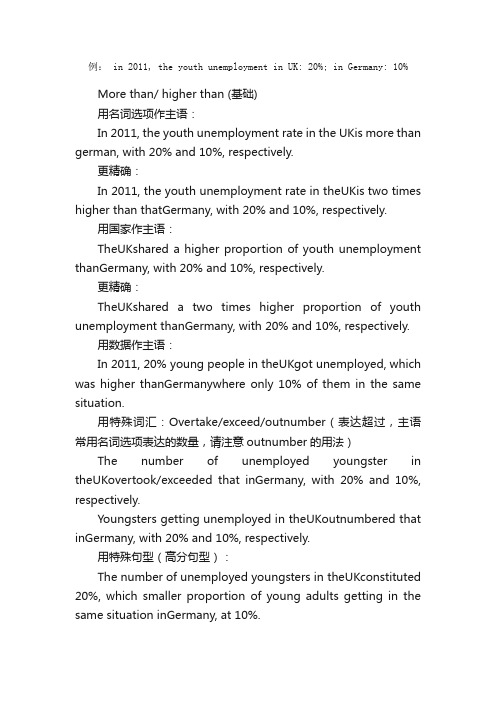
例: in 2011, the youth unemployment in UK: 20%; in Germany: 10%More than/ higher than (基础)用名词选项作主语:In 2011, the youth unemployment rate in the UKis more than german, with 20% and 10%, respectively.更精确:In 2011, the youth unemployment rate in theUKis two times higher than thatGermany, with 20% and 10%, respectively.用国家作主语:TheUKshared a higher proportion of youth unemployment thanGermany, with 20% and 10%, respectively.更精确:TheUKshared a two times higher proportion of youth unemployment thanGermany, with 20% and 10%, respectively.用数据作主语:In 2011, 20% young people in theUKgot unemployed, which was higher thanGermanywhere only 10% of them in the same situation.用特殊词汇:Overtake/exceed/outnumber(表达超过,主语常用名词选项表达的数量,请注意outnumber的用法)The number of unemployed youngster in theUKovertook/exceeded that inGermany, with 20% and 10%, respectively.Youngsters getting unemployed in theUKoutnumbered that inGermany, with 20% and 10%, respectively.用特殊句型(高分句型):The number of unemployed youngsters in theUKconstituted 20%, which smaller proportion of young adults getting in the same situation inGermany, at 10%.用表达倍数的词汇:Double/triple/quadrupleBe xxx timesThe proportion of youth unemployment in theUKdoubled that inGermanyin 2011, with 20% and 10% respectively.句型变化: In 2011, the proportion of youth unemployment in the UK was 20%, which doubled the percentage in Germany(10%).The proportion of youth unemployment in theUKwas two times that inGermanyin 2011, with 20% and 10%, respectively.句型变化: In 2011, the proportion of youth unemployment in the UK was 20%, which was two times the percentage in Germany(10%).如何表达一组差距的静态数据:例句:The biggest difference was at the skilled vocational diploma, where 90% of men held this qualification, compared with only 10% of women.转化(换动词+复杂句型):Men with a skilled vocational diploma largely outnumbered their female counterparts, which formed the biggest difference in the proportion of qualifications between men and women.转化(换动词+复杂句型):The number of men with a skilled vocational diploma largely overtook that of their female counterparts, which formed the biggest difference between the proportions of men and women in their qualifications.如何做组内的两个数据对比?请参考C4T1表格,数据被分为老年组,夫妇组,单身组。
雅思小作文大全及范文

雅思小作文大全及范文雅思小作文是雅思考试中的一部分,主要测试考生的写作能力。
小作文题目通常是关于图表、图表组合、地图、流程图等,考生需要根据所给的信息进行描述、分析和总结。
下面将为大家介绍一些常见的雅思小作文题目,并提供相应的范文。
一、图表题1. 饼图饼图通常用于表示某个整体中不同部分的比例关系。
例如,下面是一个关于全球能源消耗的饼图。
范文:根据所提供的饼图,我们可以看出石油是全球最主要的能源消耗来源,占比为35%。
其次是天然气和煤炭,分别占比25%和20%。
其他能源如核能、水能和可再生能源的消耗相对较少,分别占比10%、5%和5%。
可以预见,石油仍然是未来能源消耗的主导力量。
2. 柱状图柱状图通常用于比较不同组别或不同时间点的数据。
例如,下面是一个关于某城市不同季节的降雨量的柱状图。
范文:从柱状图可以看出,该城市的降雨量在夏季和秋季最高,分别为100毫米和120毫米。
冬季的降雨量为80毫米,而春季最低,仅为60毫米。
这表明该城市的降雨量呈现明显的季节性变化,夏季和秋季是降雨最多的季节。
二、图表组合题图表组合题是将两个或多个不同类型的图表结合在一起进行分析。
例如,下面是一个关于某国家GDP增长和失业率的图表组合题。
范文:从图表中可以看出,该国家的GDP增长率在2000年至2005年之间保持稳定,约为5%。
然而,从2005年开始,GDP增长率逐渐下降,到2010年时仅为2%。
与此同时,失业率在2000年至2005年期间也保持稳定,约为6%。
然而,从2005年开始,失业率逐渐上升,到2010年时达到10%。
可以看出,该国家的经济增长放缓导致了失业率的上升。
三、地图题地图题通常要求考生根据所给的地图描述某个地区的变化或特征。
例如,下面是一个关于某城市的地图题。
范文:根据所提供的地图,我们可以看出该城市在过去十年发生了巨大的变化。
首先,城市的中心区域扩大了,新的商业区、住宅区和公园建立起来。
其次,城市的交通网络得到了改善,新的高速公路和地铁线路建成。
雅思小作文概述段落
雅思小作文概述段落【中英文实用版】In the small composition of the IELTS writing test, the overview paragraph plays a vital role.This paragraph provides a concise summary of the main points discussed in the previous paragraphs.It serves as a bridge between the introduction and the main body, helping to guide the reader through the essay.在雅思写作小作文中,概述段落起到了至关重要的作用。
这一段落提供了对前文中讨论的主要观点的简洁总结。
它作为引言和主体之间的桥梁,有助于引导读者顺利过渡到文章的主要内容。
The overview paragraph should be well-structured and include key points from the previous paragraphs.It should not introduce new information or discuss points that have not been mentioned earlier in the essay.Instead, it should focus on summarizing and reinforcing the main arguments presented in the main body.概述段落应当结构清晰,并包括前几段中的关键观点。
它不应引入新信息或讨论文章中未提及的观点。
相反,它应专注于总结和加强主体部分中提出的主要论点。
To create an effective overview paragraph, it is important to carefully read and analyze the main body of the essay.Identify the main points and supporting evidence presented in each paragraph, and determine which points are most relevant to the overall topic of the essay.Once you haveidentified the key points, organize them in a logical order and create a cohesive paragraph that flows well and effectively summarizes the main arguments of the essay.要创建有效的概述段落,仔细阅读和分析文章的主体部分至关重要。
雅思小作文总结
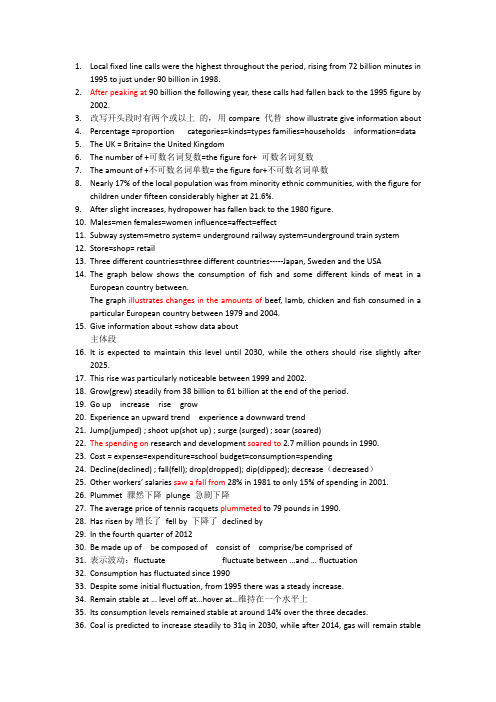
1.Local fixed line calls were the highest throughout the period, rising from 72 billion minutes in1995 to just under 90 billion in 1998.2.After peaking at 90 billion the following year, these calls had fallen back to the 1995 figure by2002.3.改写开头段时有两个或以上的,用compare 代替show illustrate give information about4.Percentage =proportion categories=kinds=types families=households information=data5.The UK = Britain= the United Kingdom6.The number of +可数名词复数=the figure for+ 可数名词复数7.The amount of +不可数名词单数= the figure for+不可数名词单数8.Nearly 17% of the local population was from minority ethnic communities, with the figure forchildren under fifteen considerably higher at 21.6%.9.After slight increases, hydropower has fallen back to the 1980 figure.10.Males=men females=women influence=affect=effect11.Subway system=metro system= underground railway system=underground train system12.Store=shop= retail13.Three different countries=three different countries-----Japan, Sweden and the USA14.The graph below shows the consumption of fish and some different kinds of meat in aEuropean country between.The graph illustrates changes in the amounts of beef, lamb, chicken and fish consumed in a particular European country between 1979 and 2004.15.Give information about =show data about主体段16.It is expected to maintain this level until 2030, while the others should rise slightly after2025.17.This rise was particularly noticeable between 1999 and 2002.18.Grow(grew) steadily from 38 billion to 61 billion at the end of the period.19.Go up increase rise grow20.Experience an upward trend experience a downward trend21.Jump(jumped) ; shoot up(shot up) ; surge (surged) ; soar (soared)22.The spending on research and development soared to 2.7 million pounds in 1990.23.Cost = expense=expenditure=school budget=consumption=spending24.Decline(declined) ; fall(fell); drop(dropped); dip(dipped); decrease(decreased)25.Other workers’ salaries saw a fall from 28% in 1981 to only 15% of spending in 2001.26.Plummet 骤然下降plunge 急剧下降27.The average price of tennis racquets plummeted to 79 pounds in 1990.28.Has risen by增长了fell by 下降了declined by29.In the fourth quarter of 201230.Be made up of be composed of consist of comprise/be comprised of31.表示波动:fluctuate fluctuate between …and … fluctuation32.Consumption has fluctuated since 199033.Despite some initial fluctuation, from 1995 there was a steady increase.34.Remain stable at … level off at…hover at…维持在一个水平上35.Its consumption levels remained stable at around 14% over the three decades.36.Coal is predicted to increase steadily to 31q in 2030, while after 2014, gas will remain stableat 25 quadrillion units.37.表示经历了某种变化see witness experience38.The cost of furniture and equipment saw an opposite trend. (呈现相反的趋势)39.The unemployment rate in Europe experienced a sharp increase from 2.5% to approximately9% in the late 1970s.40.Peak at reach its peak at reach the highest level at41.Reach its lowest point/level at fall to its lowest point/level at42.Reach 表示达到多少stand at 表示位于多少43.Account for make up represent constitute 表示占多少份额百分比44.This cost decreased to only 15% of total expenditure in 1991 but rose dramatically in 2001when it represented 23% of the school budget.mercial buildings accounted for 32% of total energy consumption in 2007.46.Expect predict project Something is expected/projected/predicted to47.This is expected to continue, reaching 47q in 2030.48.Double increase twofold increase threefold 变成原来的三倍triple49.Eating disorders饮食失调in women decreased by about 50%, while the figure for mendoubled.50.This rise was particularly noticeable between 1999 to 2000, during which time the use ofmobile phones tripled.51.Be twice as high/long/fast/popular as… be three times as…as…52.The average meat consumption was twice as high as the global average.53.Almost doubled more than doubled was nearly three times as high as…54.The gap between…as…narrows/narrowed the gad between…and…widens/widened55.The gap between the three categories had narrowed considerably over the second half of theperiod.56.Exceed/exceeded 后面接阿拉伯数字或者百分数overtake/overtook后面接比较对象57.The consumption of chicken, on the other hand, showed an upward trend, overtaking that oflamb in 1980 and that of beef in 1989.58.表示急剧sharp(sharply) rapid(rapidly) dramatic(dramatically)59.There was a dramatic increase in …60.表示持续gradual(gradually) continuous(continuously) steady(steadily)consistent(consistently)61.Increase steadily was a steady increase drop continuously by62.用动词continue 表示某一趋势继续63.Despite some initial fluctuation, from 1995 there was a steady increase. This is expected tocontinue, reaching 47q in 2030.64.表示显著的大幅度significant substantial/substantially considerable/considerablyNoticeable/noticeably marked/markedlyThe consumption of fast food also declined, but much less significantly.Significantly higher considerably faster65.表示小幅度slight/slightly marginal/marginally minimal极少的minimum最少的66.After slight increases, rise slightly,67.Italy’s spending on personal stereo is only marginally greater than that of Germany.68.The impact of this on North America was minimal, with only 0.2% of land affected.69.表示大约about around approximately just over just under70.In 1940 the proportion of people aged 65 and over stood at approximately 7% in Sweden71.表示分别respectively72.From 20q and 50q respectively in 1980, gas showed an initial fall and coal a gradual increase,with the two fuels equal between 1985 and 1990.73.Globally, 65% of degradation is caused by too much animal grazing and tree clearance,constituting 35% and 30% respectively.74.主体段第一句,总体变化趋势/图形由几个部分组成It can be seen from the line graph that the quantities of water used for agricultural, industrial and domestic purposes all increased throughout the century.As we can see from the line graph, the size of the audience fluctuated over the 24 hours.The size of the radio audience also experienced fluctuations over the same period.The pie chart shows that there are four main courses of farmland becoming degraded in the world today.75.结论如果题目里有total(总数), 在结尾段写。
雅思小作文怎么写
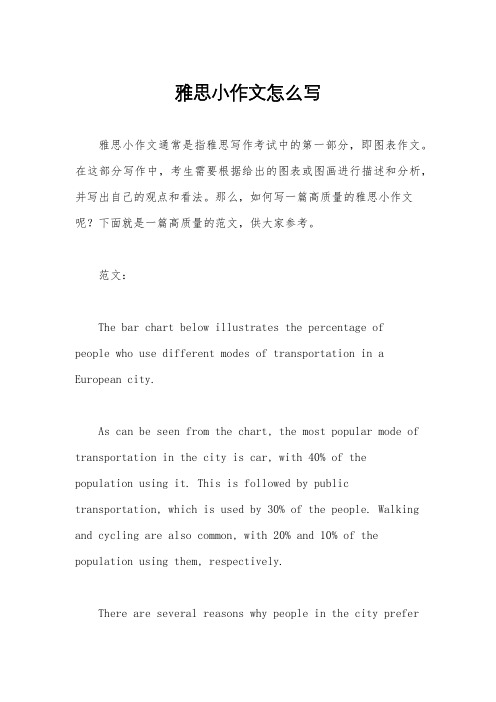
雅思小作文怎么写雅思小作文通常是指雅思写作考试中的第一部分,即图表作文。
在这部分写作中,考生需要根据给出的图表或图画进行描述和分析,并写出自己的观点和看法。
那么,如何写一篇高质量的雅思小作文呢?下面就是一篇高质量的范文,供大家参考。
范文:The bar chart below illustrates the percentage ofpeople who use different modes of transportation in a European city.As can be seen from the chart, the most popular mode of transportation in the city is car, with 40% of the population using it. This is followed by public transportation, which is used by 30% of the people. Walking and cycling are also common, with 20% and 10% of the population using them, respectively.There are several reasons why people in the city preferto use cars. Firstly, cars are seen as a convenient and flexible mode of transportation, allowing people to travel to their desired destination at any time. Secondly, thecity's public transportation system may not be as efficient or reliable as in other cities, which makes people less inclined to use it. Finally, the city may lack proper infrastructure for walking and cycling, which discourages people from using these modes of transportation.In my opinion, the city should take steps to promote the use of public transportation, walking, and cycling. This can be done by improving the public transportation system, such as increasing the frequency of buses and trains, and providing better facilities for pedestrians and cyclists. In addition, the city can also implement policies to reduce the use of cars, such as imposing congestion charges and creating car-free zones in the city center.In conclusion, the bar chart shows that cars are the most popular mode of transportation in the city, followed by public transportation, walking, and cycling. However, steps should be taken to promote the use of moresustainable modes of transportation in order to reduce traffic congestion and air pollution in the city.以上范文是一篇典型的雅思小作文范文,通过描述图表内容,分析数据,表达观点和建议措施,全面而深入地完成了作文要求。
雅思小作文词汇总结
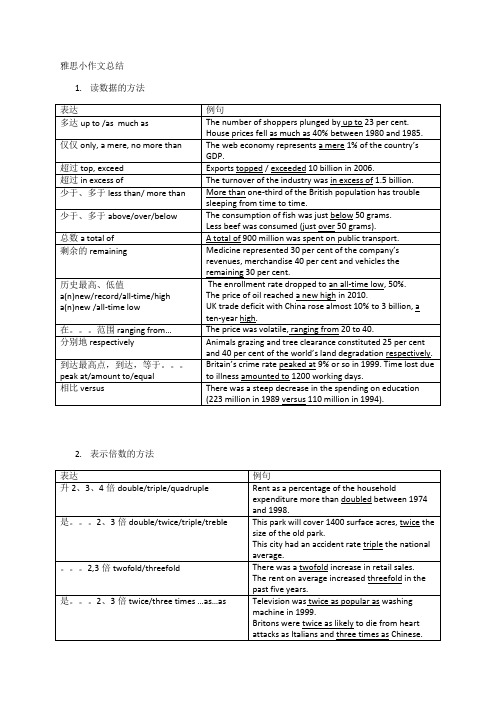
雅思小作文总结1.读数据的方法表达例句多达 up to /as much as The number of shoppers plunged by up to 23 per cent.House prices fell as much as 40% between 1980 and 1985. 仅仅 only, a mere, no more than The web economy represents a mere 1% of the country’sGDP.超过 top, exceed Exports topped / exceeded 10 billion in 2006.超过 in excess of The turnover of the industry was in excess of 1.5 billion. 少于、多于 less than/ more than More than one-third of the British population has troublesleeping from time to time.少于、多于 above/over/below The consumption of fish was just below 50 grams.Less beef was consumed (just over 50 grams).总数 a total of A total of 900 million was spent on public transport.剩余的 remaining Medicine represented 30 per cent of the company’srevenues, merchandise 40 per cent and vehicles theremaining 30 per cent.历史最高、低值a(n)new/record/all-time/high a(n)new /all-time low The enrollment rate dropped to an all-time low, 50%. The price of oil reached a new high in 2010.UK trade deficit with China rose almost 10% to 3 billion, a ten-year high.在。
- 1、下载文档前请自行甄别文档内容的完整性,平台不提供额外的编辑、内容补充、找答案等附加服务。
- 2、"仅部分预览"的文档,不可在线预览部分如存在完整性等问题,可反馈申请退款(可完整预览的文档不适用该条件!)。
- 3、如文档侵犯您的权益,请联系客服反馈,我们会尽快为您处理(人工客服工作时间:9:00-18:30)。
雅思小作文总结一、评分标准(1)任务完成情况:趋势描写,数据支持,不要画蛇添足(2)关联词大量而准确地使用(连贯)(3)词汇(4)句子结构二、写作要求(1)客观性不能有想象成分,总结归纳要符合逻辑。
(2)准确性数据要求精确(不抄错),可以合理目测(大概数值)。
(3)详尽性4类特征数据一定介绍:最大值(maximum),最小值(minimum),交叉点(intersection),变化趋势(trend)。
三、作文类型Line graphPie chartBar chart 70%TableFlow graph/process diagram 20%Others 10%四、解题技巧A. 表格图1横向比较: 介绍横向各个数据的区别,变化和趋势 2纵向比较:介绍横向各个数据的区别,变化和趋势 3无需将每一个数据分别说明,突出强调数据最大值和最小值,对比时要总结出数据对比最悬殊的和最小的说明:考察例举数字的能力和方法。
注意怎样通过举一些有代表性的数据来有效地说明问题。
B.线图1极点说明: 对图表当中最高的,最低的点要单独进行说明2趋势说明: 对图表当中曲线的连续变化进行说明,如上升,下降,波动,持平3交点说明: 对图表当中多根曲线的交点进行对比说明说明:关键是把握好曲线的走向和趋势,学会general classification,即在第二段的开头部分对整个曲线进行一个阶段式的总分类,使写作层次清晰。
接下来在分类描述每个阶段的specific trend,同时导入数据作为你分类的依据。
注意不要不做任何说明就机械性的导入数据!C. 饼状图1介绍各扇面及总体的关系 2各个扇面之间的比较,同类扇面在不同时间,不同地点的比较 3重点突出特点最明显的扇面:最大的,最小的,互相成倍的D. 柱状图1.比较: similarity2.对比: difference)3.横向总结所有柱状图表的共性特征 & 分别描写各个柱子的个性特征4,有年份的可按照线图的写作方法。
E. 流程图1.首先说明:做什么工作的过程,目的是什么 2.准备工作 3.按时间/过程先后描述 4.结果 5.简单总结说明:注意流程图里的“因果关系”或每一流程的“承前启后”关系;表达每一流程的主体内容,阐明这种关系;揭示其内在联系或规律;最后,给予简要归纳和总结。
F. 实物/器具工作过程1.实物的名称,功能 2.基本结构 3.工作过程 4.简单总结G. 综合图1不求甚解,不拘泥于细节2分门别类,分段落详细介绍各个图表 3不画蛇添足,主观臆断或猜测图表之间的关系H.地图1.历史变迁图描述不同年份的场景变化,记住实用方位词。
并注意按照空间顺序描述。
2.选址题描述图中备选地点的地理优缺点。
五、写作方法混合图:六、写作模板开头段句式:table/chart/diagram/graph shows (that)...figures/statistics show (that)...diagram shows/ describes/ illustrates how...to/As (is) shown in the/As can be seen from the table/chart, diagram, graph, figurescan be seen/observed from the/ we can se e from the…is clear/ apparent from the table/chart/diagram/graph/figures (that)...三种描述趋势的句式1. There was/is/will be + a/an + 形容词 +变化名词 + in the number/percentage of + 被描述对象 + 时间. There was a sharp increase/decrease in the number of TV audiences from 12pm to 2 pm.2. The number/percentage of 被描述对象 + 变化动词 + 副词 + 数据 + 时间. The number of TV audiences rose sharply from 6am to 8am.3. 时间段 + witness/see/experience + a/an + 形容词 + 变化名词 + in the number/percentage of 被描述对象. The period between 10am and 12pm witnesses a moderate growth in the number of people in the station, with the number reaching 280 at midday.The next hours see a dramatic rise in the number again.描述最高点、最低点1. 被描述对象 + reach its highest point /peak/bottom at + 数据 + 时间. At 4pm, the number reaches its bottom at 100.At 8am, it reached its highest point at 25%.2. peaking at/ bottoming at + 数据. After that, the number increased sharply until 1998, peaking at 20,700.比较两个对象The number/percentage of 被描述对象 1 + was/is/will be + (much/slightly) +larger/higher/lower/smaller + than + that of 被描述对象2.. The number of business was higher than that for visits to friends and relatives.However, for the rest of the day, the percentage三个及以上的对象比较被描述对象 + has/had/will have + the largest/highest/lowest/smallest + number/percentage of + 项目 + in/among 范围. USA had the highest quality of life in the five countries.Other reasons had the smallest percentage in the four reasons.连接手段1. Then/ from this time onwards/ from then onThere was a rise. Then the number went down...2. After/ beforeThere was a rise, before the number went down.After a rise, there was a decrease, before the number remained stable.3. …which was followed by/which led to/which preceded an increase/decreaseThere was a rise, which was followed by a decrease.4.上一句最后时间词,when...There was a rise in the number of teachers from数据in年份to数据in年份, when the number went down.5. Again(第二次以后的上升/下降)There was a rise. Again, the number went down.6. However...then...(上升和下降之间)There was a rise. However, the number then went down.7、其他关联词:类比、对比、句子衔接However/ compare to/ in contrast/ / similarly/ conversely/ / whileSimilarly/likewiseAs to/ in term of / as for流程图模板七、各种图表描述注意事项WRITING TASK 1:You should spend about 20 minutes on this task.The chart and graph below give information about sales and share prices for Coca-Cola.Summarize the information by selecting and reporting the main features, and make comparisons where relevant.You should write at least 150 words.范文:The pie chart shows the worldwide distribution of sales of Coca-Cola in the year 2000 and the graph shows the change in share prices between 1996 and 2001.In the year 2000, Coca-Cola sold a total of billion cases of their fizzy drink product worldwide. The largest consumer was North America, where per cent of the total volume was purchased. The second largest consumer was Latin America. Europe and Asia purchased and per cent of the total volume respectively, while Africa and the Middle East remained fairly small consumers at 7 per cent of the total volume of sales.Since 1996, share prices for Coca-Cola have fluctuated. In that year, shares were valued at approximately $35. Between 1996 and 1997, however, prices rose significantly to $70 per share. They dipped a little in mid-1997 and then peaked at $80 per share in mid-98. From then until 2000 their value fell consistently but there was a slight rise in mid-2000.WRITING TASK 1:You should spend about 20 minutes on this task.The chart shows the division of household tasks by gender in Great Britain.Write a report for a university lecture describing the information shown below.You should write at least 150 words.Source: Office for National Statistics on behalf of the Controller of Her Majesty's Stationery Office. Study these three sentences and then write three similar sentences about other parts of the chart.1Women spend over twice as much time doing kitchen tasks as men.2Men spend 30 minutes a day doing kitchen tasks whereas / while women spend 74 minutes a day.3Women are more active in the kitchen than men (74 minutes a day for women as opposed to 30 minutes for men).Sample ReportThe chart shows the average number of minutes per day men and women in Great Britain spend on jobs around the house.In total, men spend just over two-and-a-half hours on household tasks whereas women spend slightly less than four hours. Women spend more than twice as much time doing kitchen tasks such as cooking and washing up as men (74 minutes for women as opposed to30 minutes for men. Women are also more active in cleaning the house- it takes 58 minutes of their daycompared to / with13 minutes for men - and childcare, where women put in more than twice as much time as men.On the other hand, men are more active in gardening and pet care, where they spend twice as long as women, and maintenance and DIY, on which they spend 15 minutes more than women. Women account for almost all the time spent on washing and ironing clothes. This takes them 25 minutes, while / whereas men spend just 2 minutes on this task.Overall the figures show that women spend more time on routine domestic chores than men, while / whereas men do more household maintenance, gardening and pet care.WRITING TASK 1:You should spend about 20 minutes on this task.The map below shows the development of the village of Ryemouth between 1995 and present. You should write at least 150 words.This report compares how the village of Ryemouth has developed and changed since the year of 1995.As is clearly described in the first picture, Ryemouth was a coastal city which was divided into three parts by two roads. In the southern part, there was a fishing port on the sea, with a fish market located in the north and a coffee shop in the north-east. A block of shops was situated on the opposite side of the market…In the second picture, the village changed a lot. The fishing port has been removed and thefish market is replaced by apartments. Several restaurants also occupy the place of the shops on the roadside. Moreover, a parking lot is newly built on the east of the hotel. In addition,Overall, based on the brief description above, it is clear that the general layout of the village does not change a lot, while some newly-built facilities and housing has ornamented the small village.WRITING TASK 1:You should spend about 20 minutes on this task.The diagram below shows the process by which bricks are manufactured for the building industry.Summarize the information by selecting and reporting the main features, and make comparisons where relevantYou should write at least 150 words.The process by which bricks are manufactured for the building industry can be outlined in seven consecutive steps. First the raw material, clay, which was just below the surface of soil in certain clay-rich areas has to be dug up by a digger.Then the lumps of clay are placed on a metal grid in order to break up the big chunks of clay into much smaller areas, which fall through the metal grid onto a roller, whose motion further segregates the bits of clay. Sand and water are added to make a homogenous mixture, which is then either formed in moulds or cut into brick-shaped pie Those fresh bricks are then kept in a drying oven for at least 24 and a maximum of 48 hours, several dozens if not hundreds of bricks at a time. The dried bricks are then transferred to a so-called kiln, another typeof high temperature oven. First they are kept at a moderate temperature of 200 ℃ -1300 ℃. This process is followed by cooling down the finished bricks for 48 to 72 hours in a cooling chamber.Once the bricks have cooled down and have become hard, they get packaged and delivered to their final destination, be it a building site or storage.。