The European Spallation Source - Lu:欧洲散讲义裂源路
JEM-X background models
a r X i v :a s t r o -p h /0309287v 1 10 S e p 2003Astronomy &Astrophysics manuscript no.INTEGRAL32February 2,2008(DOI:will be inserted by hand later)JEM-X background models ⋆J.Huovelin,1S.Maisala,1J.Schultz,1N.J.Westergaard,2C.A.Oxborrow,2P.Kretschmar,3,4and N.Lund 21Observatory,P.O.B.14(Kopernikuksentie 1),FIN-00014University of Helsinki,Finland 2Danish Space Reasearch Institute,Juliane Maries Vej 30,DK 2100Copenhagen,Denmark 3Max-Planck-Institut f¨u r Extraterrestrische Physik,Giessenbachstrasse,85748Garching,Germany 4INTEGRAL Science Data Center,Chemin d’Ecogia 16,Versoix,Switzerland Received July 15,2003;accepted Abstract.Background and determination of its components for the JEM-X X-ray telescope on INTEGRAL are discussed.A part of the first background observations by JEM-X are analysed and results are compared to predictions.The observations are based on extensive imaging of background near the Crab Nebula on revolution 41of INTEGRAL.Total observing time used for the analysis was 216502s,with the average of 25cps of background for each of the two JEM-X telescopes.JEM-X1showed slightly higher average background intensity than JEM-X2.The detectors were stable during the long exposures,and weak orbital phase dependence in the background outside radiation belts was observed.The analysis yielded an average of 5cps for the di ffuse background,and 20cps for the instrument background.The instrument background was found highly dependent on position,both for spectral shape and intensity.Di ffuse background was enhanced in the central area of a detector,and it decreased radially towards the edge,with a clear vignetting e ffect for both JEM-X units.The instrument background was weakest in the central area of a detector and showed a steep increase at the very edges of both JEM-X detectors,with significant di fference in spatial signatures between JEM-X units.According to our modelling,instrument background dominates over di ffuse background in all positions and for all energies of JEM-X.Key words.X-ray background –X-ray data analysis –INTEGRAL satellite 1.Introduction Background of X-ray and γ-ray detectors for astronomy can generally be divided in two components,di ffuse sky back-ground and instrument background .JEM-X consists of two mechanically identical telescope units (JEM-X 1and 2),with a position sensitive xenon-filledMicrostrip Gas Chamber,a collimator,and a coded mask as anoptical element in each unit (see Lund et al.2003for moredetails).There are four internal radioactive sources for spectralcalibration in the collimator of each unit.The sky image is thus a result of mathematical processingof the mask shadow pattern on the position sensitive detectors(e.g.in’t Zand 1992;in’t Zand,Heise &Jager 1994).Di ffuse sky background enters the detectors via the apertureand is a ffected by the mask and the collimator,similarly to thedistinguishable sources in the sky.Instrument background in-cludes detector signal due to interactions between cosmic radi-2Huovelin et al.:JEM-X background modelsFig.1.Spatial distribution of the background.Upper panels:JEM-X1,lower panels,JEM-X2.Left panels:Instrument back-ground,Right panels:Diffuse background.The white rectan-gles denote the positions of the calibration sources,which havebeen excluded from our analysis.The collimator signature canbe seen as weak vertical and horizontal line structures in the shadowgrams.The broad vertical lines are due to dead anodes.Also some photon leak from the calibration sources is evident.The sharp and very narrow lines are graphical artifacts causedby the plotting routine.Total intensity of each shadowgram isnormalized to1.Table1.INTEGRAL background pointings during cycle41.45324.0+210850.17000053645.0+122415.14082553645.2+122546.44277553645.3+122543.564468Huovelin et al.:JEM-X background models3Table2.The normalization factors of the background con-tinuum components(10−3photons keV−1cm−2s−1at1keV). Mean and standard deviation of values derived from the six extraction regions at each radius are given.The energy range used in thefitting is4-33keV.Diffuse denotes diffuse sky back-ground,Flat denotes theflat continuum of the instrument back-ground.Note that the normalization is determined on the basis of source spectra from1R in R out JEM-X1JEM-X2pix pix Diffuse Flat Diffuse FlatThe diffuse background decreases towards the edges of the detector,as expected.The instrument background is stronger than expected,dominating the spectrum at all radii.The ten expected K-shell lines(from the109Cd and55Fe calibration sources,collimator(Mo),and detector gas(Xe))were detected close to their nominal positions.This implies that the energy scale is correctly determined.The previously unknown weak line near13keV turned out to be the uranium L-shell line.It most likely originates in the detector beryllium window.Near the edges of the detector,the background is highly nonuniform. Additional nonuniformity in the outer parts was introduced by photon leak from calibration sources,which could not be com-pletely eliminated.We also searched for possible dependence of background on the orbital phase of the observations.The spectrum varied with a range of approximately5%between three separate or-bital sections well outside radiation belts.The variation is sta-tistically significant but small.Also dependence on solar aspect angle and particle radiation level can be utilised in the JEM-X ISSW background modelling.Significant variations were not found.The variation in the solar aspect due to different point-ings was20◦,which is probably not sufficiently large for stud-ies of an effect on instrument background.Also,there was no proper indicator of particle radiation level on INTEGRAL available during our observations to search for a correlation.4.ConclusionsWe have analyzed a part of thefirst INTEGRAL background observations with JEM-X.Estimates of the spatial and spec-tral distributions are obtained for diffuse sky background and instrument background.The total background observed for JEM-X1was28cps,for JEM-X223cps,and25cps on the average.A part(∼1/5)of the excessively large background may be due to residual Crab Nebula emission in JEM-X data.According to XSPECfitting,the diffuse background was at maximum in the centre of the detector and it decreasedra-Fig.2.Four sample background spectra extracted from differ-ent parts of JEM-X2.At the sides of the detector,a blend of K-shell lines from the spacecraft structure is seen.Note also the prominent lines in spectrum extracted from the surround-ings of the calibrationsources.Fig.3.The background extraction regions.Units in both axes are pixels.All regions cover an equal area of the detector. Exclusion of calibration sources(not shown)reduces the ac-tual area of some regions.dially towards the edge,which is due to vignetting.There is also slight asymmmetry in the spatial distribution of the diffuse background,which is caused by a small angular misalignment of the detector plane.The count rate for diffuse background was approximately20%of the total background.The instrument background intensity and spectrum are highly position dependent,with a steep increase near the edges at all radial directions.Leakage of the radiative calibration sources causes residual line emission in the neighbourhood of4Huovelin et al.:JEM-X background modelsTable3.The lines detected from the background.Line ID is the element and transitions producing the line,E is the line en-ergy in keV(Thompson et al.,2001).Subscripts1and2denote the detectors JEM-X1and2,F is the largest line strength de-tected,¯F(N)mean of detected line strengths where N is the number of regions from which the line is detected(maximum is48regions/detector).The Mn/Fe line at6.45keV is a blend of Mn Kβ(6.49keV)and Fe Kα(6.40keV).Line strengths are given in10−3photons cm−2s−1.Note that the line strengths are determined on the basis of source spectra from1Line E F1¯F1(N)F2¯F2(N)Origin the source positions.The count rate for the instrument back-ground was approximately80%of the total background.The total background level varied with a range of approx-imately5%between different orbital sections.the variation is significant,but small.Also,it is impossible to say,what fraction of this,if any,is caused by the simultaneous variation of the so-lar aspect angle of the satellite,and the unknown variations of particle radiation level.We plan to separate these effects by the support of future background observations.Although our modelling is simple,and does not provide accurate absolute estimates of physical backgroundfluxes,it yields information which can be applied to the JEM-X analysis software to properly account for background contribution in spatially resolved spectral data.A thorough analysis of JEM-X background will be presented in a future paper. Acknowledgements.Authors from the Observatory,University of Helsinki acknowledge the Academy of Finland,TEKES,and the Finnish space research programme ANTARES forfinancial support in this research.J.Schultz is grateful for thefinancial support of the Wihuri Foundation.The Danish Space Research Institute acknowl-edges support given to the development of the JEM-X instrument from the PRODEX programme.ReferencesArnaud,K.A.,1996,Astronomical Data Analysis Software and Systems V,eds.Jacoby G.and Barnes J.,ASP Conf.Series V ol.101.Covault,C.E.,Grindlay,J.E.,Manandhar,R.P.,and Braga,J.,1991, IEEE Transact.Nucl.Sci.,V ol.38,No.2.Ferguson,C.,Barlow,E.J.,Bird,A.J.,et al.,2003A&A,this volume in’t Zand,J.,1992,Ph.D.thesis,SRON.in’t Zand,J.,Heise,J.,Jager,R.,1994,A&A288,665.Lund,.N.,Brandt,S.,Budtz-Joergensen,C.,et al.,2003,A&A,this volumeMarshall,F.E.,Boldt,E.A.,Holt,S.S.,et al.,1980,ApJ235,4 Oxborrow C.A.,Kretschmar,P.,Maisala,S.,Westergaard,N.J., Larsson,S.,2002,Instrument Specific Software for JEM-X: Architectural Design Document,DSRI homepage:www.dsri.dk Thompson, A.C.,Attwood, D.T.,Gullikson, E.M.,et al.,2001,“The X-ray data booklet”,2nd ed.,Lawrence Berkley National Laboratory,Univ.of California,available at / Westergaard,N.J.,Kretschmar,P.,Oxborrow,C.A.,et al.,2003,A& A,this volumeWillmore,A.P.,Bertram,D.,Watt,M.P.,et al.,1992,MNRAS258, 621。
IAEA-277号报告
─ 促进成员间的经验交流,接受会员,必要时互相支持; ─ 推动成员间的联系和与剂量学基准实验室(PSDLs)的联系,从而建立与国际辐射测量系统
的关系和建立测量溯源性; ─ 提升所用校准方法的兼容性和剂量测量能力,在世界上达到测量一致性的目标。 目前(1987)IAEA 和 WHO 二级标准实验室网由大约 60 个成员,其中 46 个位于发展中国家。 12 个国家基准实验室作为关联实验室,还有 5 个国际合作组织支持二级标准实验室网。二级标准实验 室网秘书处由 IAEA 和 WHO 共同支持。 1.3. 辐射束能量范围 本实用规范为精确测定辐射治疗辐射束水的吸收剂量提供必要的计量学知识。目前本出版物覆盖 的辐射质范围为:管电压低于 100 kV产生的低能量软X射线、管电压高于 100 kV产生的中能或传统X 射线、平均能量≥0.66 MeV的高能光子束和(能量范围为 5 MeV≤E0≤50 MeV,但也有一些可用于 5 MeV 以下能量的数据的说明)高能电子束。 1.4. 本规范的实际应用 本报告着重使剂量测量过程尽量简单。但是规范不得不包含大量信息以便为不同使用者提供他们 测定吸收剂量时所须的数据。使用者应首先研读本规范,而后可以仅仅根据流程图和工作表(见附录 B)完成测量。
在 IAEA 和 WHO 之间的工作安排中,更一致同意建立“IAEA 和 WHO 二级标准实验室(SSDLs)
1
网”,作为综合安排各个独立的二级标准实验室(SSDLs)的工作和推动他们与基准实验室之间联系的 方法。二级标准实验室网秘书处负责提出建立二级标准实验室的标准[14],IAEA 剂量学实验室负责组 织二级标准实验室间剂量比对。二级标准实验室网确定的主要目标如下:
散射理论
3. 刚势球散射:势垒
U 0 → ∞; k 02 =
2 µU 0
→ ∞ ,则
2
thk 0 a =
e k0 a − e − k0 a e k0 a + e − k0 a
解得:ψ nlm ( r , θ , ϕ ) = Rnl ( r ) Ylm (θ , ϕ )
2 ∇ 2ψ ( r , θ ) + ⎡ ⎣k − V ( r )⎤ ⎦ψ ( r , θ ) = 0 ,
n固定 ψ ( r ,θ ) ⎯⎯⎯⎯⎯ → R r P cos θ ) , 所以,每一项( l 的一个值)称为ψ ( r , θ ) 的 一个分波。 m=0(与ϕ 无关) ∑ l ( ) l ( l
, k
'2
=
2 µ (U 0 − E )
2
.
' ' ⎧ ⎪U ( r ) = A sin k r,r ≤ a ⎞ ⎛k ⎛ thka ⎞ ∴ kctg (ka + δ 0 ) = k ' ctgk ' a , δ 0 = tg −1 ⎜ ' thk ' a ⎟ − ka ,∴ Q = 4πa 2 ⎜ − 1⎟ ⎨ ka k δ U r A sin( kr ) r a = + , > ⎠ ⎠ ⎝ ⎝ ( ) ⎪ 0 ⎩
3〉微分截面计算公式 入射波的几率流密度: J z =
散射波: 又 dn = qNd Ω
Jr =
2 2 ds dn i ⎛ ∂ψ 2∗ ∂ψ 2 ⎞ V ∴ dn = J r ids = N f (θ , ϕ ) 2 −ψ 1∗ ⎜ψ 2 ⎟ = 2 f (θ , ϕ ) = ds r ∂r ∂r ⎠ r 2µ ⎝ 2 ds ) ∴ q (θ , ϕ ) = f (θ , ϕ ) 2 r
物理光学实验讲义
图 2—1 迈克耳逊干涉仪光路原理图
图 2—2 WSM—100 形迈氏干涉仪外形图
干涉系统由分光板 G1,补偿 G2,平面反射镜 M1和 M2组成。G1、G2 是两块材料相同、形状一样的平行平面玻璃板。在 G1 的后表面上镀有银或
-6-
铝的半透半反射膜 A。从图 2—1 可以看出,不加 G2 时,光束 I 经过 G1 三 次,而光束Ⅱ只经过一次。这种不对称性,对单色光干涉并不重要,但在白 光干涉时,由于 G1 的色散会对不同波长的光波产生附加光程差,加入 G2 可以补偿这种附加光程差,以便得到清晰的白光干涉条纹。3、4 为平面反 射镜 M2 的微调旋钮,在 M1、M2 后还有三只可调螺旋 8,用以调节 M1、M2 间的相对倾角。安装时,要求 G1 平行于 G2。M1、M2 与 G1、G2 约成 45° 夹角。在图 2—1 中, M 2 是 M2 在半反射面 A 中的虚象,位于 M1 附近。 干涉条纹可认为是 M1、 M 2 的反射光在干涉场中迭加相干的结果。 观察测量系统由导轨 7,粗调手轮 1,微调手轮 2,读数窗 5,观察屏 6 组成。M1 由精密丝杆带动可在导轨 7 上平移,旋转手轮 1 或 2,可改变 M1 和 M 2 之间的距离 d。在本仪器中,M1 镜的移动范围约为 100mm,读数精 度为 10-4mm,可估读到 10-5mm。M1 的位置由三部分读数之和决定,这些读 数是导轨左侧的毫米标尺读数(mm) 、读数窗 5 显示的读数(10 2mm)与 微调手轮 2 的读数(10 4mm) 。在一次测量中,手轮 5 和 2 应单向旋转, 以 避免逆转空回引起测量误差。
la e l l'
(1—4)
若在迭加区内放置观察屏 E,就可接收到平行于脊棱的等距直线条纹。 当用白光照明时,可接收到彩色条纹。 利用图 1—2 可导出干涉孔径角
600kV ns 脉冲中子发生器的一些相关问题的研究
第31卷第4期原子能科学技术V o l.31,N o.4 1997年7月A tom ic Energy Science and T echno logy Ju ly1997600kV n s脉冲中子发生器的一些相关问题的研究张立山 关遐令 毛孝勇 沈冠仁(中国原子能科学研究院核物理研究所,北京,102413)就中子物理飞行时间技术对脉冲中子发生器的需要,对中国原子能科学研究院600kV n s脉冲中子发生器的聚束和切割性能的某些参量进行分析和计算,将结果与实验进行比较,并把它们用于脉冲化装置的调试。
关键词 脉冲 聚束器 切割器脉冲化中子源是利用飞行时间方法进行核物理实验的重要装置之一,尤其在中子物理的快中子微分和双微分截面的测量中更是必不可少。
它克服了伴随粒子法测量时间长和双闪烁体法对散射样品的限制,但它对脉冲束的束流品质提出了相当高的要求。
在现有条件下为获得高精度的实验数据,对本脉冲化装置的要求是:脉冲半宽在112n s以内、脉冲底宽和半宽比为3—5、重复频率在115M H z左右,束流平均强度约为30—50ΛA。
为确保束流品质稳定地达到以上标准,对脉冲化装置的聚束器和切割器的主要技术参量进行计算,以便得到聚束器的最佳聚束电压值、相位和幅度的稳定度,同时确定最佳切割宽度和切割引起能散与离子源初始发射度的关系,推导脉冲半宽与离子源初始能散的对应关系,这对实验调试和运行是有重要意义的。
1 单漂移聚束器的参数计算111 聚束的基本原理一束有一定能量差别的粒子,要求它们经过一段距离后能同时到达靶上,则它们的能量E t和相应起始时刻t的关系为:E t=E0 (1-t Σ)2(1)式中,E0为中心粒子的初始能量,Σ为中心粒子从零时刻起到靶上所需时间。
一般在tνΣ时有如下关系:∃E=E t-E0≈E0(1+2t Σ-1)=2tE0 Σ(2)∃E称为调制能量。
由式(2)可知∃E与t近似成线性关系。
由t、t′(t′=d t d L)相空间中相点运动方程可知:收稿日期:1996211229 收到修改稿日期:1997201217d t ′t ′=-F Z (t ′)2m d z =-d E 2E(3)t ′1t ′0=(E 0E 1)12(4)在Υ、Υ′(Υ′=d Υ d L )相空间中,令∆0=∃E E 0,中心粒子Υc =0,Υ′c =0;对任意粒子有:Υ0=Ξ(t 0-t c )=Ξt 0(5)Υ′0=Ξ(t ′0-t ′c )≈Ξt ′c ∆0 2(6)在粒子受正弦波电压调制时,粒子能量为:E =E 0+V m sin Υ0(7)其中:V m 为调制电压幅度。
反应堆物理题库
西安交通大学——核反应堆物理分析(共470题)从反应堆物理的角度看,良好的慢化剂材料应具有什么样的性能?答案:慢化剂是快中子与它的核发生碰撞后能减速成热中子的材料,这与它的三种中子物理性能有关:δ-平均对数能量缩减;Σs-宏观散射截面;Σa-宏观吸收截面。
综合评价应是δ和Σs都比较大而Σa又较小的材料才是较好的慢化材料,定量地用慢化能力δΣs和慢化比δ和Σs/Σa来比较。
试列出常用慢化剂的慢化能力和慢化比。
核力所具有的特点是什么?答案:基本特点是:核力是短程力,作用范围大约是1~2×10-13cm;核力是吸引力,中子与中子,质子与中子,质子与质子之间均是强吸引力。
核力与电荷无关。
核力具有饱和性,每一核子只与其邻近的数目有限的几个核子发生相互作用。
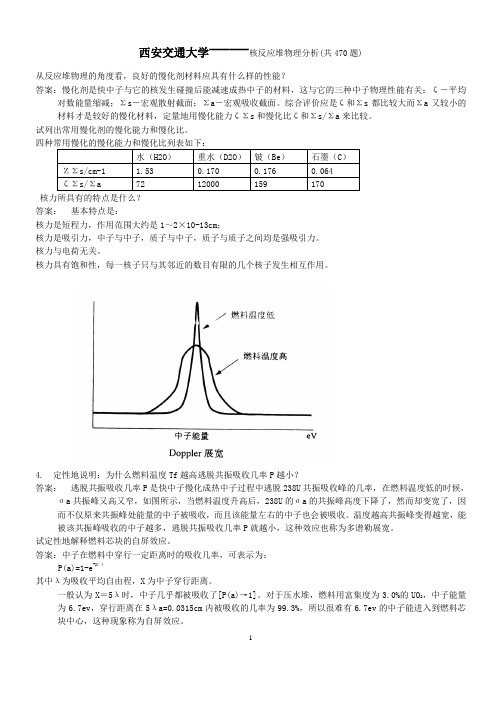
4. 定性地说明:为什么燃料温度Tf越高逃脱共振吸收几率P越小?答案:逃脱共振吸收几率P是快中子慢化成热中子过程中逃脱238U共振吸收峰的几率,在燃料温度低的时候,ζa共振峰又高又窄,如图所示,当燃料温度升高后,238U的ζa的共振峰高度下降了,然而却变宽了,因而不仅原来共振峰处能量的中子被吸收,而且该能量左右的中子也会被吸收。
温度越高共振峰变得越宽,能被该共振峰吸收的中子越多,逃脱共振吸收几率P就越小,这种效应也称为多谱勒展宽。
试定性地解释燃料芯块的自屏效应。
答案:中子在燃料中穿行一定距离时的吸收几率,可表示为:P(a)=1-e-X/λ其中λ为吸收平均自由程,X为中子穿行距离。
一般认为X=5λ时,中子几乎都被吸收了[P(a)→1]。
对于压水堆,燃料用富集度为3.0%的UO2,中子能量为6.7ev,穿行距离在5λa=0.0315cm内被吸收的几率为99.3%,所以很难有6.7ev的中子能进入到燃料芯块中心,这种现象称为自屏效应。
6. 什么是过渡周期?什么是渐近周期?答案:在零功率时,当阶跃输入-正反应性ρ0(ρ0<β)后,反应堆功率的上升速率(或周期)是随ρ0输入后的时间t而改变的(如图所示)。
cerna作用的研究思路
cerna作用的研究思路CERN作用的研究思路CERN,即欧洲核子研究中心,是世界上最大的粒子物理实验室之一。
它位于瑞士和法国边界附近,拥有世界上最强大的粒子加速器。
CERN的研究旨在探索宇宙的奥秘,研究物质的本质和宇宙的起源。
在这篇文章中,我们将探讨CERN的研究思路。
粒子物理学是CERN的核心领域。
它研究基本粒子,例如夸克和轻子,以及它们之间的相互作用。
CERN的研究思路主要包括以下几个方面:1. 粒子探测器技术粒子探测器是CERN进行实验的重要工具。
它们用于检测粒子和辐射,并提供有关它们的信息。
CERN的研究人员通过研究和开发新的探测器技术,不断提高粒子探测器的性能和精度。
例如,ATLAS 探测器是CERN最著名的实验之一,它在2012年发现了希格斯玻色子,这是粒子物理学的一个重要里程碑。
2. 粒子加速器技术CERN的粒子加速器是世界上最强大的粒子加速器之一。
它们用于加速带电粒子,例如质子和离子,以极高的速度撞击目标。
通过粒子加速器,CERN的研究人员可以模拟宇宙中的极端条件,例如大爆炸的条件,从而研究物质的本质和宇宙的起源。
3. 数据分析和模拟CERN的研究人员使用大量的数据和计算机模拟来分析实验结果和预测新的现象。
例如,他们使用计算机模拟来预测希格斯玻色子的性质和行为,然后通过实验来验证这些预测。
这种方法可以帮助他们更好地理解宇宙的本质和物质的基本性质。
4. 国际合作CERN是一个国际性的研究机构,来自世界各地的科学家和工程师都在这里工作。
CERN的研究需要大量的人力和物力支持,因此国际合作是至关重要的。
CERN与世界上许多国家和地区的机构和大学合作,共同研究物理学和宇宙学的前沿问题。
CERN的研究思路是多方面的,包括粒子探测器技术、粒子加速器技术、数据分析和模拟以及国际合作。
通过不断地研究,CERN的研究人员可以更好地了解宇宙的本质和物质的基本性质,为人类的科学进步做出贡献。
2010年全国优秀博士学位论文提名论文名单
李晔
东北师范大学
2010087
非线性偏微分方程的渐近极限
张国敬
张凯军
东北师范大学
2010088
锂离子电池及其电极材料的研究
谢海明
王荣顺
东北师范大学
2010089
两种果蝠对植物种子的传播及行为学研究
唐占辉
盛连喜
东北师范大学
2010090
福柯微观权力思想研究--兼论马克思哲学的微观视域
赵福生
衣俊卿
简水生
北京交通大学
2010019
高速列车受电弓滑板用Ti3SiC2系材料的制备与性能研究
黄振莺
翟洪祥
北京交通大学
2010020
SiC纳米线力学性能原位电子显微学研究
张跃飞
张泽
北京工业大学
2010021
功能梯度材料结构中的波动特性及其检测方法研究
禹建功
吴斌
北京工业大学
2010022
形变碳纳米管的结构及晶格振动特性研究
Perelman的泛函在Ricci流中一些新的应用
张振雷
方复全
南开大学
2010062
高性能铌酸锂晶体与光电器件产品化的关键技术研究
孙军
许京军
南开大学
2010063
两亲性树枝状嵌段共聚物的合成及其超分子自组装研究
杨淼
王维
南开大学
2010064
头孢噻肟钠结晶技术研究
张海涛
王静康
天津大学
2010065
流动的土地--明清以来黄河小北干流区域社会研究
郁惠蕾
许建和
华东理工大学
2010122
新型环糊精分子梭的合成及性能研究
马骧
RBS
原子无规则 排列
•沟道分析的应用 • 确定晶轴 • 研究晶格损伤 • 确定杂质原子的晶格位置
RBS分析中主要有四个基本概念: 1. 运动学因子:这是一个与两体弹性碰撞后散射离 子所带能量相关的物理量,由被分析元素的质量 决定。 2. 微分散射截面:素的原子序数和入射离子的种类及能量有关。 3. 能量损失:由于入射离子与物质的相互作用,离 子进入靶中出射都要损失能量,这种能量损失与 被分析元素所在深度及基体的性质有关。 4. 能量歧离:由于入射离子与靶原子的相互作用的 统计性,造成背散射离子的能量歧离,它对被分 析元素的质量分辨本领和深度分辨本领有影响。
卢瑟福背散射(RBS)分析
•基本原理
离子背散射分析主要在能量 在几MeV以下的小型加速器上 进行的,来自加速器的带电离子 与靶原子发生弹性碰撞,用探测 器记录被散射的离子的能谱,通 过对能谱的分析可以得到靶中元 素的质量、浓度和深度分布。
★入射离子与靶原子核之间的大角度库仑散 射称为卢瑟福背散射(RBS)
•运动学因子
•微分散射截面
•能量损失
•背散射能谱分析
•卢瑟福背散射的应用
•背散射分析实验设计
弹性反冲探测(ERD)方法 ---轻元素分析
•ERD分析中的基本公式
•ERD分析的应用
•非卢瑟福散射
•沟道背散射分析
间隙原子
完美晶体,原子 有序排列
CERN追寻宇宙奥秘的顶级科学研究机构
CERN追寻宇宙奥秘的顶级科学研究机构CERN(欧洲核子研究中心)是世界上最大的粒子物理实验室,致力于研究宇宙的奥秘和揭开物质的微观结构。
成立于1954年,CERN的使命是通过高能粒子加速器和实验室设施,推动科学界的前沿研究,挖掘物理学、天体学和宇宙学的新知。
CERN位于瑞士日内瓦附近的弗朗什-孔泰市,占地超过640公顷,拥有22个欧洲成员国。
这个研究机构为全球科学家提供了一个交流和合作的平台,吸引了来自世界各地的顶级科学家和研究人员,共同探索宇宙的奥秘。
在CERN的粒子物理实验室内,最引人注目的是世界上最大的粒子加速器——大型强子对撞机(LHC)。
这个巨大的环形加速器拥有27公里的周长,位于地下100米至175米的深处。
LHC使用电磁场将质子或重离子加速到非常高的能量,然后让它们以接近光速的速度相撞。
这样的高能粒子碰撞可以重新创建宇宙大爆炸的极端条件,帮助科学家们更好地理解宇宙的起源和基本物质的构成。
CERN的研究重点主要集中在两个方面:粒子物理和加速器科学。
粒子物理实验的目标是揭示宇宙的基本构建块,从而更好地理解我们的宇宙是如何形成的。
而加速器科学则致力于研究如何更有效地加速和操控粒子,以推动科学研究的进展。
研究人员在CERN进行的粒子物理实验中,利用粒子加速器将高能量粒子聚焦在微小的空间内,然后观察这些粒子在撞击中产生的效应。
通过观察反应产生的粒子,科学家们可以推断原初的粒子特性和相互作用。
这些实验的结果对于我们理解自然界中的基本定律和对物质构成的认识至关重要。
除了大型强子对撞机,CERN还拥有多个其他实验设备,包括一些用于其他粒子物理研究的粒子加速器、探测器和实验室。
在这些设备中,科学家们进行着各种实验,以探索粒子的性质、相互作用和宇宙中的现象。
CERN不仅仅是一个科学研究机构,它还鼓励全球科学界的合作和交流。
CERN的成员国共同致力于共享和推动科学研究的进展。
研究人员和学者们可以通过合作项目、会议和实验来互相交流和分享最新的科学成果。