cy of sample mean X
国际贸易实务部分

一、常用的计量单位 1、重量(Weight) 吨(Metric Ton ,M/T ),公斤(Kilogram, Kg ),克( Gram, g),磅(Pound, lb ),盎司(Ounce, oz )等 2、个数 件、个、只(Piece,pc),套(Set),打(Dozen, doz)等 3、长度 米(Meter,m),英尺(Foot,ft),码(Yard,yd)等 4、面积 平方米(Square Meter,sqm)等 5、体积 立方米(Cubic Meter,cum)等 6、容积 升(Liter,l),加仑(Gallon,gal),蒲耳式(Bushel,bu.)
第五节:佣金和折扣
佣金(Commission)
—— 中间商介绍交易或代买代卖而收取的报酬。 在合同或发票中明示的称“明佣”,常用佣金率表示。 例:USD200/Doz. CIF SAN FRANCISCO INCLUDING 5% COMMISSION . 简写为: USD 200/Doz . CIFC5 SAN FRANCISCO 佣金计算公式:佣金=含佣价×佣金率 净价=含佣价-佣金 佣金一般由卖方收到货款后另行支付给中间商。
第三节 其他七种贸易术语
FAS
Free Alongside Ship ( … named port of shipment ) —— 船边交货 ( … 指定装运港) 卖方的义务是在指定的装运港将货物放置于船边时,交货完成,风险转移。 FAS与FOB类似,主要区别在于交货风险转移点,FAS在船边,FOB在船舷。
国际贸易实务部分
Annual Work Summary Report
汇报人 | 小智
第一节 贸易术语概述 一、贸易术语(Trade Terms) —— 是一种表示在国际贸易中,交易双方有关责任、费用与风险划分的专门用语。 二、关于贸易术语的国际贸易惯例 《1932年华沙-牛津规则》 (Warsaw-Oxford Rules) 《1941年美国对外贸易定义修正本》(Revised American Foreign Trade Definitions 1941) 《2000年国际贸易术语解释通则》(INCOTERMS2000) 该通则由国际商会制定,共分为四组13种。
meanshift算法简介

怎样找到数据集合中数据最密集的地方呢?
数据最密集的地方,对应于概率密度最大的地方。我们可 以对概率密度求梯度,梯度的方向就是概率密度增加最大 的方向,从而也就是数据最密集的方向。
令
,假设除了有限个点,轮廓函数 的梯度对所
有
均存在 。将 作为轮廓函数,核函数 为:
fh,K
x
2ck ,d n nhd 2 i1
Meanshift算法的概述及其应用
Meanshift的背景
Mean Shift 这个概念最早是由Fukunaga等人于 1975年在一篇关于概率密度梯度函数的估计中提出 来的,其最初含义正如其名,就是偏移的均值向量。
直到20年以后,也就是1995年,,Yizong Cheng发 表了一篇对均值漂移算法里程碑意义的文章。对基 本的Mean Shift算法在以下两个方面做了改进,首先 Yizong Cheng定义了一族核函数,使得随着样本与 被偏移点的距离不同,其偏移量对均值偏移向量的贡 献也不同,其次Yizong Cheng还设定了一个权重系 数,使得不同的样本点重要性不一样,这大大扩大了 Mean Shift的适用范围.另外Yizong Cheng指出了 Mean Shift可能应用的领域,并给出了具体的例子。
• 一维下的无参数估计 设X1,X2, …Xn是从总体中抽出的独立同分布
的样本,X具有未知的密度函数f(x),则f (x)的核估计为:
h为核函数的带宽。常用的核函数如下:
分别是单位均匀核函数 和单位高斯核函数
多维空间下的无参密度估计:
在d维欧式空间X中,x表示该空间中的一个点, 表示该空间中的
核函数,
(5)若
,则停止;否则y0←y1转步骤②。
限制条件:新目标中心需位于原目标中 心附近。
origin菜单栏的中文解释
目录File文件 (1)Edit 编辑 (2)View 视图 (2)Plot 绘图 (3)Column 列 (3)Worksheet 工作表 (4)Analysis 分析 (4)Statistics 统计分析 (5)Image 图像 (6)Tools 工具 (9)Format 格式 (9)Windows 窗口 (10)Help 帮助 (10)File文件New 新建 (18)Project项目 (18)Worksheet 工作簿 (19)Matrix 矩阵 (20)Graph 图形 (21)Prom Template 从模板创建 (21)Excel (22)Layout 布局页 (22)Notes 记事本 (23)Function Plot 函数绘图 (24)Open 打开 (27)Open Excel 打开Excel文件 (27)Open Sample OPJ 打开示例项目 (28)Append 追加 (28)Close 关闭 (28)Save Project 保存项目 (28)Save Project As 项目另存为 (28)Save Window As 窗口另存为 (29)Save Template As 模板另存为 (29)Save Workbook as Analysis Template 工作簿另存为分析模板 (30)Save Project as Analysis Template项目另存为分析模板 (30)Import 导入 (30)Import Wizard 导入向导 (31)Customize 定制............................................................................................................. .. (31)Export 导出 (33)Batch Processing 批处理 (34)Database Import数据库导入 (35)Edit 编辑Copy (full precision) 精确复制 (37)Copy (including label rows) 带标识符行复制 (37)Paste Transpose 转置粘贴 (37)Paste Link 粘贴链接 (38)Paste Link Transpose粘贴链接转置 (38)Paste Special 特殊粘贴 (38)Merge (Embedded) Graphs 合并(嵌入)图形 (39)Button Edit Mode 按钮编辑模式 (39)View 视图Toolbars 工具栏 (41)Status Bar 状态栏 (41)Command Window 命令窗口 (42)Code Builder 代码创建器 (42)Quick Help 快速帮助 (43)Project Explorer 项目浏览器 (43)View Windows 视窗 (43)Results Log 结果记录 (44)View Mode (45)Messages Log 信息记录 (46)Actively Update Plots 即时更新图形 (46)Page Break Preview Lines 分页预览线 (46)Print View打印视图 (47)Page 页面视图 (47)Window 窗口视图 (47)Zoom In 放大 (48)Zoom Out 缩小 (49)Whole Page 满页 (49)Show 显示 (49)Show Data Information 显示数据信息 (51)Data Mode 数据模式 (52)Show Column/Row 显示列/行 (52)Show X/Y 显示X/Y (53)Image Mode 图像模式 (53)Show Image Thumbnails 显示缩略图 (53)Plot 绘图Line 线条 (54)Symbol 符号 (55)Line + Symbol 线条+符号 (56)Column/Bar/Pie 柱/条/饼 (56)Multi-Curve 多曲线 (57)3D XYY 三维XYY图 (59)3D XYZ 三维XYZ图 (60)3D Surface 三维曲面图 (60)3D Wire/Bar/Symbol 三维线/柱/符号 (61)Statistics 统计 (62)Area 面积 (65)Contour 等高线图 (65)Specialized 专业图 (66)Stock 股票 (68)Template Library 模板库 (70)Column 列Set as X 设为X (72)Set as Label 设为标记符号 (72)Disregard Column 忽略此列 (73)Set as Y Error 设为Y的误差 (73)Set as Categorical 设为分类数据 (73)Setting Column Values 设定列数值 (74)Fill Column with 填充列 (74)Add New Columns 添加新列 (75)Set Sampling Interval 设置采样间隔 (76)Move Columns 移动列 (76)Show X Column 显示X列 (77)Slide Show of Dependent Graphs 幻灯放映 (77)Add Sparklines 添加拆线图 (79)Worksheet 工作表Sort Range 排序范围 (80)Sort Columns列排序 (81)Sort Worksheet 工作表排序 (81)Clear Worksheet 清除工作表 (81)Worksheet Script 工作表脚本 (81)Worksheet Query 工作表查询 (82)Reset Column Short Names 重置列短名 (83)Split Worksheet 拆分工作表 (84)Split Workbooks 拆分工作簿 (84)Pivot Table 数据透视表 (84)Stack Column 堆列 (85)Unstack Column 拆堆列 (87)Remove Duplicated rows 删除重复行 (87)Reduce Rows 减少行 (88)Transpose 转置 (89)Convert to XYZ 转换为XYZ (90)Convert to Matrix转换为矩阵 (93)Analysis 分析Mathematics 数学运算 (97)Interpolate/Extrapolate Y from X 由X内插/外推求Y (98)Trace Interpolate 迹线外推 (98)Interpolate/Extrapolate 内插/外推 (99)3D Interpolation 三维内插 (100)XYZ Trace Interpolation XYZ 迹线内插 (101)XYZ Surface Area XYZ表面积 (102)Set Column Values 设置列值 (102)Normalize Column. 归一化列 (102)Simple Math 简单数学运算 (103)Differetiate 微分 (104)Integrate 积分 (105)Polygon Area 多边形面积 (105)Average Multiple Curves 多曲线平均 (106)Data Manipulation 数据处理 (106)Subtract Reference Data 与参考值相减 (107)Reduce Duplicate X data 归纳重复的X数据 (108)Reduce by Group 按组归纳 (108)Reduce to Evenly Spaced X 归纳为均匀间隔的X (110)Linear Fit 线性拟合 (112)Fit Linear with X Error 带X误差的线性拟合 (114)Polynomial Fit 多项式拟合 (115)Multiple Linear Regression所谓多元线性回归 (115)Nonlinear Curve Fit 非线性曲线拟合 (117)Nonlinear Surface Fit 非线性表面拟合 (118)Simulate Curve 模拟曲线 (118)Simulate Surface 模拟表面 (119)Exponential Fit 指数拟合 (121)Sigmoidal Fit 反曲拟合 (122)Compare Datasets 比较数据集 (122)Compare Models 比较模型 (123)Signal Processing 信号处理 (125)Smooth 平滑 (125)FFT Filters FFT滤波 (126)FFT (127)Wavelet 小波分析 (129)Convolution 卷积 (132)Deconvolution 反卷积 (133)Coherence 相干性 (134)Correlation 相关性 (135)Hibert Transform希尔伯特变换 (135)Envelope 包络线 (136)Decimation 抽取 (136)Peaks and Baseline 峰和基线 (137)Multiple Peak Fit 多重峰拟合 (138)Single Peak Fit 单峰拟合 (141)Peak Analyzer 峰分析器 (141)Batch Peak Analysis Using Theme 使用主题批量分析 (147)Statistics 统计分析Descriptive Statistics 描述统计 (149)Correlations Coefficient 相关系数 (149)Statistics on Columns 列统计 (151)Statistics on Rows 和统计 (152)Discrete Frequency 离散频率 (154)Frequency Counts 频率计数 (155)Normality Test 正态性检验 (157)2D Frequency Counts/Binning 二维频率计数/分区 (159)Hypothesis Testing 假设检验 (160)One-Sample t-Test 单样本t-检验 (161)Pair-Sample t-Test 配对样本t-检验 (162)Two-Sample t-Test 双样本t-检验 (164)One-Sample Test for Variances 单样本方差检验 (167)Two-Sample Test for Variances 双样本方差检验 (169)ANOV A 方差分析 (170)One-Way ANOV A 单因素方差分析 (170)Two-Way ANOV A 双因素方差分析 (172)One-Way Repeated Measures ANOVA 单因素重复测量方差分析 (174)Two-Way Repeated Measures ANOV A 双因素重复测量方差分析 (176)NonParametric Tests 非参数检验 (178)One-Sample Wilcoxon Signed Rank Test单样本Wilcoxon符号秩检验 (179)Paired Sample Sign Test 配对样本符号检验 (180)Paired Sample Wilcoxon Signed Rank Test配对样本Wilcoxon符号秩检验 (181)Two-Sample Kolmogorov-Smirnov Test 双样本KS检验 (183)Mann-Whitney Test Mann-Whitney检验 (185)Kruskal-Wallis ANOV AKruskal-Wallis方差分析 (187)Moods Median Test 中位数检验 (188)Friedman ANOV A Friedman方差分析 (189)(NPH) K independent Samples K个独立样本 (191)(NPH) Paired Samples 配对样本 (193)(NPH) Two Independent Samples 两个独立样本 (195)Survival Analysis 生存分析 (197)Kaplan-Meier Estimator卡普兰-迈耶估计量 (198)Cox Model Estimator比例风险模型 (199)Weilbull fit Weibull拟合 (201)Multivariate Analysis 多元分析 (203)Principal Component Analysis 主成分分析 (203)K-Means Cluster Analysis K-均值聚类分析 (204)Hierarchical Cluster Analysis 层次聚类分析 (206)Discriminant Analysis 判别分析 (208)Power and Sample Size 功效和样本大小分析 (212)(PSS) One-Sample t-test 单样本t-检验 (212)(PSS) Two-Sample t-test 双样本t-检验 (213)(PSS)Paired t-test 配对样本t-检验 (214)(PSS)One-Way ANOV A 单因素方差分析 (215)ROC Curve受试者工作特征曲线 (216)Image 图像Image adjustments 图像调整 (220)Brightness 亮度 (221)Contrast 对比度 (221)Gamma伽玛值 (221)Hue 色调 (222)Invert 图像色彩翻转 (222)Saturation 饱和度 (223)Histcontrast 直方图对比度 (223)Histequalize 直方图均衡 (223)Auto Level 自动色阶 (224)Color Level 色阶调整 (224)Function LUT 函数搜寻表 (225)Leveling 层次调整 (226)Balance 色彩平衡 (227)Color Replace 颜色替换 (228)Arithmetic transformation 算术变换 (228)Alpha Blend 透明混合 (229)Simple Math 简单数学运算 (230)Math Function 数学函数 (232)Pixel Logic 像素逻辑 (233)Subtract Background 减背景 (234)Extract to XYZ 图像转数据 (235)Morphological Filter 形态学过滤 (236)Replace Background 背景替换 (238)Subtract Interpolated Background 内插背景减影 (238)Conversion 转换 (239)Convert to Data 转成数值 (239)Color to Gray 转换成灰度图....................................................................................... 240 Convert to Image 转换成图像. (241)Binary 转换成二值图 (242)Dynamic Binary 转换成动态二值图 (243)Threshold 阈值 (244)RGB Merge 三原色合并 (245)RGB Splist 三原色拆分 (246)Image Scale 图像比例尺 (247)Geometric Transforms 几何变换 (248)Flip 翻转 (248)Rotate 旋转 (248)Shear 修剪 (249)Resize 调整尺寸 (251)AutoTrim 自动修整 (251)Offset 图像偏移 (252)Spatial Filtering 空间过滤 (254)Average 平均过滤 (255)Gaussian 高斯过滤 (255)Median 中值过滤 (256)Noise 噪音 (257)Edge 边缘.................................................................................................................... 258 Sharpen 锐化................................................................................................................ 258 Unsharpen Mask USM 锐化. (259)User Filter 用户滤镜 (260)Graph 图形 (262)Layer Contents 图层内容 (262)Plot Setup 绘图设置 (263)Add Plot to Layer 层中加图 (263)Add Error Bars 添加误差条 (264)Add Function Graph 添加函数曲线 (265)Rescale to Show All 重置坐标显示全部 (266)Layer Management 图层管理 (266)Add Axis Scrollbar 添加坐标滚动条 (266)New Layer (Axes) 新图层(坐标) (267)Extract to Graphs 提取图层 (268)Apply Palette to Color Map 应用调色板 (270)Merge Graph Windows (271)Speed Mode (271)Update Legend 更新图例 (272)New Legend 新图例 (273)New Enhanced Legend (273)New Table (274)New Color Scale (274)New XY Scaler 新XY比例尺............................................................................................ 275 Set Active Layer By Layer Icon Only ................................................................................... 275 Fit Layer to Graph 图层适合图形....................................................................................... 276 Fit Page to Layers 页面适合图层. (276)Exchange X-Y Axes 交换X-Y坐标 (277)Offset Grouped Data in Layer 偏移图层中的分组数据 (277)Convert to Standard Font Size (277)Data 数据 (278)Set Display Range 设置显示范围 (278)Reset to Full Range 显示全部数据 (280)Mark Data Range 标记数据范围 (280)Clear Data Markers 清除数据标记 (280)Analysis Marker 分析标记 (281)Lock Position 锁定位置 (282)Mask Data Point 给数据点加蒙板 (282)Move Data Point 移动数据点 (283)Remove Bad Data Points 清除坏数据 (285)Gadget 小工具 (285)Quick Fit 快速拟合 (285)Quick Sigmoidal Fit 快速反曲拟合 (287)Quick Peaks 快速峰拟合 (288)Rise Time 上升时间 (289)Cluster 聚类 (289)Statistics (291)Differentiate 微分 (292)Integrate 积分 (293)Interpolate 内插 (293)Intersect 交叉点 (294)FFT 快速傅立叶变换 (295)Vertical Cursor 垂直光标 (295)Layout 布局 (296)Add Graph 添加图形 (297)Add Worksheet 添加工作 (298)Set Picture Holder 开启图像定位 (298)Clear Picture Holder 清除图像定位 (299)New Table 新表格 (299)Global Speed Control 全局速度控制 (300)Tools 工具Options 选项 (301)System Variables 系统变量 (302)Protection 保护 (303)Fitting Function Builder 拟合函数创建器 (304)Fitting Function Organizer 拟合函数管理器 (305)Template Library 模板库 (306)Theme Organizer 主题管理 (306)Import Filters Manager 滤镜导入管理器 (307)Package Manager 包管理器 (308)Customer Menu Organizer 用户菜单管理器 (308)x-Function Builder x-函数创建器 (309)x-Function Script Samples x-函数脚本样本 (309)Copy Origin Sub-VI to LabVIEW User.lib (310)Set Group Folder Location 设置组文件夹位置 (310)Group Folder Manager 组文件夹管理器 (311)Transfer User Files 传递用户文件 (311)Pallet Editor 调色板编辑器 (312)Digitizer 数字转换器 (312)MATLAB Console MATLAB控制台 (313)Mathematica Link 连接Mathematica (314)Format 格式Menu 菜单 (315)Worksheet 工作表 (315)Column 列 (316)Cell 单元格 (317)Snap to Grid 对齐栅格 (317)Programming Control 编程管理 (318)Object Properties 对象属性 (319)Page Properties 页面属性 (320)Layer Properties 图层属性 (320)Plot Properties 图形属性 (321)Snap Layer to Grid 图层对齐栅格 (321)Snap Objects to Grid 对象对齐栅格 (321)Axes 坐标 (321)Axis Tick Labels 坐标刻度 (323)Axis Titles 坐标名称 (323)Windows 窗口Cascade 层叠窗口 (324)Tile Horizontally 水平显示 (324)Tile Vertically 垂直显示 (325)Arrange Ions 排列图标 (325)Refresh 刷新 (325)Duplicate副本 (326)Split 分割 (326)Properties 属性 (327)Command Window 命令窗口 (327)Script Window 脚本窗口 (328)Help 帮助Origin Toolbars 工具栏 (329)Standard 标准 (329)Edit 编辑 (330)Graph 图形 (330)2D Graph 二维图形 (331)3D and Contour Graph 三维图和等高线图 (333)3D Rotation 三维旋转 (334)Worksheet Data 工作表数据 (334)Column 列 (335)Layout 布局 (335)Mask 蒙板 (336)Tools 工具 (336)Object Edit 对象编辑 (337)Arrow 箭头 (338)Style 样式 (338)Format 格式 (339)Auto Update 自动更新 (339)Database 数据库 (340)Markers & Locks 标记和锁定 (340)。
贫血血常规报告英文版
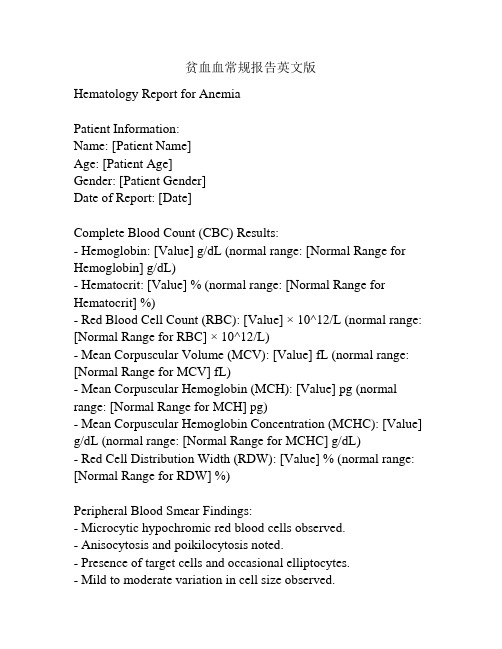
贫血血常规报告英文版Hematology Report for AnemiaPatient Information:Name: [Patient Name]Age: [Patient Age]Gender: [Patient Gender]Date of Report: [Date]Complete Blood Count (CBC) Results:- Hemoglobin: [Value] g/dL (normal range: [Normal Range for Hemoglobin] g/dL)- Hematocrit: [Value] % (normal range: [Normal Range for Hematocrit] %)- Red Blood Cell Count (RBC): [Value] × 10^12/L (normal range: [Normal Range for RBC] × 10^12/L)- Mean Corpuscular Volume (MCV): [Value] fL (normal range: [Normal Range for MCV] fL)- Mean Corpuscular Hemoglobin (MCH): [Value] pg (normal range: [Normal Range for MCH] pg)- Mean Corpuscular Hemoglobin Concentration (MCHC): [Value] g/dL (normal range: [Normal Range for MCHC] g/dL)- Red Cell Distribution Width (RDW): [Value] % (normal range: [Normal Range for RDW] %)Peripheral Blood Smear Findings:- Microcytic hypochromic red blood cells observed.- Anisocytosis and poikilocytosis noted.- Presence of target cells and occasional elliptocytes.- Mild to moderate variation in cell size observed.- Nucleated red blood cells not detected.Interpretation:The hematology report for the patient indicates the presence of microcytic hypochromic anemia. Low hemoglobin and hematocrit levels, as well as reduced red blood cell count (RBC), suggest a possible iron deficiency anemia.The mean corpuscular volume (MCV) is below the normal range, indicating smaller than normal red blood cells. Mean corpuscular hemoglobin (MCH) and mean corpuscular hemoglobin concentration (MCHC) are also reduced, further supporting the diagnosis of hypochromic anemia.The peripheral blood smear findings show microcytic cells with reduced color intensity (hypochromia). Additionally, anisocytosis (variation in cell size) and poikilocytosis (abnormal cell shapes) are present. The presence of target cells and occasional elliptocytes further supports the diagnosis of iron deficiency anemia.The absence of nucleated red blood cells suggests that the anemia is not due to increased destruction or ineffective production of red blood cells.Further investigation is needed to determine the underlying cause of the anemia, such as iron deficiency, chronic disease, or other nutritional deficiencies. Additional tests, medical history review, and possibly consultation with a hematologist or other specialists may be required for a comprehensive diagnosis and appropriate treatment.。
BD FACSCanto

Designing BD™ CBA Flex Set Templates for Flow Cytometers RunningBD FACSDiva™ SoftwareThe following setup procedure is for the BD FACSCanto™, BD™ LSR II, and BD FACSAria™ flow cytometers.1. Prepare 5 tubes labeled: A9, PE-F1, F1, F9, and A1. Vortex the stock vials of beads, add 200 µl of Wash Bufferto each tube followed by 25 µl of the corresponding setup beads.2. Edit the parameters list to display only the following: FSC-A, FSC-W, SSC-A, SSC-W, PE-A, APC-A, andAPC-Cy7-A.3. On a global worksheet, create the following plots: FSC-A/SSC-A dot plot, APC/APC-Cy7 dot plot, and PEhistogram.4. Set FSC-A and SSC-A to Log and create a statistics view showing the FSC-A and SSC-A means. Set the eventsto display to 500. Using the A9 setup beads, adjust FSC and SSC so that the singlet beads have a mean of30,000 for each parameter. Stop acquisition to avoid running out of sample.5. Adjust the FSC-A and SSC-A thresholds using the mean channel as a guideline. Be sure that the thresholdsdo not cut into the bead population.6. In the FSC-A vs SSC-A dot plot, create a region that includes the singlet population of beads. In thePopulation Hierarchy, rename that region singlet.7. Edit the statistics view to display the PE, APC, and APC-Cy7 mean of the singlet beads.8. Through the singlet gate, run the A9 setup beads and adjust the APC and APC-Cy7 voltages until the meanof each parameter is 160,000 ±2,000.9. Through the singlet gate, run the PE-F1 tube and adjust the PE voltage so that the mean is 65 ±5.10. Create compensation controls and delete the PE compensation tube. Run beads as follows for compensationcontrols:Unstained: F1APC Stained: F9APC-Cy7 Stained: A111. Calculate compensation.12. Optional: Verify instrument settings prior to analyzing the assay by recording a sample using the remainingmixed capture beads from the Flex Set assay, export as FCS2.0, and go to Tools > Clustering Test in FCAPArray to see if it can identify the correct number of bead clusters.Set events to record to 300 events per analyte (eg, 300 x 6 = 1800 events for a 6 plex) and set the singlet gate as the storage gate and stopping gate to ensure that only singlet bead events are recorded. Change events to display to 5,000. Record samples and export as FCS2.0 files for analysis in FCAP Array.The Experiment can be saved as a template for future experiments, however it is recommended to verify instrument settings (ie, voltages and compensation) prior to each experiment.Page 1 of 2BD BiosciencesFor country-specific contact information, visit /how_to_orderUnless otherwise specified, all products are for Research Use Only. Not for use in diagnostic or therapeutic procedures. Not for resale.TroubleshootingProblem Possible SolutionBead clusters merging or failure to identify correct number of clusters Check daily QC results for indications of poor laser alignment (increased CV) or PMT sensitivity (decreased MFI at QC instrument settings).Verify that the Window Extension is appropriately set. Approximate values are as follows:BD LSR II: 10BD FACSCanto: 7BD FACSAria: 2Adjust flow rate. Resolution can improve at lower flow rates.Debris (FSC/SSC) during sample acquisition Increase the threshold or enable dual FSC and SSC thresholds. Establish the bead singlet gate asthe storage gate and the stopping gate. Use caution as excluded events cannot be recoveredpost-acquisition.Low event count The beads can precipitate, thoroughly vortex individual capture bead bulk vials prior topreparation of master bead mix and vortex the master bead mix prior to dispensing intothe individual sample tubes. Vortex sample tubes prior to acquisition.Ensure the stopping gate, storage gate, singlet gate, and thresholds are set correctly.Avoid aspiration of beads during wash step.Page 2 of 2BD BiosciencesFor country-specific contact information, visit /how_to_orderUnless otherwise specified, all products are for Research Use Only. Not for use in diagnostic or therapeutic procedures. Not for resale.。
testo 184 USB型 运输数据记录仪 使用手册说明书

testo 184 · USB型 运输数据记录仪 使用手册21 内容1内容1内容 (3)2安全与环境 (4)2.1.关于此文档 (4)2.2.确保安全 (4)2.3.保护环境 (4)3说明 (5)3.1.使用 (5)3.2.技术数据 (5)4产品描述 (15)4.1. LED 状况 (15)4.2.显示器(LCD) (16)4.3.按键功能 (17)4.4.重要信息和术语解释 (19)5产品使用 (21)5.1.配置数记录仪 (21)5.2.测量 (23)5.3.读取数据 (24)6产品维护 (26)6.1.更换电池 (26)6.2.清洁仪器 (27)7提示和帮助 (28)32 安全与环境2安全与环境2.1.关于此文档应用>本操作手册是本产品的一个重要组成部分。
>在使用之前仔细通读本文档并熟悉本产品。
要特别注意安全说明和警告,以避免人员受伤和产品损坏。
>请将本文档放在附近,以便在需要时可查阅。
>确保产品的后续用户能够阅读本操作手册。
2.2.确保安全>请正确操作本产品,本产品只能用于指定用途,并且在设定技术数据的参数范围内使用。
请不要强行操作。
>如果外壳损坏,请勿使用本产品。
>只可按照文件中的规定对此设备执行维护和修理工作。
应当严格地遵照规定步聚。
只能使用 Testo 原装备件。
2.3.保护环境>根据合理且合法的规范处理有问题的可充电电池/废弃电池。
>使用寿命到期后,请把本产品送至电子电气装置分类收集处(请遵循当地法律法规),或者返回 Testo 进行处理。
WEEE Reg. Nr. DE 7533435243 说明533.1. 说明使用testo 184 USB 型数据记录仪用于存储和读取单个测量值和测量序列。
它们是专为冷链产品的运输监控而设计。
温度和湿度测量值在整个测量程序持续期间被存储。
加速度测量值在整个测量程序持续期间被监控,并在超过设定的限制值时被存储。
python 散点拟合圆 最小二乘法

python 散点拟合圆最小二乘法在Python中,我们可以使用最小二乘法对散点进行拟合,从而找到最佳拟合圆。
首先,我们需要导入一些必要的库,如numpy和scipy:```pythonimport numpy as npfrom scipy.optimize import least_squares```接下来,我们定义一个函数来计算圆心和半径的误差:```pythondef calculate_residuals(params, x, y):# 提取圆心坐标和半径cx, cy, r = params# 计算每个点到圆的距离distances = np.sqrt((x - cx) ** 2 + (y - cy) ** 2) - rreturn distances```然后,我们定义一个函数来拟合散点:```pythondef fit_circle(x, y):# 初始估计值cx_initial = np.mean(x)cy_initial = np.mean(y)r_initial = np.mean(np.sqrt((x - cx_initial) ** 2 + (y - cy_initial) ** 2))# 初始参数params_initial = np.array([cx_initial, cy_initial,r_initial])# 用最小二乘法进行拟合result = least_squares(calculate_residuals,params_initial, args=(x, y))# 提取拟合结果cx_fit, cy_fit, r_fit = result.xreturn cx_fit, cy_fit, r_fit```最后,我们可以使用上面的函数来拟合散点并得到最佳拟合圆:```python# 输入散点坐标x = np.array([1, 2, 3, 4, 5])y = np.array([2, 4, 6, 8, 10])# 拟合散点cx_fit, cy_fit, r_fit = fit_circle(x, y)# 输出最佳拟合圆的圆心和半径print("最佳拟合圆的圆心坐标为 ({}, {}),半径为 {}。
常用中英对照表

試制
設計核準 導入 導出 處理周期 開發試制 工程試制 生產試制 大量投產 量產核準 工程通報 工程變更申請 工程變更公告 工程臨時變更公告 工程變更指令 製程變更通知 原始變更公告 設計變更通知 變更總結會議
Engineering Change Order Manufature Notice or Factory Notice Proto-type Change Notice Design Change Notice Change Review Board
Version: A-1 Date: 1-03-2001
Chinese 中文 制程工程 產品工程 項目工程 測試工程 工業工程 電子工程 機構工程 製造工程 零件工程 專案經營管理 資料中心
Process Engineering Product Engineering Project Engineering Testing Engineering Industrial Engineering Electronic Engineering Mechanicl Engineering Manufacturing Engineering Component Engineering Operation Project Management Document Control Center New Project(新機種) Trial Run Pilot Run Comercial Release Design Release Phase In Phase Out Lead Time Lab Pilot Run Engineering Pilot Run KIKK Mass Production Mass Production Release Engineering Change (工程變更 ) Engineering Notice Engineering Change Engeneering Change Notice
- 1、下载文档前请自行甄别文档内容的完整性,平台不提供额外的编辑、内容补充、找答案等附加服务。
- 2、"仅部分预览"的文档,不可在线预览部分如存在完整性等问题,可反馈申请退款(可完整预览的文档不适用该条件!)。
- 3、如文档侵犯您的权益,请联系客服反馈,我们会尽快为您处理(人工客服工作时间:9:00-18:30)。
• SD(X-Y) = sqrt [ SD(X)2 + SD(Y)2] < SD(X) + SD (Y)
• • Let X1 , X2 be the length of two independent phone calls (the phone call example : mean=2.5 minutes, SD=1 minute) • Let T=X1+X2 • What is the variance of T? (=1+1) SD of T? (=sqrt 2) • Sample size n=4 • T= X1 + X2 + X3+X4 • Var (T) = 1 + 1 + 1 + 1 =4 SD(T)= sqrt 4 =2
Another example: from page 305 of book
• • • • • • Individual 2-SE interval 2-SE interval for the difference Overlapping case Mean X=14, SE =1.2 Mean Y=10, SE=1.1 SE for difference of mean = sqrt (1.22+1.12)=1.627
=Squared root = sqrt
Difference of two sample means
• Assume independence • Example: Does body position for epidural injections affect labor pain? Page 303, textbook, National Women’s Hospital in Auckland : number of spinal segments blocked by the anesthetic • Lying group : n1 =48, mean=8.8, SD=4.4 • Sitting group : n2=35, mean=7.1, SD=4.5 • Question : do we have enough evidence to tell which is better? • SD of difference in mean = .9909, two-standard error interval : [-0.3, 3.7]. Ans. No.
Lecture 7 Accuracy of sample mean X
Var (X)= Var (X) divided by sample size n
What is X bar ? Called sample mean. Standard error of the mean =SD(X) = SD (X) divided by squared root of n As sample size increases, the sample mean become more and more accurate in estimating the population mean • Sample size needed to meet accuracy requirement
Sum of independent random variables from box A, mean µ, SD σ dependent draws X= average of n independent draws
• • • • Var (T) = n σ2 ; SD(T)= sqrt n times σ ; X = T/n SD(X)= SD(T) / n = σ/ sqrt n