Lab 9- Content Server Development Tool
Windows Insider Program 企业版注册指南说明书

ContentsGeneral: How to Register for the Windows Insider Program for Business 2 General: How to Install Your First Windows 10 Insider Preview Build3 General: How to Switch to Your Corporate AAD Account if You Are Already Enrolled4 General: Windows 10 Insider Preview Builds5 General: Windows Insider Program Rings 6 General: Types of Updates 7 General: Sharing Feedback Via the Feedback Hub 8 General: Obtaining Information and Assistance8 PC: Switching Between Flight Rings9 PC: Not Receiving Windows 10 Insider Preview Build Updates?9 PC: Exiting Flighting on a PC 10 General: How to Register for theWindows Insider Program for BusinessMake sure your corporate credentials are on Azure Active Directory (AAD)Sign-in using your corporate account in Azure Active Directory andfollow the on-screen instructionsOnce you have registered for the Windows Insider Program for Business, you may now enroll your devices to get Windows 10 Insider Preview Builds Please refer to the section titled “General: How to install your first Windows 10 Insider Preview Build”General: How to Install Your First Windows 10 Insider Preview BuildOnce you have registered for the Windows Insider Program for Business, you will then need to enroll your devices to get Windows 10 Insider Preview builds Here’s how:1 Make sure your PC has Windows 10 Version 1703 installed To verify, go to Settings >System > About If you do not have Version 1703, go to Start > Settings > Update & Security > Windows Update and click Check for updates )2 If you haven’t already registered your corporate credentials (in AAD), go toinsider windows com (See How to register for the Windows insider Programfor Business )3 Go to Start > Settings > Update & Security > Windows Insider Program (To view thissetting, make sure that you have administrator rights to your machine and that it has latest Windows updates )4 Select Get started5 Click Sign In and enroll your device with the same corporate account that you used toregister for the Windows Insider Program for Business6 Click Get started again, read the privacy statement and program terms, and click Next7 Click Confirm, and then select a time to restart the computer8 After you restart the device, go to Start > Settings > Update & Security > WindowsInsider Programto select your Insider levelThe Windows Insider Program for Business now gives users the option to register and enroll devices using a corporate account inAzure Active Directory (AAD)In order to get the most benefit out of the Windows Insider Program for Business, organizations should not use a test tenant of AAD. There will be no modifications to the AAD tenant to support the Windows Insider Program as it will only be used as an authentication method. If you are already registered in the Windows Insider Program with your Microsoft account (MSA), follow these steps to register for the Windows Insider Program for Business using your AAD account – and enroll your devices for Windows 10 Insider Preview Builds:To Register for the Windows Insider Program for Business1 Make sure your corporate credentials are on Azure Active Directory (AAD)(Note: only corporate credentials on AAD can be used for the Windows Insider Program for Business ) On your PC, go to Settings > Accounts > Access work or schoolIf your organization has set up your corporate account in AAD and it is connected to your PC, you will see the account listed2 Register your AAD account Visit https://insider windows com If you are signed in withyour Microsoft account, sign out, then sign in with your corporate AAD account3 Click Get started, read and accept the privacy statement and program terms and click SubmitTo Enroll Your Device for Windows 10 Insider Preview Builds4 Make sure your PC has Windows 10 Version 1703 installed To verify, go to Settings >System > About If you do not have Version 1703, go to Start > Settings > Update & Security > Windows Update and click Check for updates )5 On your Windows 10 PC, go to Settings > Update & Security > Windows Insider Program6 Under Windows Insider account, click your Microsoft account, then Change to open aSign In box7 Select your corporate account and click Continue to change your account (Note: yourdevice must be connected to your corporate account in AAD for the account to appear in the account list )Quick FAQ1 Will my test machines be affected by automatic registration?All devices enrolled in the Windows Insider Program (physical or virtual) will receiveWindows 10 Insider Preview builds (regardless of registration with MSA or AAD)2 Once I register with my corporate account in AAD, do I need to keep my Microsoftaccount for the Windows Insider Program?No, once you set up your device using AAD credentials – all feedback and flighting on that machine will be under your AAD account You may need MSA for other machines that aren’t being used on your corporate network or to get Windows store app updates 3 How do I stop receiving updates?You can simply “unlink” your account by going to Settings > Update & Security >Windows Insider Program, select Windows Insider Account and click UnlinkGeneral: How to Switch to Your CorporateAAD Account if You Are Already EnrolledGeneral: Windows 10 Insider Preview BuildsWindows 10 Insider Preview builds are a preview for PC experts Including Windows 10 Insider Preview builds in your deployment plans allows you to roll out new services and tools more quickly for your organization and end usersWhat Languages are available?Insider Preview builds are available in the following languages: English (United States), English (United Kingdom), Chinese (Simplified), Chinese (Traditional), Portuguese (Brazilian), Japanese, Russian, German, French, French (Canada), Korean, Italian, Spanish, Spanish (Latin America), Swedish, Finnish, Turkish, Arabic, Dutch, Czech, Polish, Thai, Catalan, Hindi, and VietnameseNote:• If your Windows build is not in one of the available base languages, you will not receive Insider Preview builds• Hindi, Catalan, and Vietnamese can only be installed as a language pack over supported base languages• To learn how to install a language pack, see How to add an input language to your PCAdditional Resources:• Learn about updates and servicing branches• Prepare servicing strategy for Windows 10 updates• Build deployment rings for Windows 10 updates• Assign devices to servicing branches for Windows 10 updates (this topic)• Optimize update delivery for Windows 10 updates• Manage updates using Windows Update for Business• or Manage Windows 10 updates using Windows Server Update Services• or Manage Windows 10 updates using System Center Configuration ManagerWhat is Flighting?Flighting rings are used to evaluate the quality of our software as it is released to progressively larger audiences. We will flight a Feature Update, application, etc. to the first ring if it passes all required automated testing in the lab. The flight will continue to be evaluated against a set of criteria to ensure it is ready to progress to the next ring In order to get faster builds to Insiders, we are changing the ordering of how we promote builds between rings, the ring progression criteria, and adding a new ringAdditional Resources:• Build deployment rings for Windows 10 updatesGeneral: Windows Insider Program RingsWhat are Rings?•The Windows Insider Program has several “Ring” options to select from •There are private rings inside Microsoft that map to rings available to Insiders • Each ring presents a different level of stability and is delivered on a different cadence A more rapid cadence means quicker access to buildsWhat do each of the Rings mean?The Fast RingThe benefit of being in the Fast Ring is that you will be able to use and provide feedback on new and improved features first!• Windows Insiders with devices in the Fast Ring should be prepared for more issues that may block key activities that are important to you or may require significant workarounds.• Because we are also validating a build on a smaller set of devices before going to Fast, there is also a chance that some features may work on some devices but may fail in other device configurations.• Windows Insiders should be ready to reinstall Windows using the Media Creation Tool or Windows Device Recovery Tool when you are significantly blocked.• Please remember to report any issue to us through the Windows Insider Feedback Hub or the Windows Insider community Forum The Slow Ring The benefit of being in the Slow Ring is that the builds here are generally more stable on the Development Branch • Builds are sent to the Slow Ring after feedback has been received from Insiders within the Fast Ring and analyzed by our Engineering teams • These builds will include updates to fix key issues that would prevent many Windows Insiders from being able to use the build on a daily basis • These builds are still from the Development Branch and may have issues that would be addressed in a future flight. The Release Preview Ring The benefit of being in the Release Preview Ring allows Insiders to be on the current public release of Windows 10 but get early access to updates, applications, and drivers without taking the risk of moving to the Development Branch•The Release Preview Ring will only be visible when your Windows build version is the same as the Current Branch • The easiest way to go between the Development Branch to the Current Branch is to use the Media Creation Tool (for PC) or Windows Device Recovery Tool (for Mobile) toreinstall WindowsRing Descriptions The Fast Ring Best for Insiders who enjoy being the first to get access to builds and feature upgrades, with some risk to their devices in order to identify issues, and provide suggestions and ideas to make Windows software and devices greatThe Slow RingBest for Insiders who enjoy getting early access to builds and feature upgrades, with less risk to their devices, and still want to provide feedback to make Windows software and devices greatThe Release Preview RingBest for Insiders who enjoy getting early access to updates for the Current Branch, Microsoft applications, and drivers, with minimal risk to their devices, and still want to provide feedback to make Windows devices greatGeneral: Types of Updates Major Builds Fast Ring Slow Ring Release Preview Ring Minor/Servicing Builds After registering with the Windows Insider Program for Business and installing your first Windows 10 Insider Preview build, you will begin to receive updates to the device(s) you have chosen to participate in flighting.During the development process, you will notice the build number changing with each update Historically this has been normal for Mobile builds, however with the introduction of Windows 10, this is now also the case for PC builds as well As you take future updates, you’ll notice two different types of builds being delivered to your device(s):What to Expect in Each RingWhile there is no set requirement for how build numbers are delivered to each ring, you will in general find the following to be true:When a major build is released, this will include any combination of new features, updates to existing features, bug fixes, application changes, or other additional changes For a major build, you will see the build number increment by 1 or more Build numbers may or may not be consecutive based upon passing internal ring promotion criteriaExample: 14361 -> 14365Update Cadence: Major build releases, very few servicing buildsUpdate Cadence: Major build with minor build fixes attached.Update Cadence: Major build change at a release milestone and then a continued series of servicing builds until the next release milestone is reachedAlso known as “Servicing” or “Cumulative” updates, these builds represent a smaller set of changes to a currently-released major build Servicing builds often include bug fixes, minor OS updates, or other smaller changes as needed.Example: 14361 -> 14361 1002 -> 14361 1003General: Sharing Feedback Via the Feedback Hub General: Obtaining Information and AssistanceAs you know a key benefit to being a Windows Insider is Feedback.Feedback is vital for making changes and improvements in Windows 10 The partnership between Insiders and Microsoft helps us not only gauge product satisfaction and build quality, but it is instrumental in guiding conversations regarding what changes to make within the OS Receiving quality and actionable feedback is key in achieving these goals When providing feedback, please consider the following:1 Please use the Feedback Hub App to submit your feedback on Windows 10 features and functionality to Microsoft2 Check for existing feedback on the topic you are preparing to log Another user may have already shared the same feedback If they have, please “upvote” the existing feedback to help prevent duplicate submissions Adding additional comments to existing feedback can help others by providing clarity to existing information or additional scenarios to review3 Provide as much information to us as possible: include reproduction steps, screenshots, any detail you think would help us experience the issue as you have, so that we can work on a fix and get it into a new build as soon as possible.How to Use Your Corporate Account for Additional Feedback Hub BenefitsSign in to the Feedback Hub App using the same corporate account in AAD that are using to flight builds. One of the benefits of submitting feedback using your AAD account is the addition of a page to the Feedback Hub for your organizationSimply click the My Company page in the feedback hub to see and upvote all feedback submitted by other Insiders in your organization Note: If you signed into the Feedback Hub previously with your MSA, your feedback and badges will not be transferred to your AAD sing-in However, you can switch back to your MSA account in the Feedback Hub to access feedback you’ve submitted and badge you’ve earned The Windows Insider Program for Business enables IT Pro’s to deepen connections within their organization, to learn from peer experts and to connect to global subject matter experts who understand the unique challenges of working in IT because they do too We offer the following support in the event you hit a snag or have a question.PC: Switching Between Flight RingsPC: Not Receiving Windows 10 Insider Preview Build Updates?During your time in the Windows Insider Program, you may want to change between flight rings for any number of reasons. Changing rings is a simple process that requires only a few clicks:1 Go to Start > Settings > Update & Security > Windows Insider Program2 Under Choose Your Level , select between the following rings:•Windows Insider Fast •Windows Insider Slow • Release Preview For information on the various rings and what they represent, please refer to the “What do Each of the Rings Mean?” tutorial for details In some cases, your PC may not update to the latest Insider Preview build as expected Here are items that you can review to troubleshoot this issue:Perform a Manual Check for Updates•Open Settings •Open Update & Security •Review available updates or select Check for Updates • Note: If you have set Active Hours, ensure your device is left turned on and signed in during the off-hours so the install process can complete Is your copy of Windows activated?• Review the “Windows License Verification ” article for validation steps Is your corporate account in AAD connected to your PC enrolled for flighting?• Open Settings > Accounts > Access work or school • If your PC is not listed as connected to your account in AAD, click Connect and enter your AAD account Have you selected a flight ring on the PC?• Open Settings • Open Update & Security • Open Windows Insider Program • Select your Flight Ring Have you recently done a roll-back?• If so, please double-check your flight settings, including ring-selection, Microsoft Account, and branch-selection Did you do a clean install?• After a clean-install and initial setup of a Microsoft account (even one that has been used previously for flighting) the appropriate targeting needs to take place for your PC•This background process is known as Compatibility Checker and will run during idle time on your PC This may take up to 24 hours Please leave your PC turned on to ensure this occurs in timely manner Are there any known issues for your current build?• On rare occasion, there may be an issue with a build that could lead to issues with updates being received Please check the most recent Blog Post or reach out to the Windows Insider team on Twitter for verification (@Windows Insider ) • Additional Resources: More tips on “Not Being Offered a New Build ”PC: Exiting Flighting on a PCWhile participating in the Windows Insider Preview program, you may find it necessary to stop receiving new Windows 10 Insider Preview builds on a particular PC Here’s how to stop receiving further builds:1 Go to Start > Settings > Update & Security > Windows Insider Program2 Select Stop Insider Preview builds This gives you the option to pause Insider Preview builds or restore the previous version ofWindows that was installed on your PCNote• You can only restore the last version of Windows that was installed on your machine prior to your current Windows Insider Preview build If you want to return to an earlier, publicly available retail version of Windows, you will need to re-install thatimage directly to your PC• This will overwrite all data on the PC Please ensure you take a backup of all important data and information prior to doing this • If you would prefer to stop fighting and not reimage your PC, it is best to wait until the announced end of a development cycle.This will leave your machine on the appropriate build to receive updates via the Retail path without needing to flash your PC.。
Oracle Communications Consulting (OCC)自动化测试套件版本1.0
1 DATA SHEET | Oracle Communications Consulting (OCC) powers up Automated Test Suite | Version 1.0 Copyright © 2020, Oracle and/or its affiliates | Confidential – PublicOracle Communications Consulting (OCC) powers up Automated Test SuiteManual testing has classically come at a high cost of resources to run and maintain, is time-consuming, lacks proper coverage and is error-prone due to repetitiveness. This has led to the introduction and attractiveness of automating these tests. Automation testing is used to improve the execution speed of verification, checks or any other repeatable tasks in the software development, integration and deployment lifecycle.The return on investment between manual versus automated testing has been a balancing act. Historically, automated testing has required investment in tools costs, setup of test cases, and then the maintenance/updating of those tools & test cases.Today’s Service Providers need a test automation tool that improves their time-to-market, reduces costs, extends their testing scope, and in turn, increases their quality and their customers’ experience. In addition, they need to roll out new software versions and new platforms quickly, test configuration changes, and expand/grow their networks all while maintaining core network resiliency and high-availability as they roll out newservice plans. According to a recent survey by GitLab with over 3,600 respondents from 21 countries, 47% claim testing is their number one reason for delays, 74% have shifted testing earlier in the deployment process, 35% claim they are half-way there to implementing automated testing and only 12% have implemented full test automation.The Oracle Communication Automated Testing Suite (ATS) is a software that is used on the system under test to check if the system is functioning as expected and provides end-to-end and regression testing of 4G & 5G scenarios, including interworking test cases and Network Function (NF) emulation. This Jenkins-based open-source automation server is flexible enough that the user can create additional test cases using the APIs provided by the framework to automate all manner of tasks related to building, testing, delivering or deploying software.ORACLE COMMUNICATIONS CONSULTING ACTIVATES OC-ATSLeveraging decades of experience in core network solutions deployment and testing, depth knowledge of telco and ITprotocols and call flows, our consultants are equipped and ready to customize and expand the capabilities of your OC-ATC for automated functional testing, regression testing, load testing and test process management. Building on the included test cases in the suite and developed custom testing accelerators, OCC works with our customers to develop bespoke test cases and reports specific to your network and business needs.Oracle Communications Consulting maximizes your Investment in OC-ATS by:ATS Installation and ConfigurationCustom test cases and reports developmentTest cases and reportmodifications according to customer network and services evolutionBenchmarking and capacity planning testingTraffic generation for specific call testing or network scenarios customizationRegression test executionsimplification with scheduling & custom reportsCONNECT WITH USCall +1.800.ORACLE1 or visit .Outside North America, find your local office at/contact ./oracle/oracleCopyright © 2020, Oracle and/or its affiliates. All rights reserved. This document is provided for information purposes only, and the contents hereof are subject to change without notice. This document is not warranted to be error-free, nor subject to any other warranties or conditions, whether expressed orally or implied in law, including implied warranties and conditions of merchantability or fitness for a particular purpose. We specifically disclaim any liability with respect to this document, and no contractual obligations are formed either directly or indirectly by this document. This document may not be reproduced or transmitted in any form or by any means, electronic or mechanical, for any purpose, without our prior written permission.This device has not been authorized as required by the rules of the Federal Communications Commission. This device is not, and may not be, offered for sale or lease, or sold or leased, until authorization is obtained.Oracle and Java are registered trademarks of Oracle and/or its affiliates. Other names may be trademarks of their respective owners.Intel and Intel Xeon are trademarks or registered trademarks of Intel Corporation. All SPARC trademarks are used under license and are trademarks or registered trademarks of SPARC International, Inc. AMD, Opteron, the AMD logo, and the AMD Opteron logo are trademarks or registered trademarks of Advanced Micro Devices. UNIX is a registered trademark of The Open Group. 0120Disclaimer: This document is for informational purposes. It is not a commitment to deliver any material, code, or functionality, and should not be relied upon in making purchasing decisions. The development, release, timing, and pricing of any features or functionality described in this document may change and remains at the sole discretion of Oracle Corporation.CI/CD PIPELINE METHODOLOGYRecognizing that each customer’s network and needs are different, OCC designs different CD Pipelines specific to these needs. For example, in the case of a new software release, ATS use case tests are deployed automatically against the new software.ORACLE COMMUNICATIONS CONSULTING EXTENDS THE FUNCTIONALITY AND CAPABILITIES OF YOUR OC-ATSAs your network traffic evolves, so must your OC-ATS test cases and reports. It isimportant that OC-ATS undergoes regular test cases reviews and that adjustments are made or new use cases tests are developed. In today’s virtualized and cloud native environments, where 4G/5G applications are no longer deployed onproprietary hardware, changes in underlying environments can happen, and often outside the control of Service Providers. It is of critical importance that regression testing is powerful, is customized to your needs and delivers meaningful reports and data. The ability to quickly deploy these new test cases is especially critical for interworking and policy rule case additions which can be done expeditiously, run daily and include subscriber/subscription lifecycle.These OC-ATS extensions include, but are not limited to: end-to-end use cases, customer ad-hoc use cases, enhanced use case validation, a test scheduler and reports, and a test creation user interface. In addition, OCC can enhance OC-ATS with additional capabilities, such as network topology, NF simulators, chaos testing, hybrid/public cloud hosting and integration with customer toolchain.TRUST THE EXPERTSOCC possess both the intimate knowledge of the elements under test in your 4G/5G network and the ATS framework to quickly design and develop the test cases and reports your company needs to continually check and ensure your solution is running smoothly and optimally with the minimum use of your resources. In today’s Cloud environ ments, it is necessary to continually check the integrity and health of the entire end-to-end solution and alert to any issues network or elemental changes have introduced. This is only possible with continual automated testing which has been powered by Oracle Communications Consulting.Oracle Communications Consulting extends your OC-ATS with:Evolution and Maintenance Ad-hoc Test CasesPowerful Regression Testing Extended CapabilitiesOut-of-the-box Standalone NF Test Cases Modifications Test Scheduler Custom ReportsChaos Testing。
LMS Virtual.Lab 9 10安装方法
LMS b R9 R10安装方法LMS b第9版和第10版发布之后,很多朋友在网上到处搜寻安装方法,很多只能找到原来8B甚至以前的安装方法。
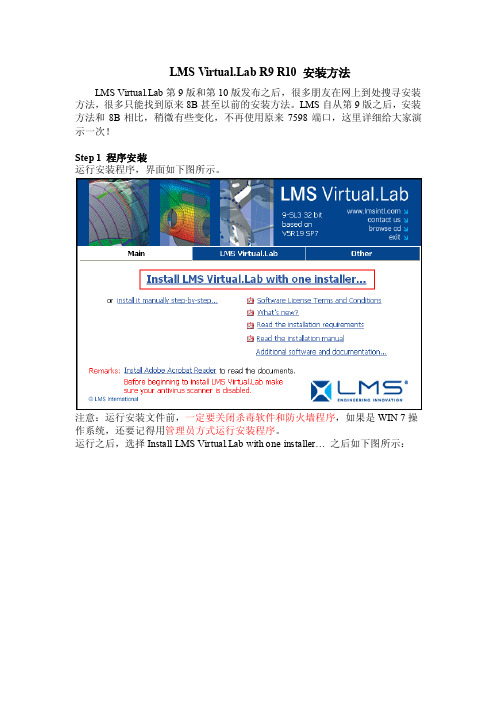
LMS自从第9版之后,安装方法和8B相比,稍微有些变化,不再使用原来7598端口,这里详细给大家演示一次!Step 1 程序安装运行安装程序,界面如下图所示。
注意:运行安装文件前,一定要关闭杀毒软件和防火墙程序,如果是WIN 7操作系统,还要记得用管理员方式运行安装程序。
运行之后,选择Install LMS b with one installer…之后如下图所示:点击Next之后弹出安装路径选择框,如图所示:这里注意:可以更改VL的安装盘符,但是千万不要更改安装路径,否则可能造成程序无法运行。
我这里选择安装在D盘。
然后点Next,如下图所示。
安装程序自动填写了本机的计算机名,此处不要更改!!!这个计算机名在后面证书中也要用到,可以在“我的电脑”中查看,如果有朋友不会查看,请记住此处的计算机名。
直接点击Next,如下图所示:这里询问是否安装LMS On-line help,这里面有很多帮助文档,还有部分计算算例,建议安装,选择Y es,然后点击Next,如下图所示:这里点击Install,然后就进入了程序的拷贝阶段,如下图所示:这个过程稍微有点长,安装成功后,弹出下对话框:点击Finish完成安装。
Step 2 证书配置首先,我声明一点,我这里演示的证书来源于网络,可以在很多地方下载到,我这里仅仅是作为一个演示,如果作为商业用途,请联系LMS公司购买正版软件,谢谢大家合作!找到license.dat文件,用记事本方式打开它,如下图所示:找到图中红线框中标注的位置,修改其中的localhost为你的计算机名,VENDOR 后面指定LMS_INTL.exe文件的位置,例如按照我上述安装方法,修改之后如图所示:注意:计算机名一定要正确,并且不要改计算机名后面的any。
NuMicro Ecosystem用户指南说明书

2021 1st Online Workshop Practice for Very Beginner –Get Started by Quick StartSuyuMarch, 2021Agenda•NuMicro® Ecosystem•Nuvoton Golden 3 Steps•NuMaker Board Unboxing & Introduction •Practice for Very Beginner –Get Started by Quick Start •SummaryNuMicro® EcosystemDevelopment Platform Digital PlatformNuMicro ®Ecosystem –Detailed ViewNuMicro Microcontroller PlatformIoT PlatformAndroid APP iOS APPReference Design PlatformDALIBMSHMIIIoT GatewayThermostat…GUI Platform8051 / M0 / M23 / M4 / Arm9 based MicrocontrollerAlibaba CloudProduct Information / Documents / SelectionEvaluation Board NuMaker Series / NuTiny SeriesDebugger & ProgrammerNu-Link / Nu-Link-Pro / Nu-Link2-ProNu-Link-GangPinView / PinConfig / ClockConfig ICP Programming ISP ProgrammingSoftware Tool BSPMCU BSP / Linux BSPSample Code NuCodeGenGithub / Gitlab / GiteeIDENuEclipse•Sample & Buy:Nuvoton Direct / TechDesign / DigiKey / Tmall •Online Support : NuForum / Sales Support Mailbox / Online Chat•Social Media & Knowledge Base : LinkedIn / Facebook / Twitter / WeChat •Video Platform : YouTube Channel / Tencent Video Channel / bilibiliNuvoton Golden 3 StepsGolden 3 Steps2 Mass Production3 Upgrade1DevelopmentGolden 3 Steps -DevelopmentGolden 3 Steps Nu-LinkUSBDebugger &ProgrammerIDEBSPNuTool+PinViewPinConfig.NuMaker1DevelopmentGolden 3 Steps -DevelopmentSoftware Tools -PinConfigure/ PinView‐PinConfigure: GraphicalI/O setting‐PinView:Real-time I/OmonitoringIntegrated Development Environment (IDEs)‐Arm Keil MDK ‐IAR EWARM ‐NuEclipseNu-LinkDebugger & Programmer‐Nu-Link2-Pro/Nu-Link-Pro ‐Nu-Link2-Me/Nu-Link-Me ‐Nu-Link-GangBoard Supporting Package (BSPs)‐Comprehensive drivers ‐Plentiful peripheral examplesEvaluation Boards‐IC Target Board ‐On-board Nu-LinkDebugger & Programmer(Nu-Link2-Me/Nu-Link-Me)‐On-board USB Connector‐QuickStart LinkTools for Development StepBSPNuMaker Board UnboxingNuMaker Board UnboxingBuy OnlineNuMaker-M032SE (NK-M032SE)NuMaker Board IntroductionNuMaker-M032SE (NK-M032SE)M032SE3AENu-Link2-MeRESETAMMETERLEDHXTLXTUSBNuMaker Board IntroductionNuMaker-M032SE (NK-M032SE)Extension ConnectorCompatible with Arduino UNO1122NuMaker Board IntroductionNuMaker-M032SE (NK-M032SE)Power Supply1123344SWITCHICEJPR1Nu-Link2-Me (Rear)2User ManualPractice for Very Beginner –Get Started by Quick StartBased on M032Get Started by Quick StartNuMaker BoardQuick Start StepsTerminal EmulatorDownloadIDE InstallationNu-Link Driver InstallationBSP PreparationHardware Setup Sample Code in BSPProject ExecutionResultQuick Start –Step 0Terminal Emulator DownloadPuTTYAn open source SSH and telnet Client for the Windows platform.Download –“putty.exe”.https:///KEIL MDK Nuvoton edition M0 / M23Works with Nuvoton devices based on the Arm Cortex-M0 /M23 with a free-to-use professional tool. Download and Install.https:///nuvoton/M0-M23Video Instruction (CN)(EN)–Download and Install KEILQuick Start –Step 1IDE Installation1)Enter Contact Information 2)Download and Install 3)Get and Add LicenseQuick Start –Step 2Nu-Link Driver InstallationNu-Link DriverNuMaker Board has an on-board Nu-Link Debugger & Programmer.Download and Install.Nu-Link_Keil_DriverVideo Instruction (CN)(EN)–Download and Install Nu-Link KEIL DriverQuick Start –Step 3BSP PreparationBSPContains comprehensive drivers and plentiful peripheral examples.Download and Unzip.Software and Tool -> BSP; Quick Start Step3Nuvoton GitHubVideo Instruction (CN)(EN)–Board Support PackageHardware Setup1)Switch VCOM No.1 and No.2 ON.2)Connect the ICE USB connector tothe PC USB port.3)Check “Nu -Link2 Virtual COM Port”at Device Manager.Quick Start –Step 4Hardware Setup12Quick Start –Step 5Sample Code in BSPSample Code in BSPFile Path‒M031_Series_BSP_CMSIS_Vx.xxxxx‒SampleCode‒Template‒KeilProject ”Template”Open and Execute.1)Rebuild2)Successfully Compiled 3)DownloadUser Manual –Chapter 3.6Quick Start –Step 6Project Execution123Result in Terminal WindowTerminal Emulator Setup & Check the Result 1)Connection Type: Serial2)Serial Line: COM# in Device Manager 3)Speed: 1152004)Open Terminal Window.5)ResultQuick Start –Step 7Result1234SummarySummaryNuTool+PinViewPinConfig.Nu-LinkUSBDebugger & ProgrammerIDEBSPNuMaker1DevelopmentIDE InstallationNu-Link Driver InstallationBSP PreparationHardware SetupSample Code inBSPProject ExecutionResultQ&ATips填問卷抽Nu-Link2-Pro ($149USD)回卷者可抽Nu-Link2-Pro *1網路研討會限定NuMaker-M032SE一折開發板折扣碼:NEWJoeJoe HowardSUYULV.99LV.800LV.1Quick Start PinConfig(5min)PinView(5min)Q&AQuick Start PinConfig(5min)PinView(5min)Q&A軟體開發工具介紹PinConfigureSHEEPLV.999Quick Start PinConfig(5min)PinView(5min)Q&A軟體開發工具介紹PinViewDereCkLV.999JoeHowardLV.99LV.800LV.1Q&AJoeSUYUhttps://mcu.pse.is/M032SE一折NuMaker-M032SE (NK-M032SE)填問卷抽Nu-Link2-Pro ($149USD)DebuggerSWD/ETM interface ETM trace speed up to 96 MHzUnlimited breakpointStep(s) executionSupport CMSIS-DAP ProgrammerIn-circuit Programming (ICP)In-system Programming (ISP)PC control and stand-alone ICP/ISP Automated Programmer header External storage for stand alone ICP/ISP: SD Card, SPI Flash, USB DiskBridgeISP via multi-path bridge (USB, I2C, SPI, CAN, UART, RS-485) PC control and stand-alone ISP Virtual COM portAnalyzer I2C, SPI, UART, RS-485, CANPulse CaptureADC Conversion Webinar結束後系統會自動跳轉至問卷頁面,回卷者可抽Nu-Link2-Pro*1。
required missing说明书

The brand new concept of EMI probesApplication NoteIndex1.Simplify the complicated EMC measurement and debugging! (3)2.The Advantages of GKT-008 EMI Near Field Probe Set (3)3.GKT-008 EMI Near Field Probe Set (3)4.Normal EMI Test on Lab (4)5.Swiftly Simplify Complicated EMI Measurement and Debugging (5)6.New Generation Probes to Accurately Find Radiation Source (6)7.Problems Facing General Near Field Probes (9)8.Practical Cases (12)rmation of Product Ordering (14)Simplify the complicated EMC measurement and debugging!As a result of faster and faster consumer electronics products, the frequency of conducting EMI tests becomes higher and higher. The continuous integration of parts in electronics products and the number of parts involved are also swiftly increasing. Besides, the demand of EMI regulations from countries and regions is getting stricter than ever. But the life cycle of electronics products is getting shorter and shorter. Hence, in order to effectively and quickly solve EMI issues at the development stage and reduce the number of times products going to the lab, a simple and easy set of tool to quickly help engineers find EMI source to greatly expedite products’ time to market is essentially required.GW Instek launches the new patent GKT-008 electromagnetic field probes, which are small and highly sensitive. GKT-008 probes can directly sense EMI signal energy unlike conventional near field probes which require using electric field probes and magnetic field probes to measure electric field and magnetic field separately. Users can save costs from product development cycles and the lab that is conducive to expedite time for product verification and product launch.The Advantages of GKT-008 EMI Near Field Probe SetThe conventional magnetic field probes are hollow loop probes. When the magneticfield is perpendicular to probe’s loop surface, the maximum measurement value canbe obtained. The maximum magnetic field value can only be measured by rotatingpr obe’s direction.GKT-008 EMI near field probe features high spatial resolution and sensitivity withoutrotating probe’s direction to measure the maximum magnetic field value so as toidentify the main radiation signal source. This probe set aims at carrying out pre-testand debug of EMI field scanner so as to effectively obtain EMI source, segmentedfrequency strength of EMI source, etc. that provides key indicators for resolving EMCissues. By this probe set, users can formulate solutions to amend failed products.GKT-008 EMI Near Field Probe SetGKT-008 EMI Near Field Probe Set comprises four probes, including PR-01, PR-02, ANT-04, and ANT-05. The antenna factors of these four probes are built in the EMC Pretest function of GSP-9300 spectrum analyzer.- ANT-04 and ANT-05 are EMI field sensor, which can maximally sustainCAT I 50Vdc. ANT-04 and ANT-05 magnetic field probes will collocatewith ADB-008 DC block to avoid damaging spectrum analyzer and theRF input terminal of DUT receiver.- PR-01 is an AC voltage probe, which can maximally sustain CAT II,300VAC. PR-01 AC voltage probe will collocate with GPL-5010 transientlimiter and BNC (M) to SMA (F) adaptor to avoid damaging spectrumanalyzer and the RF input terminal of DUT receiver.- PR-02 is an EMI source contact probe, which can maximally sustain CATI 50V DC. PR-02 electric field probe will collocate with ADB-008 DCblock to avoid damaging spectrum analyzer and the RF input terminal ofDUT receiver.Normal EMI Test on LabFor a formal EMI certification test, in either an EMI chamber or an open fieldsite, the receiving antenna will pick up the emissions with in a distance of 8 or10 meters. This means the emissions may come from anywhere within the DUT.The antenna will receive them all the emissions, they can come from the top,bottom, right or left hand side.EMI test at Open Area TestSiteEMI Test in Anechoic ChamberIn Figure, the DUT is placed on a rotatable table, the receiving antenna islocated 10 meters from the DUT, and its stature is adjustable. The antennaoutput is connected to a spectrum analyzer which is located in a shielded room.A perfect Ground is needed to ensure an isolated environment. During themeasurement, the table will rotate 360 degrees, so that the antenna canreceive the Omni directional emissions. The antenna is also vertically adjustableto catch the upward emissions.However, the EMI testing results can not distinguish where on the DUT theemissions were generated. When the emissions are too strong and fail to passregulations, the source needs to be suppressed and thus have to be identifiedfirst. The near field probe is used to find the source of emissions on the DUT.Swiftly Simplify Complicated EMI Measurement and DebuggingGeneral issues of near field measurementsUsually, engineers will use near field probes to conduct EMI tests for circuit verification. However, they will encounter same problems when carrying out the test. • Probes can not quickly identify which circuit the radiation sourcecomes from. • Engineers have to use magnetic field probes and electric field probesseparately for measurements and they have to use their experience to find the signal source. • The angle or position of magnetic field probes will complicate themeasurements.The main reason behind these problems is that near field probes in the past are distinguished by magnetic field probe and electric field probe. In fact, engineers are concerned about how signal ’s energy emits. Hence, it is very important to correctly and quickly find the major energy emission source.- Probe sizeNormally, larger near field probes are used to sense electromagnetic field. But they can not easily identify the source of radiation. On the other hand,- The difference between electricfield probe and magnetic field probeIt is very difficult to judge the real signal source by waveforms obtained from measurements of electric field probes and magnetic field probes separately. Because these waveforms are very different from each other.- The angle of probeThe positionand angle ofprobes also affect the measurement results and will lead to misjudgment.Going through these procedures to find the signal source is very time-consuming. It is very important to quickly find the real interference source and simplify the procedures.Light and compact General near field probes using larger probes to sense electromagnetic field.But they can not easily identify radiation source even though signals can beobtained due to the coverage of most circuit and parts.ANT-04 and ANT-05 of GW Instek’s GKT-008 have the characteristics of smallsize and high identification resolution.General loop magnetic probe , diameter: 6.8cm General sphere electric probe,diameter: 3cmANT-04, diameter: 2.6cm ANT-05, diameter: 1.8cmReal test comparison- setup Compare general EMI near field probes with GW Instek dedicated EMI nearfield probes ANT-04/ANT-05 via a same signal source outputing TG of GSP-9330 to produce signals of 30M ~ 1GHz, 0dBm2.Connect TG with a PCB monopole antenna to simulate EMI signalsproduced by PCB trace3.Connect different probes with spectrum’s input terminal to compare(1)sensitivity (2)directivityGW Instek’s probes are high sensitivity design The left experiment result shows ANT-05’s size is 1/9 to that of the general magnetic field probe but its sensitivity is 20dB higher.The left experiment result shows ANT-05’s sensitivity (especially for high frequency) is better than the general electric field probe to the scale of 5~15dB.Directivity difference- the angle of probeConventional magnetic field probe’s angle makes a huge differenceThe above picture shows a conventional magnetic field probe in parallel with signal. After rotating the probe 90 degree to become perpendicular to the signal, the sensitivity drops 10~20dB for medium to high bandwidth. It will be very difficult to identify emission source for a product with complicated PCB trace design.GKT-008 probes do not have angle issuesANT-04 of GKT-008 does not have angle issues because the measured energy results from the probe in parallel or vertical to PCB trace are almost the same and stable.Directivity difference-the maximum signal source A loop probe aiming at the center of PCB trace can not guarantee the maximum signal be sensedA loop probe aiming at the center of PCB trace as shown on lower left hand corner picture can not guarantee the maximum signal is sensed. The upper left hand picture shows 1cm deviating to the center obtained better sensitivity. This result is related to magnetic field probe’s operational principle. Hence, this phenomenon will result in misjudgment for electronics products with higher density.ANT-04 obtains the maximum signal when aiming at the center of EUT ANT-04 obtains more signals when aiming at the center of EUT as shown on the above picture. Weaker signals obtained when the probe was 1cm deviating from the center. This result serves engineers’ expectation of quickly finding the real emission source with no misjudgment.The major advantages of ANT-04 and ANT-05 1.Small size, high sensitivity, they can accurately identify the real radiationsource.2.They can directly sense electromagnetic wave's energy withoutconducting separate electric field and magnetic field probe tests.3.Without directivity issue.4.Simplify complicated measurement and greatly reduce EMI debuggingtime.Probes can conduct contact circuit tests GKT-008 has contact probes to directly contact circuit for tests such as PCB trace noise, IC pin noise, power supply’s noise, etc.Electromagnetic wave's energy is produced by electric field and magnetic field Maxwell's Equations explain an important phenomenon: electric field and magnetic field coexist and mutually affect each other. These Equations describe how current and time-varying electric field produce magnetic field and how time-varying magnetic field produces electric field.Maxwell's EquationsEMI signal's energy is also determined by electric field and magnetic field. If S represents energy's density, E: electric field strength, H: magnetic field strength, and Poynting theorem states S = E x H. Electromagnetic is the cross product of electric field intensity and magnetic field intensity. Therefore, it is directional.S = E x HGeneral circuit's power is the product of voltage and current. Both current and voltage are required.D: Electric displacement : Charge densityE: Electric field intensity H: Magnetic field intensityJ: Current density B: Magnetic flux density VAZPVIThe radiation near field measurement for loop antenna mainly focuses on magnetic field. Near field and far field are defined by the distance between receiver antenna and emission source. It is called near field if the distance between receiver antenna and emission source is smaller than signal's wavelength. Near field includes reactive near field area and radioactive near field area. It is called far field if the distance is greater than wavelength, as the diagram shows. For example, wavelength for a 300MHz signal wave length λis 1m, then, less than 15.9cm ( λ/2π) is reactive near field, less than 1m is radioactive near field and over 2m is far field. Tests closing to PCB are reactive near field measurement of near field. The electromagnetic wave analysis of reactivenear field is related to emission source andantenna, therefore, the analysis is verycomplicated. The following diagram elaborateswave impedance vs. distance from emissionsource. Loop antenna induces large current andlow voltage in near field electromagnetic wavecharacteristics. Its wave impedance is low;therefore, magnetic field dominates. That is whya loop magnetic field probe can sense very strongmagnetic field at a low frequency bandwidthwhen closing to PCB. But electric field strength isnot necessarily strong that can not certainlycontribute to the real strong EMI signals.Loop near field probes have directionality issue The structure of a loop magnetic field probe is shown as diagram a. If the magnetic field direction is perpendicular to loop surface (diagram b), then it can be sensed, if it is in parallel with the loop surface, then the magnetic field can not be sensed.a.LoopShieldLine bcProblems Facing General Near Field ProbesProblems occurred while using a loop antenna for PCB measurements In addition to active components, PCB trace is also the EMI emission source. Higher current passing through trace will produce higher magnetic field; trace with higher voltage such as high load impedance or open circuit trace will produce higher electric field. A probe can pick up a very strong magnetic field if two PCB traces are very close to each other despite the individual magnetic field is weak.a. Loop probe sensing magnetic field produced by current passing through PCBlayoutb. The magnetic field of multiple PCB layouts can be simultaneously sensedA probe aiming at the center of PCB layout can not guarantee the maximum magnetic field is sensed.The directivity of a loop probe is likely to cause misjudgment. Diagram a. shows a probe placed directly above PCB trace can not obtain any signals. More magnetic field will pass through and stronger signals can be obtained if slightly deviating a distance.a. A probe placed directly aboveb. A slight distance deviationfrom the centerThe following experiment result proved this phenomenon.GKT-008 has best sensitivity We used the same test conditions and device. At the same spot on the circuit,a conventional electric field probe, a conventional magnetic field probe and aGW Instek’s ANT-04 near field probe were used to conduct test.The measurement of conventional electric field probeThe measurement of conventional magnetic field probeThe measurement of GW Instek’s ANT-04 near field probeWe found that the conventional electric field and magnetic field probe have alarger difference on the measurement results and their sensitivities can notcompare with that of GW Instek’s near field probe. For smaller signals, theconventional probes will produce more errors.The correlation with the result of the lab Another practical case was to directly place EUT in a 3m anechoic chamber. A switching power supply was used in a 3m anechoic chamber. The test resulted in three larger signals. Next, a conventional electric field probe, a conventional magnetic field probe and a GW Instek’s ANT-04 near field probe were used to conduct test.The measurement result of EUT in a 3m anechoic chamberThe measurement results of electric field probe and magnetic field probetesting EUT’s EMIThe measurement result of GKT-008 has better reference.We found that the measurement results of the conventional electric field and magnetic field probe yielded big difference. For magnetic field’s high frequency measurements, the conventional probes could not find signals found in anechoic chamber. For electric field, the poor sensitivity of the conventional probes could not find concealed signals. GKT-008 can find three identical signals found in the lab.Information of Product OrderingOrdering InformationGSP-9330, 3.25 GHz Spectrum AnalyzerGKT-008, EMI Near Field Probe SetADB-008, DC Block AdapterStandard AccessoriesGSP-9330, Spectrum Analyzer Power Cord, Certificate of Calibration, CD-ROM (with User Manual, ProgrammingManual, SpectrumShot Software, SpectrumShot Quick Start Guide & IVI Driver) GKT-008, EMI Near Probe Set User ManualOptionsGSP-9330, Spectrum Analyzer Opt.01 Tracking GeneratorOpt.02 Battery PackOpt.03 GPIB InterfaceADB-008, DC Block Adapter50ohm,SMA(M) to SMA(F),0.1MHz-8GHzOptional AccessoriesGSC-009 Portable Carry CaseGRA-415 Rack PanelFree DownloadSpectrumShot Software EMI pretest and remote control software for GSP-9330 (available on GW Instek website)IVI Driver for GSP-9330 supports LabVIEW/LabWindows/CVI (available on NI website)Please do not hesitate to contact us if you have any queries on the announcement, or product information of the EMI Near Field Probe Set.Sincerely yours,Overseas Sales DepartmentGood Will Instrument Co., LtdNo. 7-1, Jhongsing Road, Tucheng Dist.,New Taipei City 23678, Taiwan R.O.CEmail:**********************.tw。
LABTOOL-48UXP%20智能万用编程器

产品名称:LABTOOL-48UXP 智能万用编程器产品价格:6200元/台与LABTOOL-48 相比新的LABTOOL-48UXP 具有以下优点1) 对高密度存储器芯片LABTOOL-48UXP有双倍速度和生产能力FLASH 存储器的密度越来越高通常用现在的编程器编程一块128M bit FLASH芯片需要10到15分钟, 这会使用户失去耐心.LABTOOL-48UXP 提供0.5MB/sec 的编程速度, 所以编程一块128M bit FLASH 芯片只需要不到5 分钟的时间下面是LabTool-48 和LabTool-48UXP 编程速度的对比数据Intel 28F320C3B ( 32 M bit flash) speed benchmarkLT-48 L T-48UXP查空59 sec 19 sec编程140 sec 58 sec校验62 sec 32 sec总计261 sec 109 sec (快2.4 倍)这是通过打印机口的EPP 的新的数据传输模式底层硬体的改进及重写新的XP软件驱动来实现2) 支持Win 98/95/2000, NT 和Win XPMicrosoft 把PC 操作系统从Win 2000 升级到Win XP, 但是因为硬件设计的限制LabTool-48 不支持Win XP 为了支持未来Microsoft 发布的操作系统, 需要新的硬体设计来延长产品的寿命周期这导致了LabTool-48UXP 产生3) LabTool-48UXP 支持所有现在LabTool-48 支持的芯片和新的芯片因为LabTool-48 源代码的可移植性, 所有LabTool-48 支持的芯片已移植到LabTool-48UXP 推出LabTool-48UXP 后所支持的芯片的总数将超过5000 种,而且将来会使LabTool-48UXP 支持更多新型号的芯片由于资源所限我们必须淘汰LabTool-48 而仅保持LabTool-48UXP 软件的更新这意味着增加LabTool-48UXP 对新的芯片的支持, 在LabTool-48 淘汰后的一年内只做有限的软件更新和修正4) 序列号控制防止软件的非法使用LabTool-48UXP 的firmware 内有序列号执行LabTool-48UXP 软件, 编程器的序列号也会显示出来这能有效地防止在中国大陆地区的仿冒LabTool-48UXP 智能万用编程器特点高速USB接口+ 带自动切换电源的打印机接口支持5V 和3.3V 低电压芯片, 通过低电压适配器支持1.8V 芯片少于2 秒/兆位编程速度对于高密度flash 存储器芯片DIL 芯片最大48 脚无需适配器48 脚通用引脚驱动器电流限制自动感应/用统计报告自编程/连续性检查44-pin PLCC/ QFP/ TQFP/PSOP and 40/48 TSOP 通用适配器支持Windows 95/98, Windows 2000, windows XP和NT自动EPROM/ Flash ID 查找存储器/ P 芯片连载存储器缓冲高/ 低字节交换项目文件保存/ 载入功能用户可选校验一次或两次Vcc 电压自动文件格式检查和转换用户可改变编程参数提供所有适配器的引脚转换表3 年保修通过互联网升级软件LabTool-48UXP 的通用引脚驱动器, 每个引脚可以提供四种不同的电压地, 它可以设置为带拉高/拉低的TTL 高/低电平, 高速时钟和高阻这样先进的引脚设计使你无需适配器即可对任何DIL 芯片编程最大48 pin无以伦比的编程速度LabTool-48UXP 的智能特性把系统的开销减少到最低LabTool-48UXP 在编程高密度flash 存储器芯片上比它的前辈LABTOOL-48 快 1 倍, 它可以在60 秒内编程一片Intel 32 M bit flash 芯片LabTool-48UXP 比它的竞争对手快很多, 使它能更快地编程现在的高密度数兆位的存储器芯片技术创新性能领先芯片插入和接触检查无错误!在编程每个芯片前LabTool-48UXP 执行芯片插入和接触检查LabTool-48UXP 可以检查不良的引脚接触芯片插反或放错位置这一功能防止因操作者的错误造成的昂贵的芯片损失EPROM 和Flash 存储器ID 检测和查找很多EPROM 和Flash 存储器有嵌入的芯片ID 和生产厂家ID LabTool-48UXP可以通过按热键读取芯片的ID 检测ID 并同它的数据库比较来决定芯片的正确生产厂家和产品编号对于二手芯片和意外(或有意)地被擦除厂家和产品编号的芯片这个特点特别有用(这一功能仅适用于28 pin 或32 pin EPROM 和Flash)自动感应和自编程为了满足大规模生产的要求LabTool-48UXP 在硬件和软件中采用了新的专利技术进入量产模式后, 生产线上的操作人员把一片芯片插入ZIF 插座LabTool-48UXP 上的一个LED 提示芯片已编程完毕操作人员只需拿走芯片换上一片新的无需正式的培训增加了灵活性并节省时间和费用并且,LabTool-48UXP 的自动感应特性保证芯片被正确地插入后才自动编程芯片而且,在量产模式中系统键盘被自动禁止以防止操作人员不注意地操作错误项目文件保存和载入用户可以创建和保存一个包含芯片选项缓冲数据和所有编程设置选项的项目文件, 项目文件可以任何时候调用而不用再作设置, 你的设计文件可以方便地交给生产部门序列号功能如果你的存储器芯片需要带有不同增量顺序和初始值的单独的序列号,LabTool-48UXP 有自动增量的功能每次插入一片新的芯片就使缓冲中的序列号增加这就节省了时间和金钱用户可选校验电压, 一次或两次校验编程芯片后LabTool-48UXP 让你选择校验电压, 例如, Vcc, Vcc 5%, Vcc10%. Vcc 电压可以是 2.0V 到 6.5V 这个特性确保你的芯片已被正确编程,防止因编程错误导致编程失败并保存数据通过不同的转换器支持非DIL 芯片LabTool-48UXP 的通用引脚驱动器使它无需DIL-to-DIL 适配器就能编程所有48-pin DIL 芯片, 包括所有的单片机然而除了DIL 封装有许多不同的封装,例如PLCC, SOP, TSOP, QFP和SDIP我们开发了100 多种不同的适配器以支持这些特殊封装的芯片3年保修通过互联网升级软件LabTool-48UXP 的附加安全特性如嵌入的电流限制和引脚连续性检查功能这就防止了编程期间坏的芯片造成的损坏因此我们提供LabTool-48 UXP 的 3 年主机保修可以通过互联网免费升级软件通用44-pin PLCC, QFP, PSOP和TQFP适配器支持44-pin 的芯片LabTool-48UXP 的通用引脚驱动器使你能支持所有44-pin 的芯片如EPLD,EPROM, Flash, EPLD 和单片机只需一个44-pin 的通用适配器这就不需要购买多个适配器也就节省了金钱而且, 48 pin 以内的不同封装的芯片只需一个适配器引脚转换表-自制适配器LabTool-48UXP 提供所有适配器的引脚转换表可以通过互联网下载如必要你可以下载相应的转换表自制适配器, 节省时间和金钱低电压芯片支持LabTool-48UXP 支持 2.0V - 5.0V 逻辑电平输入/输出, 并能提供2.0V - 21V 模拟电压(如VCC) 支持低于2.7V 的低电压芯片如通过低电压适配器支持1.8V芯片规格插座和引脚驱动器48-pin DIL/ ZIF 插座8pin - 48pin 300/ 600-mil 芯片四个八位精度DACs for Vcc, Vpp1, Vpp2 and Vpp3 软件可调上升时间和电流限制保护逻辑驱动器支持所有48 pin 2.0V-5V 上拉/ 下拉或高阻芯片支持存储器: PROM, EPROM, EEPROM, Flash, Serial PROM, NVRAM逻辑芯片: PAL, GAL, CEPAL, PEEL, CDLD, EPLD,其他: OTP/Flash 单片机芯片操作读, 查空, 芯片插入/接触检查, 校验, 校验和, EPROM ID 检查, 比较, 擦除, 功能测试, 编程, 存储器保护, 芯片设置设定, 编辑缓冲, 量产模式, 修改向量, 连载, 高/低字节缓冲交换, 缓冲查找PLD 向量测试器支持JEDEC 测试向量最大48 pin2500V/usec. 上升时间文件格式转换JEDEC, POF, Binary, Intel HEX, Intel EXT HEX, Motorola S, HP 64000ABS, Straight Hex TEKTRONIC Hex, 自动检查和转换PC 系统要求操作系统: Windows 95/98, Win 2000, Windows XP或Windows NT处理器: 386 以上最少8 MB RAM , 建议32 MB RAM硬盘剩余空间16 MBEPP 模式的并口CD ROM 驱动器电源: 100 - 240 V AC, 自动切换频率范围: 47 - 63 Hz功耗: 25 W工作温度: 5 - 45 (41 - 113℉)CE & LVD 认证重 1.8KG。
TMS320C2000 系统应用开发套件 v1.0 2Ph 交流滤波电源 (ILPFC) EVM 规
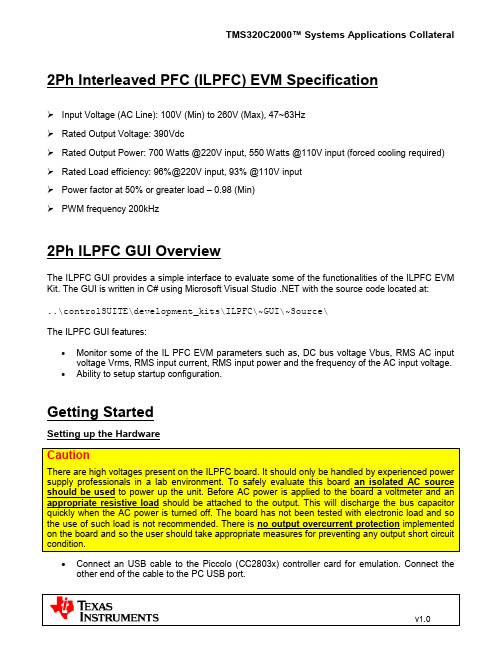
2Ph Interleaved PFC (ILPFC) EVM SpecificationInput Voltage (AC Line): 100V (Min) to 260V (Max), 47~63HzRated Output Voltage: 390VdcRated Output Power: 700 Watts @220V input, 550 Watts @110V input (forced cooling required) Rated Load efficiency: 96%@220V input, 93% @110V inputPower factor at 50% or greater load – 0.98 (Min)PWM frequency 200kHz2Ph ILPFC GUI OverviewThe ILPFC GUI provides a simple interface to evaluate some of the functionalities of the ILPFC EVM Kit. The GUI is written in C# using Microsoft Visual Studio .NET with the source code located at:..\controlSUITE\development_kits\ILPFC\~GUI\~Source\The ILPFC GUI features:•Monitor some of the IL PFC EVM parameters such as, DC bus voltage Vbus, RMS AC input voltage Vrms, RMS input current, RMS input power and the frequency of the AC input voltage.•Ability to setup startup configuration.Getting StartedSetting up the HardwareCautionThere are high voltages present on the ILPFC board. It should only be handled by experienced power supply professionals in a lab environment. To safely evaluate this board an isolated AC source should be used to power up the unit. Before AC power is applied to the board a voltmeter and an appropriate resistive load should be attached to the output. This will discharge the bus capacitor quickly when the AC power is turned off. The board has not been tested with electronic load and so the use of such load is not recommended. There is no output overcurrent protection implemented on the board and so the user should take appropriate measures for preventing any output short circuit condition.•Connect an USB cable to the Piccolo (CC2803x) controller card for emulation. Connect the other end of the cable to the PC USB port.•Connect the external +12Vdc supply (provided with the ILPFC EVM package) at JP1 to power up all the control circuit for now. By default, Piccolo controller is enabled to boot from FLASH and run the ILPFC code. The user should not use the RAM to program or run the ILPFC code.•Turn on the switch SW1 by placing it towards the electrolytic caps (C5, C6 and C7). This will apply the external +12V supply to the ILPFC board. Piccolo controller will now boot from the FLASH and start executing the ILPFC code. Following this one of the LEDs (LED3 on the CC2803x control card) will start flashing periodically. The flashing LED is an indication of the code being executed from the FLASH memory. However, the PFC bus will remain at 0V since at this point we haven’t yet applied the AC input voltage.•Now select an appropriate isolated AC power supply (100Vac to 260Vac, 47Hz~63Hz, 1000VA min) to provide input power to the ILPFC EVM. Connect the ac supply to the ILPFC EVM input connector P1 but do not turn on the AC power at this time.•Connect an appropriate resistive load to the ILPFC DC output terminals (PFC-Out & GND terminals). Resistive loads within the range of 10W ~ 700W are recommended. Set the initial load to about 50W~80W. A 2K ohm resistor will provide about 80W load at 400V dc bus. This board has not been tested with electronic load.Running the ApplicationBy default the hardware is configured to boot from a pre-Flashed code. The GUI only works with the F2803x_FLASH configuration in the corresponding CCS project.Note that the General Purpose GUI requires Microsoft .NET framework 2.0 or higher to run. Please ensure that this software is installed prior to running this program.1) Browse to..\controlSUITE\development_kits\ILPFC\~GUI and double-click onILPFC-GUI.exe. The following figure shows a screen shot for the ILPFC GUI when connected to the ILPFC EVM.2) Click “Setup Connection” on the GUI3) Ensure the Baud Rate is set to 57600.4) Next you will need to select your serial comport.a. If the comport that the target is connected to is known please select it.b. Otherwise use the “Find Comport” tool to find the serial port connection that is connectedto the EVM board.1. Ensure that the target F2803x MCU is setup to boot from a pre-Flashed code (seerelated control card documentation for setting up boot up configuration)2. Click “Find Comport” then follow the instructions shown at the bottom of the window.This will run through a short automated test to find the COM port that is connected tothe EVM board.3. Following the test you should see “Comport Found: COMXX” appear near the bottomof the window. If the GUI is unable to find a valid comport after fixing/checking all errorsreceived then retry this process to find the proper comport using option c.c. Manually find the comport by going to:Control Panel->System->Hardware tab->Device Manager->Ports(COM & LPT).If using a serial port directly connected to a PC, look for a comport which shows up as “Communications Port” and select this comport in the Setup Connection window.5) Ensure “Boot on Connect” is unchecked.6) Click “OK”7) On the Main Window click “Connect”. The GUI should now connect to the target and be readyfor use.8) Select the parameter update rate as shown below:GUI Structure•Monitor – section displays various system parameter values. These include PFC status, input AC RMS voltage, input current, input power, input AC line frequency and PFC output voltage.•Update Rate– changes the rate at which the GUI updates the parameters in the Monitor section.•Setup Connection – opens a new window which contains the serial port and boot settings.•Connect/Disconnect – begins serial port communication with the target board.Using the GUI•Once the hardware is set-up correctly and the application program (pre-flashed code) is tested to run with the GUI, then close the GUI, turn OFF the switch SW1 and disconnect the external+12Vdc supply.•Turn off the switch SW1 by placing it away from the electrolytic caps (C5, C6 and C7). This will allow the isolated bias supply (the small bias supply board mounted at location M2 close to the PFC AC input connector P1) provide +12Vdc output when the AC power is turned on.•Set the AC input voltage to around 60Vac, 60Hz. Now turn on the AC power source. This will allow the isolated bias supply to turn on (after some delay) and provide +12V output. Piccolo controller will now boot from the FLASH and start executing the ILPFC code. LED3 on the CC2803x control card will start flashing periodically. With the AC input set to 60Vac, the PFC DC bus voltage will not ramp up to rated output.•Bring up the ILPFC GUI (as described before) and monitor the PFC parameters. At this point all the PFC parameters except the “PFC Status” bit should be available.• Now increase the AC input voltage to around 120Vac, 60Hz. The unit will detect this minimum input voltage and the corresponding DC bus voltage (160Vdc minimum). This condition must be met in order to soft-start the PFC.•The PFC output will now ramp according to the slew rate to the rated bus voltage (~390Vdc). •When the soft-start is complete, the “PFC Status” bit on the GUI will change to 1 indicating that the PFC is on.•Now verify the effect on the dc bus voltage and on the input power factor when the input voltage (100Vrms ~ 260Vrms) or the load power (0~550W @110Vin, 0~700W @220Vin,) is varied. The dc bus should be regulated at 390V under all conditions. Depending on theload(10% and higher) and line conditions, the power factor for the input current will vary from0.95 to 0.999. The first set of waveform below shows the PFC input voltage and current whenthe input voltage is about 110V and the PFC load is about 550W load. The second one shows the input current and PFC DC bus response for step load between 240W ~ 400W when the input voltage is set to 120Vrms.•Monitor the PFC parameters on the GUI and verify the reported values.•When turning off ac power, ensure that the AC power is turned off first. Then wait for a few minutes before disconnecting the GUI.ReferencesFor more information please refer to the following guides:•ILPFC User Guide – provides detailed information on the ILPFC project within an easy to use lab-style format...\controlSUITE\development_kits\ILPFC\~Docs\ILPFC.pdf•ILPFC_Rel-1.0-HWdevPkg– a folder containing various files related to the Piccolo-A controller card schematics...\controlSUITE\development_kits\ILPFC\ILPFC_HWDevPkg•F28xxx User’s Guides/f28xuserguides。
44个JAVA代码质量管理工具(转)

44个JAVA代码质量管理⼯具(转)It’s a great tool (Eclipse plugin) for improving software quality. It has the next key features: Code Analysis, JUnit Test Generation, JUnit Test Editor, Similar Code Analysis, Metrics, Code Coverage and Dependency Analysis.It scans Java source code and looks for potential problems: Possible bugs, Dead code, Suboptimal code, Overcomplicated expressions and Duplicate code.It looks for bugs in Java programs. It can detect a variety of common coding mistakes, including thread synchronization problems, misuse of API methods, etc.It’s a free Java tool that calculates the percentage of code accessed by tests. It can be used to identify which parts of your Java program are lacking test coverage. It is based on jcoverage.It is a fast Java code coverage tool based on bytecode instrumentation. It differs from the existing tools by enabling coverage profiling on large scale enterprise software projects with simultaneous emphasis on fast individual development.It is a development tool to help programmers write Java code that adheres to a coding standard.JBoss Tattletale is a tool that can help you get an overview of the project you are working on or a product that you depend on. The tool will recursive scan a directory for JAR files and generate linked and formatted HTML reports.UCDetector (Unecessary Code Detector) is a Open Source eclipse PlugIn Tool to find unecessary (dead) java code. It also tries to make code final, protected or private. UCDetector also finds cyclic dependencies between classes.Sonar is a continuous quality control tool for Java applications. Its basic purpose in life is to join your existing continuous integration tools to place all your development projects under quality control.The XRadar is an open extensible code report tool that produces HTML/SVG reports of the systems current state and the development over time. Uses DependencyFinder, JDepend, PMD, PMD-CPD, JavaNCSS, Cobertura, Checkstyle, XSource, JUnit, Java2HTML, ant and maven.QALab consolidates data from Checkstyle, PMD, FindBugs and Simian and displays it in one consolidated view. QALab keeps a track of the changes over time, thereby allowing you to see trends over time. You can tell weather the number of violations has increased or decreased – on a per file basis, or for the entire project. It also plots charts of this data. QALab plugs in to maven or ant.Clirr is a tool that checks Java libraries for binary and source compatibility with older releases. Basically you give it two sets of jar files and Clirr dumps out a list of changes in the public api. The Clirr Ant task can be configured to break the build if it detects incompatible api changes. In a continuous integration process Clirr can automatically prevent accidental introduction of binary or source compatibility problems.JDiff is a Javadoc doclet which generates an HTML report of all the packages, classes, constructors, methods, and fields which have been removed, added or changed in any way, including their documentation, when two APIs are compared. This is very useful for describing exactly what has changed between two releases of a product. Only the API (Application Programming Interface) of each version is compared. It does not compare what the source code does when executed.It checks your Java code and find bugs, inconsistencies and synchronization problems by doing data flow analysis and building the lock graph.JDepend traverses Java class file directories and generates design quality metrics for each Java package. JDepend allows you to automatically measure the quality of a design in terms of its extensibility, reusability, and maintainability to effectively manage and control package dependencies.cloc counts blank lines, comment lines, and physical lines of source code in many programming languages.Dependometer performs a static analysis of physical dependencies within a software system. Dependometer validates dependencies against the logical architecture structuring the system into classes, packages, subsystems, vertical slices and layers and detects cycles between these structural elements. Furthermore, it calculates a number of quality metrics on the different abstraction layers and reports any violations against the configured thresholds.Hammurapi is an open source code inspection tool. Its release comes with more than 100 inspectors which inspect different aspects of code: Compliance with EJB specification, threading issues, coding standards, and much more.JavaNCSS is a simple command line utility which measures two standard source code metrics for the Java programming language. The metrics are collected globally, for each class and/or for each function.DCD finds dead code in your Java applications.Classycle’s Analyser analyses the static class and package dependencies in Java applications or libraries. It is especially helpful for finding cyclic dependencies between classes or packages. Classycle is similar to JDepend which does also a dependency analysis but only on the package level.The program ckjm calculates Chidamber and Kemerer object-oriented metrics by processing the bytecode of compiled Java files. The program calculates f or each class the following six metrics proposed by Chidamber and Kemerer.Jameleon is an automated testing framework that can be easily used by technical and non-technical users alike. One of the main concepts behind Jameleo n is to create a group of keywords or tags that represent different screens of an application. All of the logic required to automate each particular screen can be defined in Java and mapped to these keywords. The keywords can then be organized with different data sets to form test scripts without requiring an in-depth knowledge of how the application works. The test scripts are then used to automate testing and to generate manual test case documentation.DoctorJ analyzes Java code, in the following functional areas: documentation verification, statistics generation and syntax analysis.Macker is a build-time architectural rule checking utility for Java developers. It’s meant to model the architectural ideals programmers always dream up for their projects, and then break — it helps keep code clean and consistent. You can tailor a rules file to suit a specific project’s structure, or write some gener al ‘good practice’ rules for your code. Macker doesn’t try to shove anybody else’s rules down your throat; it’s flexible, and writing a rules file is part of the de velopment process for each unique project.Squale is a qualimetry platform that allows to analyze multi-language software applications in order to give a sharp and comprehensive picture of their quali ty: High level factors for top-managers and Practical indicators for development teams.The freeware program SourceMonitor lets you see inside your software source code to find out how much code you have and to identify the relative compl exity of your modules. For example, you can use SourceMonitor to identify the code that is most likely to contain defects and thus warrants formal review.The Panopticode project provides a set of open source tools for gathering, correlating, and displaying code metrics.Provide metrics calculation and dependency analyzer plugin for the Eclipse platform. Measure various metrics with average and standard deviation and det ect cycles in package and type dependencies and graph them.QJ-Pro is a comprehensive software inspection tool targeted towards the software developer. Developers can automatically inspect their Java source code and improve their Java programming skills as they write their programs. QJ-Pro provides descriptive Java patterns explaining error prone code constructs and providing solutions for it.Byecycle is an auto-arranging dependency analysis plugin for Eclipse. Its goal is to make you feel sick when you see bad code and to make you feel happy when you see good code.Coqua measures 5 distinct Java code quality metrics, providing an overview and history for the management, and down-to-the-code, detailed views for the developer. Metrics can be defined per team. Ideal for mid- to large-sized and/or offshore projects.Extracts dependencies and OO metrics from Java class files produced by most Java compilers.Jalopy is an easily configurable source code formatter that can detect, and fix, a number of code convention flaws that might appear in Java code. Jalopy i s more of a code fixer than a code checker. Jalopy plug-ins are present for most IDEs and, in most cases, they gel quite seamlessly with the IDE.JarAnalyzer is a dependency management tool for .jar files. JarAnalyzer will analyze all .jar in a given directory and identify the dependencies between eac h. Output formats include xml, with a stylesheet included to transform it to html, and GraphViz DOT, allowing you to produce a visual component diagram s howing the relationships between .jar files. The xml output includes important design metrics such as Afferent and Efferent coupling, Abstractness, Instabilit y, and Distance. There is also an Ant task available that allows you to include JarAnalyzer as part of your build script.Condenser is a tool for finding and removing duplicated Java code. Unlike tools that only locate duplicated code, the aim of Condenser is to also automatic ally remove duplicated code where it is safe to do so.Relief provides a new look on Java projects. Relying on our ability to deal with real objects by examining their shape, size or relative place in space it gives a ‘physical’ view on java packages, types and fields and their relationships, making them easier to handle. Lets discuss quickly how we interprete physical p roperties and how it can help us to grasp project characteristics.JCSC is a powerful tool to check source code against a highly definable coding standard and potential bad code. The standard covers naming conventions for class, interfaces, fields, parameter, … . Also the structural layout of the type (class/interface) can be defined. Like where to place fields, either before or after the methods and in which order. The order can be defined through the visibility or by type (instance, class, constant). The same is applicable for meth ods. Each of those rules is highly customizable. Readability is enhanced by defining where to put white spaces in the code and when to use braces. The ex istence of correct JavaDoc can be enforced and various levels. Apart from that, it finds weaknesses in the the code — potential bugs — like empty catch/fin ally block, switch without default, throwing of type ‘Exception’, slow code.Spoon is a Java program processor that fully supports Java 5. It provides a complete and fine-grained Java metamodel where any program element (class es, methods, fields, statements, expressions…) can be accessed both for reading and modification. Spoon can be used on validation purpose, to ensure th at your programs respect some programming conventions or guidelines, or for program transformation, by using a pure-Java template engine.Lint4j (‘Lint for Java’) is a static Java source and byte code analyzer that detects locking and threading issues, performance and scalability problems, and c hecks complex contracts such as Java serialization by performing type, data flow, and lock graph analysis.Crap4j is a Java implementation of the CRAP (Change Risk Analysis and Predictions) software metric – a mildly offensive metric name to help protect you f rom truly offensive code.Java PathFinder (JPF) is a system to verify executable Java bytecode programs. In its basic form, it is a Java Virtual Machine (JVM) that is used as an expl icit state software model checker, systematically exploring all potential execution paths of a program to find violations of properties like deadlocks or unhan dled exceptions. Unlike traditional debuggers, JPF reports the entire execution path that leads to a defect. JPF is especially well-suited to finding hard-to-te st concurrency defects in multithreaded programSoot can be used as a stand alone tool to optimize or inspect class files, as well as a framework to develop optimizations or transformations on Java bytec ode.The Extended Static Checker for Java version 2 (ESC/Java2) is a programming tool that attempts to find common run-time errors in JML-annotated Java p rograms by static analysis of the program code and its formal annotations. Users can control the amount and kinds of checking that ESC/Java2 performs b y annotating their programs with specially formatted comments called pragmas.。
- 1、下载文档前请自行甄别文档内容的完整性,平台不提供额外的编辑、内容补充、找答案等附加服务。
- 2、"仅部分预览"的文档,不可在线预览部分如存在完整性等问题,可反馈申请退款(可完整预览的文档不适用该条件!)。
- 3、如文档侵犯您的权益,请联系客服反馈,我们会尽快为您处理(人工客服工作时间:9:00-18:30)。
Lab 9: Content Server Development Tool
(30 minutes)
Objectives
At the end of this exercise, you will be able to:
e CatalogMover to import Template assets into our WebCenter Sites database
2.Sync your newly imported Templates into eclipse with CSDT
Detailed Instructions
1.Unzip eclipse-jee-helios-SR2-win3
2.zip to C:\Oracle_Software\eclipse-jee-helios-
SR2-win32\
2.Extract csdt.zip and copy “csdt-eclipse\com.fatwire.eclipsecsdt_1.2.jar” to
C:\Oracle_Software\eclipse-jee-helios-SR2-win32\eclipse\plugins
3.Double click on C:\Oracle_Software\eclipse-jee-helios-SR2-
win32\eclipse\eclipse.exe.
4.Select a workspace. Just accept the default or choose a directory of your
preference
5.Click on workbench.
6.Click on “Window-> Open Perspective -> Other”.
7.Select “Oracle WebCenter Sites” and click on the OK button
8.Change Content Server Installation Directory to your WebCenter Sites installation
directory.
Sites Installation Directory: C:\Oracle\WebCenter\Sites\11gR1\Sites\11.1.1.6.1 Enter fwadmin user credentials, set Project name: Tutorial and click on the OK button
9.You should see a screen similar to the one below.
10.Create a “developerdocs” directory in
“C:\Oracle\WebCenter\Sites\11gR1\App_Server\apache-tomcat-
6.0.32\webapps\cs\developerdocs” and extract “tag_reference.zip” and
“webcentersites_javadoc.zip” files in that directory
Hint: Please make sure the names of the directories are:
javadoc and TagReference
1.Extract and edit AssetPublication.html in templates.zip.
a.Replace 1308693591902 with your site id.
b.Update AssetPublication.html in the templates.zip!
Hint: Site ID can be found in Admin Interface Admin Tab
2.Double click catalogmover.bat in
“C:\Oracle\WebCenter\Sites\11gR1\Sites\11.1.1.6.1\catalomover.bat”
3.Click on “Server -> Connect”
4.Enter parameters as shown in the screen below and click on the Connect button.
[ Please note that the port number could be different from your Sites
installation]
5.Click on “Catalog -> Auto Import Catalog”
6.Select Templates.zip and click on the Save button
7.Click on the OK button
8.Click on the OK button
9.Exit CatalogMover
10.Login to Admin UI using tutorial user and click on the Tutorial Design tab.
Expand the Template node. You should see a screen similar to the one below
11.Go back to Eclipse. Click on the sync button.
Hint: You need to grant fwadmin user permission for Tutorial website
12.Click on Site column to rearrange by Site
13.Select all assets that belongs to Tutorial Site and click on the Sync Selection to
Workspace button
14.You should see your elements in the Sites Workspace pane after successful sync。