图表作文写法
图表类作文写作方法.

2007年广东高考基础写作真题回放
上周, 我们以 “谁是你的偶像” 为题, 在2600名学生的 中进行了一次调查( survey). 以下是调查数据:
偶像(idol)
伟人 父母 影视明星 体育明星 没有偶像
女生
18% 25% 50% 6% 1%
男生
18% 11% 14% 48% 9%
Reasons:
1. The reason why/for …is that… 2. One may think of the change as a result of…
3. The change in … largely results _fr_o_m__
the fact that… 4.This brings out the important fact
基础写作解题步骤:
1.审题 2.列要点 3.依要点, 拟草纲, 组织成句. 4.构篇章,扩句成文. 5.检查润色 6.书写
图表类作文的形式及特点:
1) 是以表格形式,将统计的数据或被说明的事物直 接用表格形式体现出来.
侧重于数据的排序。
2004
2005
2006
2007
Grain
49%
47%
45%
图表型 说明文 一般现在时 第三人称
二 列要点
1. 调查时间, 调查问题以及调查对象
上周, “谁是你的偶像”, 2600名学生 2.男女生在以明星为偶像方面的差异; 48%男生以体育明星为偶像, 50%女生以影视明星为偶像 3.“父母” 在男女生偶像中的排序差异;
“父母”在男生中排第4, 在女生中排第2. 4.男女生在以伟人为偶像方面的异同; 18%男生以伟人为偶像, 18%女生以伟人为偶 5.你像的. 偶像及理由 我的偶像是…, 因为….(选择其ຫໍສະໝຸດ 的一种的代表)常使用的词汇有:
作文万能模板--图表作文
高考英语作文高三英语复习时要覆盖各类作文题材,以便在考场上看到任何类型的题目都能轻松搞定。
以下为大家整理了图表分析类作文题目及范文,供同学们参阅。
图表作文是高中英语作文中较常见的类型,要求学生通过图中数据和提示内容写一短文,属于比较、对照类。
也可根据提示写为议论文。
通常我们采取三段式写法:第一段:描述图表,得出结论。
第二段:紧扣主题,根据图表比较分析原因,论证结论。
第三段:发表议论,提出自己的看法。
常用句式:1. As can be seen from the chart,...As is shown in the chart,...2. The chart shows that about 60 percent of students want to go to college...3. From the graph/data/results/information above,it can be seen/concluded/show/estimated...4.The graph shows the changes in the number of...over the period from...to...pared with...,the number of the students of...高中英语作文图表作文万能模板:As is shown by the figure/percentage in the table /picture,____ has been on rise/ decrease,significantly/dramatically rising/decreasing from ____ in _____ to _____ in _____. From the sharp rise/decline in the chart,it goes without saying that _____.There are at least two good reasons accounting for _____. In one hand,____.In the other hand,_____ is due to the fact that ______.In addition,______ is responsible for _____. Maybe there are some other reasons to show ______.But it is generally believed that the above mentioned reasons are commonly convincing.As far as I am concerned,I hold the point of view that _______. I am sure my opinion is both sound and well-grounded.DIY:高考英语图表分析类作文题目1最近,你参加了高三年级组织的“你最重视哪科作业”的调查,结果见下面的饼状图。
六级图表类作文范文

六级图表类作文范文
范文:
第一段,图表揭秘。
一看这图表,就知道近几年那城市居民出行方式可变了不少。
私家车越来越多,公共交通和走路的人越来越少。
第二段,私家车火爆。
说起私家车,那可真是火得一塌糊涂。
从2018年到2023年,
私家车的使用率从30%一路飙升到快50%了。
这背后啊,肯定是大家
生活好了,都想开车方便点。
第三段,公共交通遇冷。
可另一边呢,公共交通就没那么受欢迎了。
图表显示,用公共
交通的人越来越少,可能和私家车多了、公交服务没跟上都有关系。
第四段,步行渐少。
再来说说步行。
以前大家都爱走路,现在可不一样了。
城市的节奏越来越快,大家都想快点到达目的地,所以走路的人就少了。
第五段,环境与健康小忧。
这出行方式一变,环境和健康也跟着受影响。
私家车多了,空气和噪音污染都加重了;走路的人少了,大家运动也少了,健康自然就受影响了。
第六段,未来咋办。
那未来怎么办呢?城市管理者可得好好想想了。
高考备考写作专题:图表分析作文

高考备考写作专题:图表分析作文第一篇:全球二氧化碳排放量变化趋势随着工业化和现代化的发展,全球二氧化碳排放量不断增加,给地球的生态环境带来了巨大挑战。
下面是一幅描述全球二氧化碳排放量变化趋势的图表。
从图表中可以看出,自20世纪50年代开始,全球二氧化碳排放量呈现出逐年增加的趋势。
在20世纪70年代到80年代之间,排放量增速开始明显加快,到了90年代更是达到了高峰。
然而,在近几年,尽管二氧化碳排放量仍然在增加,但增速明显放缓。
造成全球二氧化碳排放量增加的原因有很多,但主要是工业生产、能源消耗和交通运输等活动所引起的。
这些活动大量使用化石燃料,例如煤炭、石油和天然气,导致了大量的二氧化碳释放到大气中。
全球二氧化碳排放量的增加给地球的生态环境带来了诸多问题。
首先,大量的二氧化碳排放导致大气中温室气体浓度升高,进而造成气候变化,例如全球气温上升、极端天气事件增多等。
其次,二氧化碳还会导致海洋酸化,对海洋生物造成威胁。
此外,由于空气污染加剧,人们的健康也受到了威胁。
为了应对全球二氧化碳排放量增加的问题,各国政府和国际组织已经采取了一系列的措施,例如限制工业排放、推广清洁能源和绿色交通等。
但要真正解决二氧化碳排放问题,还需要全球各方共同努力,包括改变生活方式、提高环保意识等。
第二篇:中国城市人口增长随着城市化进程的不断推进,中国城市人口呈现出快速增长的趋势。
下面是一幅描述中国城市人口增长的图表。
从图表中可以看出,1990年以前,中国城市人口增长较为缓慢,但之后迅速加快。
尤其是在2000年以后,城市人口增长速度急剧提升。
目前,中国的城市化率已经超过了50%。
城市人口增长的原因有很多,主要是农村人口向城市转移和城市自然增长导致的。
一方面,农村居民为了追求更好的生活条件和就业机会,纷纷涌向城市。
另一方面,由于医疗水平的提高和生活条件的改善,城市人口的自然增长也较快。
城市人口增长给中国带来了很多挑战。
首先,城市人口的快速增加导致了城市基础设施和公共服务压力的加大。
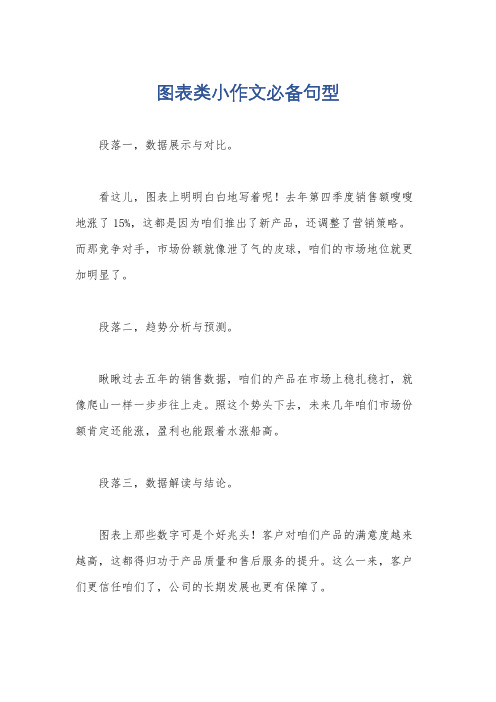
图表类小作文必备句型
图表类小作文必备句型
段落一,数据展示与对比。
看这儿,图表上明明白白地写着呢!去年第四季度销售额嗖嗖地涨了15%,这都是因为咱们推出了新产品,还调整了营销策略。
而那竞争对手,市场份额就像泄了气的皮球,咱们的市场地位就更加明显了。
段落二,趋势分析与预测。
瞅瞅过去五年的销售数据,咱们的产品在市场上稳扎稳打,就像爬山一样一步步往上走。
照这个势头下去,未来几年咱们市场份额肯定还能涨,盈利也能跟着水涨船高。
段落三,数据解读与结论。
图表上那些数字可是个好兆头!客户对咱们产品的满意度越来越高,这都得归功于产品质量和售后服务的提升。
这么一来,客户们更信任咱们了,公司的长期发展也更有保障了。
段落四,数据背后的故事。
这些数据可不是天上掉下来的,背后都是咱们团队的辛勤付出。
从市场调研到产品研发,再到市场推广,每个环节都少不了团队成
员的智慧和努力。
这些成绩,都是大家用汗水和智慧换来的。
段落五,数据的启发与启示。
看着这些数据,我心里就有数了。
想要在竞争激烈的市场中站
稳脚跟,就得不断创新,满足客户需求。
这些数据不仅仅是数字,
更是咱们未来发展的指南针。
图表作文的写作模式

第一段: • _______ known as one of the most serious problems in today’s world. As is shown in the graph / according to the figures shown in the graph, (表述图表中的数字) < chart / pie chart / bar chart > 第二段: • (陈述理由)Further,(继续陈述理由)As a result,(引起的 后果是..的减少或增长)(…experiencing a decrease/ an increase.) 第三段: • I believe ______ will be achieved through efforts of every person.
• There are chiefly two reasons for the increase. Firstly, teachers and students have realized the importance of listening and have taken all measures to improve the students’ listening ability. Secondly, with the development of the “the quality-oriented education”, the teachers have generally adopted more effective teaching methods in listening. • In spite of what is mentioned above, there are still some problems. The graph indicates the average listening scores are still not very satisfactory. Hence, the situation is still serious and how to improve the students’ ability is still a challenging task.
雅思英语图表作文范文(必备3篇)
雅思英语图表作文范文第1篇A类雅思各类图表作文要点及范文一.曲线图解题关键1曲线图和柱状图都是动态图,解题的切入点在于描述趋势。
2在第二段的开头部分对整个曲线进行一个阶段式的总分类,使写作层次清晰,同时也方便考官阅卷。
接下来再分类描述每个阶段的specifictrend,同时导入数据作为分类的依据。
3趋势说明。
即,对曲线的连续变化进行说明,如上升、下降、波动、持平。
以时间为比较基础的应抓住“变化”:上升、下降、或是波动。
题中对两个或两个以上的变量进行描述时应在此基础上进行比较,如变量多于两个应进行分类或有侧重的比较。
4极点说明。
即对图表中最高的、最低的点单独进行说明。
不以时间为比较基础的应注意对极点的描述。
5交点说明。
即对图表当中多根曲线的交点进行对比说明。
6不要不做任何说明就机械地导入数据,这不符合雅思的考试目的。
曲线图常用词汇动词—九大运动趋势一:表示向上:increase,rise,improve,grow,ascend,mount,aggrandize,goup,climb, take off, jump,shoot up暴涨,soar,rocket, skyrocket雅思英语图表作文范文第2篇It is said that countries are becoming similar to each other because of the global spread of the same products, which are now available for purchase almost anywhere. I strongly believe that this modern development is largely detrimental to culture and traditions worldwide.A country’s history, language and ethos are all inextricably bound up in its manufactured artefacts. If the relentless advance of international brands into every corner of the world continues, these bland packages might one day completely oust the traditional objects of a nation, which would be a loss of richness and diversity in the world, as well as the sad disappearance of t he manifestations of a place’s character. What would a Japanese tea ceremony be without its specially crafted teapot, or a Fijian kava ritual without its bowl made from a certain type of tree bark?Let us not forget either that traditional products, whether these be medicines, cosmetics, toy, clothes, utensils or food, provide employment for local people. The spread of multinational products can often bring in its wake a loss of jobs, as people urn to buying the new brand,perhaps thinking it more glamorous than the one they are used to. This eventually puts old-school craftspeople out of work.Finally, tourism numbers may also be affected, as travelers become disillusioned with finding every place just the same as the one they visited previously. To see the same products in shops the world over is boring, and does not impel visitors to open their wallets in the same way that trinkets or souvenirs unique to the particular area too.Some may argue that all people are entitled to have access to the same products, but I say that local objects suit local conditions best, and that faceless uniformity worldwide is an unwelcome and dreary prospect.Heres my full answer:The line graphs show the average monthly amount that parents in Britain spent on their children’s s porting activities and the number of British children who took part in three different sports from 2008 to is clear that parents spent more money each year on their children’s participation in sports over the six-year period. In terms of the number of children taking part, football was significantly more popular than athletics and 2008, British parents spent an average of around £20 per month on their children’s sporting activities. Parents’ spending on children’s sports increased gradually over the followi ng six years, and by 2014 the average monthly amount had risen to just over £ at participation numbers, in 2008 approximately 8 million British children played football, while only 2 million children were enrolled in swimming clubs and less than 1 million practised athletics. The figures for football participation remained relatively stable over the following 6 years. By contrast, participation in swimming almost doubled, to nearly 4 million children, and there was a near fivefold increase in the number of children doing athletics.剑桥雅思6test1大作文范文,剑桥雅思6test1大作文task2高分范文+真题答案实感。
图表作文思路
一、表格图图表作文的写作要点1横向比较。
介绍横向各个数据的区别,变化和趋势2不需要将每一个数据分别说明,突出强调数据最大值和最小值3最对比时要总结出数据对比最悬殊的和最小的二、曲线图图表作文的写作要点1极点说明。
即,对图表当中最高的,最低的点要单独进行说明2趋势说明。
即,对图表当中曲线的连续变化进行说明,如上升,下降,波动,持平3交点说明。
即,对图表当中多根曲线的交点进行对比说明三、饼状图图表作文的写作要点1介绍各扇面及总体的关系2各个扇面之间的比较,同类扇面在不同时间,不同地点的比较3重点突出特点最明显的扇面:最大的,最小的,互相成倍的四、综合图图表作文的写作要点1不求甚解,不拘泥于细节2分门别类,分段落详细介绍各个图表3不画蛇添足,主观臆断或猜测图表之间的关系以上就是这四类图表作文的写作要点介绍,对于各个图表的特点和描写的重点的不同进行了对比,大家可以在备考图表作文考试的时候,提前进行适当的参考和借鉴。
英语四级图表作文讲解及参考范文图表作文也是四(六)级考试中常见,而且被认为是一种较难的作文形式。
图表作文就是把非文字信息(通常为各种图表表示的数字信息等)转换成文字信息的一种作文。
它要求我们用文字来描述非文字性的图表或对图表显示的关系作解释说明。
第一节图表作文的出题形式和写作要领一、图表作文常见出题形式图表作文一般在题目中给出作文的标题和一个或几个统计表格、圆形图、曲线图或条形图,有时还用英文或中文提纲的形式给出提示,要求我们:1)用文字描述图表,客观解释图表中所传递的信息,并找出某种规律或趋势; 2)就图表中所反映的某种趋势或问题分析其原因或后果。
图表作文着重说明事实,常常是通过对图表中所反映的具体数据的说明、分析、比较,对某种事物或现象的事实或变化情况等加以说明,并提出结论或看法。
因此,图表作文常常采用议论文体的写作方法。
写好图表作文,关键在于能否读懂图表中所提供的信息,把握各信息间的联系,用准确流畅的语言把这一信息表达出来,并就这一信息发表自己的看法。
英语图表作文模板及精选4篇
英语图表作文模板及精选4篇(经典版)编制人:__________________审核人:__________________审批人:__________________编制单位:__________________编制时间:____年____月____日序言下载提示:该文档是本店铺精心编制而成的,希望大家下载后,能够帮助大家解决实际问题。
文档下载后可定制修改,请根据实际需要进行调整和使用,谢谢!并且,本店铺为大家提供各种类型的经典范文,如总结报告、合同协议、规章制度、条据文书、策划方案、心得体会、演讲致辞、教学资料、作文大全、其他范文等等,想了解不同范文格式和写法,敬请关注!Download tips: This document is carefully compiled by this editor. I hope that after you download it, it can help you solve practical problems. The document can be customized and modified after downloading, please adjust and use it according to actual needs, thank you!Moreover, our store provides various types of classic sample essays, such as summary reports, contract agreements, rules and regulations, doctrinal documents, planning plans, insights, speeches, teaching materials, complete essays, and other sample essays. If you want to learn about different sample formats and writing methods, please pay attention!英语图表作文模板及精选4篇学而不思则罔,思而不学则殆,以下是本店铺给大伙儿收集整理的英语图表作文模板及精选4篇,欢迎参考。
2023年英语四级图表作文的类型及参考范文
您目前旳位置: 首页 > 英语四级 > 英语四级作文 > 英语四级作文综合辅导 > 正文英语四级图表作文旳类型及参照范文图表作文也是四(六)级考试中常见, 并且被认为是一种较难旳作文形式。
图表作文就是把非文字信息(一般为多种图表表达旳数字信息等)转换成文字信息旳一种作文。
它规定我们用文字来描述非文字性旳图表或对图表显示旳关系作解释阐明。
下面我们先来看一看图表作文旳类型。
第一节图表作文旳类型图表作文可分为两大类: 表作文和图作文。
表作文表格(Table)可以使大量数据系统化, 便于阅读、比较。
表格常由标题(Title)、表头(Boxhead)(表格旳第一行)、侧目(Stub)(表格左边旳第一列)和主体(Body)部分(表格旳其他部分)等部分构成。
如下表:用表格体现旳信息详细精确, 并且表格中旳各项均按一定规律排列。
阅读表格时要注意找出表格中各个项目旳互相关系, 表格中各个项目旳变化规律。
例如, 上面旳表格中旳数字阐明, 和1978年相比, 1983年大学入学旳人数在增长, 而小学旳入学人数在减少。
弄清晰这些变化规律也就读懂了表格旳内容。
图作文图作文又可分为三种: 圆形图作文、曲线图作文和条状图作文。
(1) 圆形图作文圆形图(Pie chart)也称为饼状图或圆面分割图。
圆形图由于比较形象和直观, 各部分空间大小差异轻易辨别, 因此常用来表达总量和各分量之间旳比例关系。
整个圆表达总量, 楔形块表达分量。
有时圆形图尚有数值表, 两者结合可把各分量表达得更精确、清晰。
例如:Thi.i..pi.char.o.th.averag.weekl.expenditur.o..famil.i.Grea.Britain.A.ca.b.se.fr o.th.chart.th.mai.expenditur.o.a.averag.Britis.famil.i.spen.o.food.whic.account. fo.25.o.it.tota.expenditure.Th.nex.tw.significan.expendin.item.ar.transpor.an.ho using.whic.ar.15.an.12.respectively.I.w.tak.int.accoun.clothin.an.footwear.whic. make.u.10%.th.fou.essential.o.life.tha.is.food.transport.housing.an.clothin.an.f ootwear.amoun.t.62.o.th.tota.expenditure.(2) 曲线图作文曲线图(Line graph)也称为线性图或坐标图。
- 1、下载文档前请自行甄别文档内容的完整性,平台不提供额外的编辑、内容补充、找答案等附加服务。
- 2、"仅部分预览"的文档,不可在线预览部分如存在完整性等问题,可反馈申请退款(可完整预览的文档不适用该条件!)。
- 3、如文档侵犯您的权益,请联系客服反馈,我们会尽快为您处理(人工客服工作时间:9:00-18:30)。
大学英语四级图表作文的写法:图表作文有表格(table)、柱形图(bar chart)、饼状图(pie chart)和折线图(diagram)之分,后三种都属于图表的范畴(chart)。
写作模式:第一段:概述图表反映的主题思想第二段:分析产生的原因第三段:展望未来或提出方法或建议有用的词上升:increase、rise、ascend 、go up下降: decrease、fall 、drop、descend、decline 、reduce平稳:stable 、steady、remain/maintain/keep/be the same as/similar to波动:fluctuate、fluctuation、rise and fall、up and down 占:occupy、take up、account for而:while、however、whereas、on the other hand、actually/in fact 相比:by contrast、on the contrary、likewise、compared with最高点:the highest 、the top、the summit 、the peak、the most 最低点:bottom 、less 、least 、rock bottom平均:mean、average趋势:tendency 、trend、inclination预见:prediction图表作文常用的句型(1)常用的开篇句型(即概述图表内容时常用的表达法)①According to the table/pie chart/bar chart/disgram, we cansee/conclude that … 根据该表/图,我们可知……②The table/graph reveals (shows/indicates/illustrates/represents/points out) that … 该表/图表明……③As we can see from the table … As can be seen from the table … As is shown (illustrated/indicated) in the pie char t … 如表/图所示,……(2)描述增减变化常用的句型①The number of … gr ew/rose fr om … to …③There was a very slight (small/slow/gradual) rise/increase in1998③There was a very steady (marked/sharp/rapid/sudden/ dramatic) drop (decrease/decline/fall/reduction) in 1998/ compared with that of last year).第一段描述数据我们要首先看看是几个变量如果只有一个变量,有三个数据,可以描述如下:From the chart we can see clearly that the average number of hours a student spends on Internet per week has increased from less than two hours in 1998 to nearly four hours in 2000, and then to 20 hours in 2004.如果有两三个变量,可以描述如下:From the chart, we can see clearly that in a big city in China, state-owned houses declined from 75% in 1990 to 60% in 1995 and then to 20% in 2000, while private houses rose from 25% to 40% and then to 80% during the same period. 这里用了while引起从句来突显对比,是一种非常好的办法,如果用两句话来描述,也完全可以。
第二段主观:We believe that three reasons can account for this phenomenon. I believe that three reasons can account for this phenomenon. In my mind, the reasons why the overseas students are on the rise are as follows. 主观之变体(使用插入语,突显主语):Three reasons, we believe, can account for this phenomenon. Three reasons, I believe, can account for this phenomenon. Three reasons, I firmly believe, can account for this phenomenon. 注意:插入语的使用属于看似平淡却极富功力的技巧,可以达到很好的效果。
第三段的写作经常使用的词汇有: 经常使用的词汇有in a word,in short ,generally speaking,It's clear from the chart that...,We can draw the conclusion that..., We can learn/know...图表作文模板:As is shown/indicated/illustrated by the figure/percentage in the table graph/picture/pie/chart), ___作文题目的议题____ has been on rise/ decrease (goes up /increases/drops/decreases), significantly/dramatically/steadilyrising/decreasing from______ in _______ to ______ in _ ____. From the sharp/marked decline/ rise in the chart, it goes without saying that ________. There are at least two good reasons accounting for ______. For one thing, ________. For another thing, _______ is due to the fact that ________. In addition, ________ is responsible for _______. As far as I am concerned, I hold the point of view that _______. I am sure my opinion is both sound and well-grounded.1.【例析1】请你根据下表提供的信息写一篇题为【Changes in Chinese People‘s Diet的短文。
短文可分为三小节:1) state the changes in people's diet in the past five years;2) explain the changes and give possible reasons;3) draw your own conclusions.分析:本统计表描述中国人民从2001年至2002年饮食结构的变化。
第一步:点明主题。
(开门见山言简意赅)点明主题。
(开门见山,第一步点明主题。
(开门见山,言简意赅)There have been some changes in the diet of the Chinese people. 第二步:观察图表中数据的增减总趋势分类式阐明,并说明原因观察图表中数据的增减总趋势,分类式阐明并说明原因。
第二步观察图表中数据的增减总趋势分类式阐明并说明原因Grain, the main food of the most people in China, is now playing a less important role. The amount of fruit and vegetables on the average person's diet has also dropped by 1.5 percent from 1998 to 2002. The amount of milk and meat has increased. The changes in diet can be explained by several reasons. For one thing, with the development of economy, an increasing number of people can afford to buy better foods. For another, people have realized the importance of a balanced diet. Avoiding starvation is no longer the only purpose of eating. 第三步:归纳总结并得出结论归纳总结并得出结论。
第三步归纳总结并得出结论。
In a word, the changes are the signs of the improvement in people's lives. There is no doubt that there will begreater changes in people's diet in the future. A: Study the following table carefully and write an essay of at least 150 words. B: Your essay must be written on Answer Sheet? C: Your essay should meet the requirements below. 1. Changes in people’s daily expenses in the past five years 2. Give possible reasons for the changes. 3. Draw my own conclusions In the past five years, there have been great changes in people’s daily expenses in XX city. According to the figures given in the table, the amount of money spent on food decreased gradually, accounting for 35 per cent in 1998. However, there was a rapid increase in clothing expenses, which made up 17% in 1998. In addition, the table shows an upward tendency in recreation expenses. The same was the case with other expenses. What caused these remarkable changes? In my opinion, there are at least three good reasons. To begin with, with the rapid development of agriculture in China, the output of grain, fruit, vegetables, and milk has sharply increased, which contributes to the decline in their prices. Secondly, the family incomes of people both in the city and in the country have greatly risen so that people now can afford expensive clothing and some of them even want to dress in the latest fashion. Finally, as the living conditions improve, the demand for a variety of recreations is growing steadily, too. In short, with the incomes rising continuously, people are no longer reconciled toliving a simple, monotonous life. They are eager to make their life interesting and exciting. Therefore, I am sure that people will spend more money on clothing and recreations. (215 words) 1. Describe the differences of the income sources between Chinese and American students. 2. Analyze possible reasons for these differences.3. Predicate future tendency. Income Sources Between Chinese Students and American Students Income sources of Chinese students are quite different from those of American students. In China, students get 90% of their money from their parents while in America, only 50% of students’ money is provided by parents. In addition, Chinese students earn only 5% of their money from part time jobs part?time and 5% from fellowship or scholarship while income from these two resources for American students takes up 35% and 15% respectively of their total income. I think there are probably three reasons for their differences. First, because of the influence of different social and family values, Chinese students have formed the habit of asking for money from their parents while American students have developed more sense of being financially independent. Second, most Chinese parents devote too much care to their children and they would rather save up to afford their children’s education rather than encourage them to take part-time jobs. But in America, many parents pay more attention to developing thestudents’ ability of self-reliance, so they encourage their children to find part-time job to earn some money by themselves. Third, since America is more developed than China, it is relatively easy for students to find part-time jobs. In China, such opportunities are rather rare. I believe with the development of China, more and more Chinese students will realize and pay more attention to the necessity of self-dependence. In addition, more and more opportunities will be provided for them to take part-time jobs. So more students will go out of the ivory tower to broaden their knowledge and to become the master of their own lives.。