Lecture 7 - Correlation
Lecture Notes 07

The R-squared form of the F statistic Using the fact that 2 2 SSRr = SST (1 Rr ) and SSRur = SST (1 Rur ) we can obtain
(R R ) F≡ 2 (1 Rur ) /(n k 1)
Practical versus Statistical Significance It is important to interpret the magnitude of the coefficient, in addition to looking at t statistics, when working with large samples.
+ β 3 log( sqrft ) + β 4bdrms + u
The null hypothesis is
H 0 : β1 = 1, β 2 = 0, β 3 = 0, β 4 = 0
Homework: Chapter 4, Exercise 4.1, 4.9, 4.15.
The F Statistic for Overall Significance of a Regression A special set of exclusion restrictions is routinely tested by most regression packages. The null hypothesis is
It can be shown that F Fq ,n k 1
Relationship between F and t statistics The F statistic for testing exclusion of a single variable is equal to the square of the corresponding t statistic. It is possible that we group a bunch of insignificant variables with a significant variable and conclude that the entire set of variables is jointly insignificant.
Lecture 7

3. Four types of market structure
i) Perfect competition: Firms produce identical products with price set by the impersonal forces of supply and demand. ii) Monopolistic competition: Firms produce differentiated products. As each firm enjoys some brand loyalty and is able to set its own price. But: The availability of substitute good limits the degree of discretion in price-setting; The lack of entry barrier means no limit of new comers into the market, leading to the elimination of economic profit in the long run.
• HHI (Hirschman-Herfindhal Index) is sensitive to the problem of size and competition. It is the sum of the squared market share for all firms in the industry (usually expressed as %). Maximum value of HHI = 100 x 100 = 10,000 Minimum value of HHI 0 0.5 x 0.5 + 0.3 x 0.3 + …+ 0.01 x 0.01 Expressed in % = HHI value/10,000 x 100% We must know the market share of every firm, not just the top 4 or 8 firms.
Correlation教育训练教材

MIN AIK TECHNOLOGY CO., LTD.
CORRELATION
無標準治具的校驗
(LINEAR REGRESSION STUDY)
(簡單線性迴歸分析)
1.校驗的基本概念?
國際標準
客戶
公司
國家標準
國家標準
量測之不確定性
實驗室標準
實驗室標準
公司標準
實 際 合 理 範 圍
B.STD值的判定應越小越好 C.結果的顯示: RSQ > 90% STD < 5 Accept RSQ > 90% STD < 10 Con Accept RSQ > 90% STD > 10 Check 75% < RSQ <90% STD < 10 Con Accept 75% < RSQ <90% STD > 10 Check RSQ < 75% Fail
RSQ r-square (線性相關係數): n x
(
n( xy) ( x)( y)
2 2
( x ) n y ( y )
2
2
)2
( x x) STD (標準差): n
2
AVG (平均值): x
n
5.Correlation如何做? A.取得有客戶讀值之樣本 (標準件) *做為標準件的樣本必須依往後生產方式產出. *範圍的取得應略比客戶規格大一些,如此比較 容易得到正確的線性. *樣本數太小或範圍太窄時,RSQ 與線性公式均 可能有
2.何謂直線方程式? Y=aX+b
Y:因變數 X:自變數 a :係數 (斜率) b :常數 3.散佈圖?
Lecture7

Slides from the text book (From the CD included in Atkins ,**)
Operators and Expectation Values
Re view of average calculations
Hˆ ψ(x) = Eψ(x) ; Fˆ ψ(x) ≠ kψ(x)
In this case the meassurement of F will give one of the eigenvalues of F Fξi = ki ξi
The average value from a large number
the average value < F > is also called an expectation value
Operators and Expectation Values New postulate 5.
Consider the special case where ψ(x) is a simultanious eigenfunction to Hˆ and Fˆ
Consider a large number N of identical boxes with identical particles all described by the same wavefunction Ψ(x, t) :
Let us for each system at the same time meassure the property F
of meassurements will be
<F
证券和组合课后习题:tb07

CHAPTER 7AN INTRODUCTION TO PORTFOLIO MANAGEMENTTRUE/FALSE QUESTIONS(f) 1 A good portfolio is a collection of individually good assets.(t) 2 Risk is defined as the uncertainty of future outcomes.(t) 3 Prior to the work of Markowitz in the late 1950’s and early 1960’s, portfolio managers did not have a well developed, quantitative means of measuring risk.(t) 4 A basic assumption of the Markowitz model is that investors base decisions solely on expected return and risk.(t) 5 Markowitz assumed that, given an expected return, investors prefer to minimize risk.(t) 6 The correlation coefficient and the covariance are measures of the extent to which two random variables move together.(f) 7 For a two stock portfolio containing Stocks i and j, the correlation coefficient ofreturns (r ij) is equal to the square root of the covariance (cov ij).(t) 8 If the covariance of two stocks is positive, these stocks tend to move together over time.(f) 9 The expected return and standard deviation of a portfolio of risky assets is equalto the weighted average of the individual asset’s expected returns and standarddeviation.(f) 10 The combination of two assets that are completely negatively correlated providesmaximum returns.(t) 11 Increasing the correlation among assets in a portfolio results in an increase in the standard deviation of the portfolio.(f) 12 Combining assets that are not perfectly correlated does affect both the expectedreturn of the portfolio as well as the risk of the portfolio.(f) 13 In a three asset portfolio the standard deviation of the portfolio is one third of thesquare root of the sum of the individual standard deviations.(t) 14 As the number of risky assets in a portfolio increases, the total risk of the portfolio decreases.(f) 15 Assuming that everyone agrees on the efficient frontier (given a set of costs), therewould be consensus that the optimal portfolio on the frontier would be where theratio of return per unit of risk was greatest.MULTIPLE CHOICE CONCEPT QUESTIONS(e) 1 When individuals evaluate their portfolios they should evaluatea) All the U.S. and non-U.S. stocks.b) All marketable securities.c) All marketable securities and other liquid assets.d) All assets.e) All assets and liabilities.(d) 2 The probability of an adverse outcome is a definition ofa) Statistics.b) Variance.c) Random.d) Risk.e) Semi-variance above the mean.(e) 3 The Markowitz model is based on several assumptions regarding investorbehavior. Which of the following is not such any assumption?a) Investors consider each investment alternative as being represented by aprobability distribution of expected returns over some holding period.b) Investors maximize one-period expected utility.c) Investors estimate the risk of the portfolio on the basis of the variability ofexpected returns.d) Investors base decisions solely on expected return and risk.e) None of the above (that is, all are assumptions of the Markowitz model) (b) 4 Markowitz believes that any asset or portfolio of assets can be described by________ parameter(s).a) Oneb) Twoc) Threed) Foure) Five(b) 5 Semivariance, when applied to portfolio theory, is concerned witha) The square root of deviations from the mean.b) All deviations below the mean.c) All deviations above the mean.d) All deviations.e) The summation of the squared deviations from the mean.(a) 6 The purpose of calculating the covariance between two stocks is to provide a(n)________ measure of their movement together.a) Absoluteb) Relativec) Indexedd) Loglineare) Squared(a) 7 In a two stock portfolio, if the correlation coefficient between two stocks were todecrease over time every thing else remaining constant the portfolio's risk woulda) Decrease.b) Remain constant.c) Increase.d) Fluctuate positively and negatively.e) Be a negative value.(d) 8 Which of the following statements about the correlation coefficient is false?a) The values range between -1 to +1.b) A value of +1 implies that the returns for the two stocks move together ina completely linear manner.c) A value of -1 implies that the returns move in a completely oppositedirection.d) A value of zero means that the returns are independent.e) None of the above (that is, all statements are true)(c) 9 You are given a two asset portfolio with a fixed correlation coefficient. If theweights of the two assets are varied the expected portfolio return would be_________ and the expected portfolio standard deviation would be _________.a) Nonlinear, ellipticalb) Nonlinear, circularc) Linear, ellipticald) Linear, circulare) Circular, elliptical(c) 10 Given a portfolio of stocks, the envelope curve containing the set of best possiblecombinations is known as thea) Efficient portfolio.b) Utility curve.c) Efficient frontier.d) Last frontier.e) Capital asset pricing model.(d) 11 If equal risk is added moving along the envelope curve containing the bestpossible combinations the return willa) Decrease at an increasing rate.b) Decrease at a decreasing rate.c) Increase at an increasing rate.d) Increase at a decreasing rate.e) Remain constant.(d) 12 A portfolio is considered to be efficient if:a) No other portfolio offers higher expected returns with the same risk.b) No other portfolio offers lower risk with the same expected return.c) There is no portfolio with a higher return.d) Choices a and be) All of the above(a) 13 The optimal portfolio is identified at the point of tangency between the efficientfrontier and thea) highest possible utility curve.b) lowest possible utility curve.c) middle range utility curve.d)steepest utility curve.e)flattest utility curve.(d) 14 An individual investor’s utility curves specify the tradeoffs he or she is willing tomake betweena) high risk and low risk assets.b) high return and low return assets.c) covariance and correlation.d)return and risk.e)efficient portfolios.(c) 15 As the correlation coefficient between two assets decreases, the shape of theefficient frontiera) approaches a horizontal straight line.b) bends out.c) bends in.d) approaches a vertical straight line.e) none of the above.(d) 16 A portfolio manager is considering adding another security to his portfolio. Thecorrelations of the 5 alternatives available are listed below. Which security wouldenable the highest level of risk diversificationa) 0.0b) 0.25c) -0.25d) -0.75e) 1.0(b) 17 A positive covariance between two variables indicates thata) the two variables move in different directions.b) the two variables move in the same direction.c) the two variables are low risk.d) the two variables are high risk.e)the two variables are risk free.(c) 18 A positive relationship between expected return and expected risk is consistentwitha) investors being risk seekers.b) investors being risk avoiders.c) investors being risk averse.d) all of the above.e) none of the above.(c) 19 The slope of the efficient frontier is calculated as followsa)E(R portfolio)/E(σportfolio)b)E(σportfolio)/ E(R portfolio)c)ΔE(R portfolio)/ΔE(σportfolio)d)ΔE(σportfolio)/ ΔE(R portfolio)e)None of the above(a) 20 The slope of the utility curves for a strongly risk-averse investor, relative to theslope the utility curves for a less risk-averse investor willa)Be steeper.b)Be flatter.c)Be vertical.d)Be horzontal.e)None of the above.MULTIPLE CHOICE PROBLEMS(c) 1 Between 1980 and 1990, the standard deviation of the returns for the NIKKEI andthe DJIA indexes were 0.08 and 0.06, respectively, and the covariance of theseindex returns was 0.0008. What was the correlation coefficient between the twomarket indicators?a) .1525b) .1388c) .1666d) .1622e) .1064(b) 2 Between 1985 and 1995, the standard deviation of the returns for the S&P 500and the NYSE indexes were 0.07 and 0.04, respectively, and the covariance ofthese index returns was 0.0006. What was the correlation coefficient between thetwo market indicators?a) .2255b) .2143c) .1864d) .1669e) .1280(e) 3 Between 1970 and 1980, the standard deviation of the returns for the NIKKEI andthe DJIA indexes were 0.09 and 0.06, respectively, and the covariance of theseindex returns was 0.0008. What was the correlation coefficient between the twomarket indicators?a) .1533b) .1288c) .1358d) .1522e) .1481(c) 4 Between 1975 and 1985, the standard deviation of the returns for the NYSE andthe S&P 500 indexes were 0.06 and 0.07, respectively, and the covariance of theseindex returns was 0.0008. What was the correlation coefficient between the twomarket indicators?a) .1525b) .1388c) .1458d) .1622e) .1064(a) 5 Between 1986 and 1996, the standard deviation of the returns for the NYSE andthe DJIA indexes were 0.10 and 0.09, respectively, and the covariance of theseindex returns was 0.0009. What was the correlation coefficient between the twomarket indicators?a) .1000b) .1100c) .1258d) .1322e) .1164(d) 6 Between 1980 and 1990, the standard deviation of the returns for the NIKKEI andthe DJIA indexes were 0.08 and 0.10, respectively, and the covariance of theseindex returns was 0.0007. What was the correlation coefficient between the twomarket indicators?a) .0906b) .0985c) .0796d) .0875e) .0654Common Stock Market Value Expected ReturnAndo Inc. 25,000 12%Bee Co. 50,000 10%Cool Inc. 75,000 16%a) 12.44%b) 16.22%c) 13.33%d) 15.27%e) 18.96%(a) 8 What is the expected return of the three stock portfolio described below?Common Stock Market Value Expected ReturnXerox 30,000 11%Yelcon 60,000 14%Zwiebal 60,000 10%a) 11.80%b) 14.33%c) 12.85%d) 15.46%e) 16.45%(d) 9 What is the expected return of the three stock portfolio described below?Common Stock Market Value Expected ReturnAlko Inc. 30,000 14%Belmont Co. 50,000 11%Cardo Inc. 70,000 12%a) 12.89%b) 13.62%c) 15.04%d) 12.07%e) 12.95%(c) 10 What is the expected return of the three stock portfolio described below?Common Stock Market Value Expected ReturnDelton Inc. 50,000 10%Efley Co. 40,000 11%Grippon Inc. 60,000 16%a) 14.89%b) 16.22%c) 12.66%d) 13.85%e) 16.99%Common Stock Market Value Expected ReturnLupko Inc. 50,000 13%Mackey Co. 25,000 9%Nippon Inc. 75,000 14%a) 12.04%b) 12.83%c) 13.07%d) 15.89%e) 17.91%USE THE FOLLOWING INFORMATION FOR THE NEXT TWO PROBLEMS Asset (A) Asset (B)E(R A) = 12% E(R B) = 8%(σA) = 5% (σB) = 5%W A = 0.50 W B = 0.50Cov A,B = 0.0008(c) 12 What is the expected return of a portfolio of two risky assets if the expected returnE(R i), standard deviation (σi), covariance (COV i,j), and asset weight (W i) are asshown above?a) 5%b) 8%c) 10%d) 11%e) 12%(a) 13 What is the standard deviation of this portfolio?a) 4.39%b) 3.89%c) 6.21%d) 4.82%e) 5.64%USE THE FOLLOWING INFORMATION FOR THE NEXT TWO PROBLEMS Asset (A) Asset (B)E(R A) = 10% E(R B) = 6%(σA) = 5% (σB) = 5%W A = 0.5 W B = 0.5COV A,B = 0.0009(c) 14 What is the expected return of a portfolio of two risky assets if the expected returnE(R i), standard deviation (σi), covariance (COV i,j), and asset weight (W i) are asshown above?a) 5%b) 6%c) 8%d) 9%e) 11%(e) 15 What is the standard deviation of this portfolio?a) 5.45%b) 5.04%c) 3.89%d) 4.34%e) 4.12%USE THE FOLLOWING INFORMATION FOR THE NEXT TWO PROBLEMS Asset (A) Asset (B)E(R A) = 9% E(R B) = 11%(σA) = 4% (σB) = 6%W A = 0.4 W B = 0.6COV A,B = 0.0011(d) 16 What is the expected return of a portfolio of two risky assets if the expected returnE(R i), standard deviation (σi), covariance (COV i,j), and asset weight (W i) are asshown above?a) 8.95%b) 9.30%c) 9.95%d) 10.20%e) 10.70%(b) 17 What is the standard deviation of this portfolio?a) 3.68%b) 4.56%c) 4.99%d) 5.16%e) 6.02%USE THE FOLLOWING INFORMATION FOR THE NEXT TWO PROBLEMS Asset (A) Asset (B)E(R A) = 10% E(R B) = 8%(σA) = 6% (σB) = 5%W A = 0.3 W B = 0.7COV A,B = 0.0008(a) 18 What is the expected return of a portfolio of two risky assets if the expected returnE(R i), standard deviation (σi), covariance (COV i,j), and asset weight (W i) are asshown above?a) 8.6%b) 8.1%c) 9.3%d) 10.2%e) 11.6%(e) 19 What is the standard deviation of this portfolio?a) 5.02%b) 3.88%c) 6.21%d) 4.04%e) 4.34%USE THE FOLLOWING INFORMATION FOR THE NEXT TWO PROBLEMS Asset (A) Asset (B)E(R A) = 8% E(R B) = 15%(σA) = 7% (σB) = 10%W A = 0.4 W B = 0.6COV A,B = 0.0006(b) 20 What is the expected return of a portfolio of two risky assets if the expected returnE(R i), standard deviation (σi), covariance (COV i,j), and asset weight (W i) are asshown above?a) 8.0%b) 12.2%c) 7.4%d) 9.1%e) 11.6%(d) 21 What is the standard deviation of this portfolio?a) 3.89%b) 4.61%c) 5.02%d) 6.83%e) 6.09%USE THE FOLLOWING INFORMATION FOR THE NEXT TWO PROBLEMSAsset (A) Asset (B)E(R A) = 16% E(R B) = 10%(σA) = 9% (σB) = 7%W A = 0.5 W B = 0.5COV A,B = 0.0009(c) 22 What is the expected return of a portfolio of two risky assets if the expected returnE(R i), standard deviation (σi), covariance (COV i,j), and asset weight (W i) are asshown above?a) 10.6 %b) 10.2%c) 13.0%d) 11.9%e) 14.0%(a) 23 What is the standard deviation of this portfolio?a) 6.08%b) 5.89%c) 7.06%d) 6.54%e) 7.26%USE THE FOLLOWING INFORMATION FOR THE NEXT TWO PROBLEMS Asset (A) Asset (B)E(R A) = 7% E(R B) = 9%(σA) = 6% (σB) = 5%W A = 0.6 W B = 0.4COV A,B = 0.0014(d) 24 What is the expected return of a portfolio of two risky assets if the expected returnE(R i), standard deviation (σi), covariance (COV i,j), and asset weight (W i) are asshown above?a) 5.8%b) 6.1%c) 6.9%d) 7.8%e) 8.9%(a) 25 What is the standard deviation of this portfolio?a) 4.87%b) 3.62%c) 4.13%d) 5.76%e) 6.02%USE THE FOLLOWING INFORMATION FOR THE NEXT TWO PROBLEMS Asset (A) Asset (B)E(R A) = 10% E(R B) = 14%(σA) = 7% (σB) = 8%W A = 0.7 W B = 0.3COV A,B = 0.0013(e) 26 What is the expected return of a portfolio of two risky assets if the expected returnE(R i), standard deviation (σi), covariance (COV i,j), and asset weight (W i) are asshown above?a) 6.4%b) 9.1%c) 10.2%d) 10.8%e) 11.2%(b) 27 What is the standard deviation of this portfolio?a) 4.51%b) 5.94%c) 6.75%d) 7.09%e) 8.62%USE THE FOLLOWING INFORMATION FOR THE NEXT TWO PROBLEMSAsset (A) Asset (B)E(R A) = 18% E(R B) = 13%(σA) = 7% (σB) = 6%W A = 0.3 W B = 0.7COV A,B = 0.0011(d) 28 What is the expected return of a portfolio of two risky assets if the expected returnE(R i), standard deviation (σi), covariance (COV i,j), and asset weight (W i) are asshown above?a) 10.10%b) 11.60%c) 13.88%d) 14.50%e) 15.37%(a) 29 What is the standard deviation of this portfolio?a) 5.16%b) 5.89%c) 6.11%d) 6.57%e) 7.02%USE THE FOLLOWING INFORMATION FOR THE NEXT TWO PROBLEMSAsset (A) Asset (B)E(R A) = 16% E(R B) = 14%(σA) = 3% (σB) = 8%W A = 0.5 W B = 0.5COV A,B = 0.0014(e) 30 What is the expected return of a portfolio of two risky assets if the expected returnE(R i), standard deviation (σi), covariance (COV i,j), and asset weight (W i) are asshown above?a) 11%b) 12%c) 13%d) 14%e) 15%(c) 31 What is the standard deviation of this portfolio?a) 3.02%b) 4.88%c) 5.24%d) 5.98%e) 6.52%USE THE FOLLOWING INFORMATION FOR THE NEXT TWO PROBLEMS Asset 1 Asset 2E(R1) = .10 E(R2) = .15E(σ1) = .03 E(σ2) = .05W1 = .65 W2 = .35r1,2 = .4(d) 32 Calculate the expected return of the two stock portfolio.a) 0.107b) 0.115c) 0.125d) 0.117e) None of the above(c) 33 Calculate the expected standard deviation of the two stock portfolio.a) 0.0016b) 0.0160c) 0.0309d) 0.1558e) 0.3950USE THE FOLLOWING INFORMATION FOR THE NEXT TWO PROBLEMS Asset 1 Asset 2E(R1) = .12 E(R2) = .16E(σ1) = .04 E(σ2) = .06(a) 34 Calculate the expected return and expected standard deviation of a two stockportfolio when r1,2 = - .60 and w1 = .75.a) .13 and .0024b) .13 and .0455c) .12 and .0585d) .12 and .5585e) .13 and .6758(d) 35 Calculate the expected returns and expected standard deviations of a two stockportfolio when r1,2 = .80 and w1 = .60.a) .144 and .0002b) .144 and .0018c) .136 and .0045d) .136 and .0455e) .136 and .4554(d) 36 Consider two securities, A and B. Security A and B have a correlation coefficientof 0.65. Security A has standard deviation of 12, and security B has standarddeviation of 25. Calculate the covariance between these two securities.a) 300b) 461.54c) 261.54d) 195e) 200(a) 37 Calculate the expected return for a three asset portfolio with the followingAsset Exp. Ret. Std. Dev WeightA 0.0675 0.12 0.25B 0.1235 0.1675 0.35C 0.1425 0.1835 0.40a) 11.71%b) 11.12%c) 15.70%d) 14.25%e) 6.75%.(c) 38 Given the following weights and expected security returns, calculate the expectedreturn for the portfolio.Weight Expected Return.20 .06.25 .08.30 .10.25 .12a) .085b) .090c) .092d) .097e) None of the aboveCHAPTER 7ANSWERS TO PROBLEMS1 r A,B = (σA,B) ÷ [(σA)(σB)] = (0.0008) ÷ (0.08)(0.06) = .16662 r A,B = (σA,B) ÷ [(σA)(σB)] = (0.0006) ÷ (0.07)(0.04) = .21433 r A,B = (σA,B) ÷ [(σA)(σB)] = (0.0008) ÷ (0.09)(0.06) = .14814 r A,B = (σA,B) ÷ [(σA)(σB)] = (0.0008) ÷ (0.06)(0.07) = .14585 r A,B = (σA,B) ÷ [(σA)(σB)] = (0.0009) ÷ (0.10)(0.09) = .10006 r A,B = (σA,B) ÷ [(σA)(σB)] = (0.0007) ÷ (0.08)(0.10) = .08757 W A = 25,000 ÷ 150,000 = 0.167(0.167)(12) = 2.0W B = 50,000 ÷ 150,000 = 0.33(0.33)(10) = 3.33W A = 75,000 ÷ 150,000 = 0.50(0.50)(16) = 8.02.0 +3.33 + 8.0 = 13.33%8 W X = 30,000 ÷ 150,000 = 0.20(0.20)(11) = 2.20W Y = 60,000 ÷ 150,000 = 0.40(0.40)(14) = 5.60W Z = 60,000 ÷ 150,000 = 0.40(0.40)(10) = 4.02.20 + 5.60 + 4.0 = 11.80%9 W A = 30,000 ÷ 150,000 = 0.20(0.20)(14) = 2.80W B = 50,000 ÷ 150,000 = 0.33(0.33)(11) = 3.67W C = 70,000 ÷ 150,000 = 0.47(0.47)(12) = 5.602.80 +3.67 + 5.60 = 12.07%10 W D = 50,000 ÷ 150,000 = 0.33(0.33)(10) = 3.33W E = 40,000 ÷ 150,000 = 0.27(0.27)(11) = 2.93W G = 60,000 ÷ 150,000 = 0.40(0.40)(16) = 6.403.33 + 2.93 + 6.4 = 12.66%11 W L = 50,000 ÷ 150,000 = 0.33(0.33)(13) = 4.33W M = 25,000 ÷ 150,000 = 0.167(0.167)(9) = 1.50W N = 75,000 ÷ 150,000 = 0.50(0.50)(14) = 7.04.33 + 1.50 + 7.0 = 12.83%12 E(R p) = W A E(R A) + W B E(R B)= (0.5)(12) + (0.5)(8) = 10%13 σp = [(W A)2 (σA)2 + (W B)2 (σB)2 + (2)(W A)(W B)(COV A,B)]1/2= [(0.5)2(0.05)2 (0.5)2(0.05)2 + (2)(0.5)(0.5)(0.0008)]1/2= (0.001925)1/2 = 4.39%14 E(R p) = W A E(R A) + W B E(R B)= (0.5)(10) + (0.5)(6) = 8%15 σp = [(W A)2 (σA)2 + (W B)2 (σB)2 + (2)(W A)(W B)(COV A,B)]1/2= [(0.5)2(0.05)2 (0.5)2(0.05)2 + (2)(0.5)(0.5)(0.0009]1/2= (0.00171)1/2 = 4.12%16 E(R p) = W A E(R A) + W B E(R B)= (0.4)(9) + (0.6)(11) = 10.20%= [(0.4)2 (0.04)2 (0.6)2(0.06)2 + (2)(0.4)(0.6)(0.0011)]1/2= (0.002080)1/2 = 4.56%18 E(R p) = W A E(R A) + W B E(R B)= (0.3)(10) + (0.7)(8) = 8.6%19 σp = [(W A)2 (σA)2 + (W B)2 (σB)2 + (2)(W A)(W B)(COV A,B)]1/2= [(0.3)2(0.06)2 (0.7)2(0.05)2 + (2)(0.3)(0.7)(0.0008)]1/2= (0.001885)1/2 = 4.34%20 E(R p) = W A E(R A) + W B E(R B)= (0.4)(8) + (0.6)(15) = 12.2%21 σp = [(W A)2 (σA)2 + (W B)2 (σB)2+ (2)(W A)(W B)(COV A,B)]1/2= [(0.4)2(0.07)2 (0.6)2(0.10)2 + (2)(0.6)(0.4)(0.0006)]1/2= (0.004672)1/2 = 6.83%22 E(R p) = W A E(R A) + W B E(R B)= (0.5)(16) + (0.5)(10) = 13%23 σp = [(W A)2 (σA)2 + (W B)2 (σB)2 + (2)(W A)(W B)(COV A,B)]1/2= [(0.5)2(0.09)2(0.5)2(0.07)2 + (2)(0.5)(0.5)(0.0009)]1/2= (0.0037)1/2 = 6.08%24 E(R p) = W A E(R A) + W B E(R B)= (0.6)(7) + (0.4)(9) = 7.8%25 σp = [(W A)2 (σA)2 + (W B)2(σB)2 + (2)(W A)(W B)(COV A,B)]1/2= [(0.6)2(0.06)2 (0.4)2(0.05)2 + (2)(0.6)(0.4)(0.0014)]1/2= (0.002368)1/2 = 4.87%26 E(R p) = W A E(R A) + W B E(R B)= (0.7)(10) + (0.3)(14) = 11.2%27 σp = [(W A)2 (σA)2 + (W B)2 (σB)2 + (2)(W A)(W B)(COV A,B)]1/2= [(0.7)2(0.07)2 (0.3)2(0.08)2 + (2)(0.7)(0.3)(0.0013)]1/2= (0.003523)1/2 = 5.94%28 E(R p) = W A E(R A) + W B E(R B)= (0.3)(18) + (0.7)(13) = 14.5%= [(0.3)2(0.07)2 (0.7)2(0.06)2 + (2)(0.3)(0.7)(0.0011)]1/2= (0.002667)1/2 = 5.16%30 E(R p) = W A E(R A) + W B E(R B)= (0.5)(16) + (0.5)(14) = 15%31 σp = [(W A)2 (σA)2 + (W B)2 (σB)2 + (2)(W A)(W B)(COV A,B)]1/2= [(0.5)2(0.03)2 (0.5)2(0.08)2 + (2)(0.5)(0.5)(0.0014)]1/2= (0.002750)1/2 = 5.24%32 R p = (0.65)(0.10)(0.35)(0.15) = 0.11733 σp = [(0.65)2 (0.03)2 + (0.35)2 (0.05)2 + (2)(0.65)(0.35)(0.03)(0.05)(0.4)]1/2= [0.00096]1/2 = 0.030934 R p = (0.75)(0.12) + (0.25)(0.16) = 0.13σp = [(0.75)2 (0.04)2 + (0.25)2(0.06)2 + (2)(0.75)(0.25)(0.04)(0.06) -0.6]1/2= [0.0009 + 0.000225 - 0.00054]1/2 = [0.000585]1/2 = 0.02435 R p = (0.60)(0.12) + (0.40)(0.16) = 0.136σp = [(0.60)2 (0.04)2 + (0.40)2(0.06)2 + (2)(0.60)(0.40)(0.04)(0.06)(0.8)]1/2= [0.000576+ 0.000576 + 0.000922]1/2 = [0.002074]1/2 = 0.045536 Cov(A, B) = (0.65)(12)(25) = 19537 Expected Return = 11.71% =(0.25)(0.0675)+(0.35)(0.1235)+(0.40)(0.1425)38 Weight Expected Return W i R i.20 .06 .012.25 .08 .020.30 .10 .030.25 .12 .030.092MULTIPLE CHOICE PROBLEMSUSE THE FOLLOWING INFORMATION FOR THE NEXT TWO PROBLEMSThe general equation for the weight of the first security to achieve the minimum variance (in a two stock portfolio) is given by:W1 = [E(σ2)2 - r1.2 E(σ1)E(σ2)] ÷ [E(σ1)2 + E(σ2)2 - 2 r1.2E(σ1)E(σ2)](e) 1A What weight of security 1 gives the minimum portfolio variance when r1.2 = .60,E(σ1) = .10 and E(σ2) = .16?a) .0244b) .3679c) .5697d) .6309e) .9756(a) 2A Show the minimum portfolio variance for a two stock portfolio when r1.2 = 1.a) E(σ2) ÷ [E(σ1) - E(σ2)]b) E(σ2) ÷ [E(σ1) + E(σ2)]c) E(σ1) ÷ [E(σ1) - E(σ2)]d) E(σ1) ÷ [E(σ1) + E(σ2)]e) None of the aboveANSWERS TO PROBLEMS(e) 1A W1 = [(.16)2 - .60 x .10 x .16(.016)] ÷ [.102 + .162 - 2(.60)(.10)(.16)]= .016 ÷ .0164 = .9756(a) 2A Substitute 1 for r1.2 in the general equation.W1 = [E(σ2)2 - (1) E(σ1)E(σ2)] ÷ [E(σ1)2 + E(σ2)2 - 2(1)E(σ1)E(σ2)]W1 = [E(σ2)2 - E(σ1)E(σ2)] ÷ [E(σ1)2 + E(σ2)2 - 2E(σ1)E(σ2)]W1 = E(σ2) [E(σ2) - E(σ1)] ÷ [E(σ1) - E(σ2)]2 = E(σ2) ÷ [E(σ1) - E(σ2)]MULTIPLE CHOICE PROBLEMSUSE THE FOLLOWING INFORMATION FOR THE NEXT TWO PROBLEMSThe general equation for the weight of the first security to achieve the minimum variance (in a two stock portfolio) is given by:W1 = [E(σ1)2 - r1.2 E(σ1) E(σ2)] ÷ [E(σ1)2 + E(σ2)2 - 2 r1.2 E(σ1) E(σ2)] (c) 1B Show the minimum portfolio variance for a portfolio of two risky assets whenr1.2 = -1.a) E(σ1) ÷ [E(σ1) + E(σ2)]b) E(σ1) ÷ [E(σ1) - E(σ2)]c) E(σ2) ÷ [E(σ1) + E(σ2)]d) E(σ2) ÷ [E(σ1) - E(σ2)]e) None of the above(d) 2B What is the value of W1 when r1.2 = - 1 and E(σ1) = .10 and E(σ2) = .12?a) 45.46%b) 50.00%c) 59.45%d) 54.55%e) 74.55%ANSWERS TO PROBLEMS1B Substitute -1 for r1.2 in the general equationW1 = [E(σ2)2 - (- 1)E(σ1) E(σ2)] ÷ [E(σ1)2 + E(σ2)2 - 2(- 1)E(σ1)E(σ2)]W1 = [E(σ2)2 + E(σ1)E(σ2)] ÷ [E(σ1)2 + E(σ2)2 + 2(1)E(σ1)E(σ2)]W1 = E(σ2) [E(σ2) + E(σ1)] ÷ [E(σ1) + E(σ2)]2= E(σ2) ÷ [E(σ1) + E(σ2)]2B W1 = 12/(.12 + .10) = .5455 = 54.55%。
相关(Correlation)算法
相关(Correlation)算法实验六相关(Correlation)算法⼀、实验⽬的1.加强相关的概念;2.学习相关算法的实现⽅法。
⼆、实验设备计算机,CCS 2.0版软件,实验箱、DSP仿真器。
三、实验原理1.概率论中相关的概念;2.随机信号相关函数的估计。
四、实验步骤1.熟悉基本原理;阅读实验提供的程序;2.运⾏CCS,记录相关系数;3.填写实验报告。
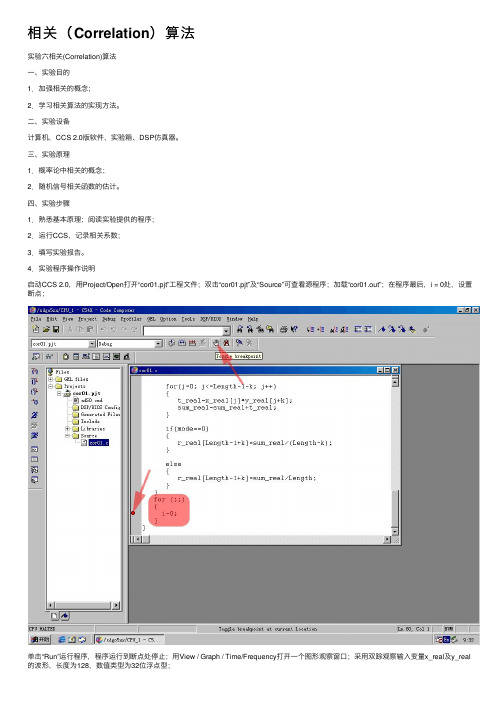
4.实验程序操作说明启动CCS 2.0,⽤Project/Open打开“cor01.pjt”⼯程⽂件;双击“cor01.pjt”及“Source”可查看源程序;加载“cor01.out”;在程序最后,i = 0处,设置断点;单击“Run”运⾏程序,程序运⾏到断点处停⽌;⽤View / Graph / Time/Frequency打开⼀个图形观察窗⼝;采⽤双踪观察输⼊变量x_real及y_real 的波形,长度为128,数值类型为32位浮点型;再打开⼀个图形观察窗⼝,以观察相关运算的结果;该观察窗⼝的参数设置为:变量为r_real,长度为255,数据类型为32位浮点数;调整观察窗⼝,观察两路输⼊信号相关运算的结果;程序中,mode可赋0或1,赋0时,完成相关函数⽆偏估计的计算,赋1时,完成相关函数有偏估计的计算;x_real和y_real为参与相关运算的两路信号,当x_real = y_real时,完成⾃相关函数的计算,⽽当x_real y_real时,完成互相关函数的计算。
修改以上参数,进⾏“Rebuild All”,并重新加载程序,运⾏程序可以得到不同的实验结果。
关闭“cor01.pjt”⼯程⽂件,关闭各窗⼝,实验结束。
五、思考题⽤其他数学⼯具计算相关系数,并与实验结果⽐较(如:SPSS,MA TLAB)。
六、相关算法时域表达式: ()()()∑--=+=lN ln n s l n s l R 121七、程序参数说明x_real[Length] // 原始输⼊数据A y_real[Length] // 原始输⼊数据B r_real[Lengthcor] // 相关估计数值Length // 输⼊数据长度 Lengthcor // 相关计算结果长度 mode = 0 // ⽆偏估计 mode = 1 // 有偏估计⼋、程序流程图:实验七 u_LAW 算法⼀、实验⽬的1.学习u-律的基本原理、压扩特性、编码和解码⽅法; 2.学习u-律算法在DSP 上的实现⽅法。
W7L1 Regression and Correlation

������������ ������������ ������ ������ ²
and
������������������ =
(������������ − ������)²=
������������ ² -
������ ������ ² ������
������������ = ������������������ /������������������ ������������ = ������ - ������������ ������ =) =
Week 7 Lesson 1 (lesson 13) – Ch 14 pg 629 Linear Regression and Correlation – how are two variables related e.g. sunny days and sales volume of ice cream Linear equation with one variable – straight line
and SSR =
[ (������������ − ������) (������������ − ������)]² /
(������������ − ������ )²
Linear Correlation Coefficient - denoted by r r=
������������������ ������������������ .������������������
������ ������ ² ������
������² ������������ /������������������
and SSE = ������������������ – (������² ������������ /������������������ )
选修7课件单元重点小结_19

vt.&vi.统治;支配;管理→ government
n.政府
21. destination
n.目的地
重点单词 重点短语 重点句型 重点语法 交际功能
1. adjust to 2. keep it up
3. fit in
4. as far as one is concerned 5. be occupied with 6. day in and day out 7. out of the question 8. settle in
15.apology n.道歉;谢罪→ apologize
vt.道歉
16. routine
n.常规;日常事务 adj.通常的;例行的
17. optional
adj.可选择的;随意的
18. parallel
adj.平行的;相同的;类似的
19. abundant
adj.丰富的;充裕的
20. govern
Most probably...It’s not very likely...
He/She/They will probably...
建议
fort n.舒适;安慰 vt.安慰→ comfortable adj.舒适的
7. substitute
n.代替品;代用品 vt.用……代替……
重点单词 重点短语 重点句型 重点语法 交际功能
8. academic
adj. 学校的;学术的
9.require vt.要求→ requirement n.需要;要求
study for a business qualification. 2.“It’s not just study that’s difficult...”explained Xie Lei, who
- 1、下载文档前请自行甄别文档内容的完整性,平台不提供额外的编辑、内容补充、找答案等附加服务。
- 2、"仅部分预览"的文档,不可在线预览部分如存在完整性等问题,可反馈申请退款(可完整预览的文档不适用该条件!)。
- 3、如文档侵犯您的权益,请联系客服反馈,我们会尽快为您处理(人工客服工作时间:9:00-18:30)。
x
y
Variance in x (SSx)
Variance in y (SSy)
Formulas
r SPxy SSxSSy
SPxy X Y XY n
Degrees of Freedom: n – 2
n = number of pairs
SS (i.e., sum of squares) can be computed by using either of the following formula:
Magnitude
Linear Association
Highly dependable relationship Moderate to marked relationship Fair degree of relationship Slight relationship Negligible or chance relationship
r = ±.8 – ±1.00
r = ±.60 ±.79
r = ±.40 ±.59
பைடு நூலகம்
r = ±.20 ±.39
r = ±.00 ±.19
Formula to obtain r value
Covariance (SPxy)
r
SPxy SSxSSy
Ratio between the shared variance (SPxy) and the unique variability in x (SSx) and y (SSy)
SS ( X X ) 2
Hypotheses
Null Hypothesis
=0
There will be no association between variable x and variable y.
E.g., There will be no association between communication apprehension and persuasive adaptation.
independent random samples of pairs of scores normal distributions
Different Types of Association (p. 474)
Linear Associations
Positive
Negative
Curvilinear Association
0
H1
E.g.,
There will be association between communication apprehension and persuasive adaptation.
Conclusions in APA
In order to examine …, a Pearson product moment correlation test was conducted. Results indicated that communication apprehension and persuasive adaptation have a strong negative correlation, r (13) = –.67, p <.05. As communication apprehension increases, ability to adapt persuasive communication decreases.
= - 1.0 Perfect Negative Association r =1.0 Perfect Positive Association r = 0 Curvilinear Association OR No Association
r
r determines
of Relationship Strong – No association Direction of Relationship Positive, Negative, or Curvilinear
***Note: (rho) is a notation for the population r.
Practice: Correlation Worksheet
Hypotheses
H0
=0
E.g.,
There will be no association between communication apprehension and persuasive adaptation.
Correlation
• Correlation
Pearson Product Moment Correlation
examines association/relationship between two variables measured on interval or ratio scales does NOT examine causal relationship assumes that…
Negative Correlation: r = –.67
16 14 12 10 8 6 4 2 0 5 7 9 11 13 15 17 19 21 Communication Apprehension
Persuasive Adaptation
Variance in Variable x
Variance in Variable y
Covariance
Coefficient of Correlation ( = Covariance)
r, Pearson Product Moment Correlation Values range from -1.0 to +1.0
Research Hypothesis
0
There will be association between variable x and variable y.
E.g., There will be association between communication apprehension and persuasive adaptation.
Linear Association
Strong Associations
Positive Negative
Variance in Variable x
Covariance
Variance in Variable y
Variable y
Variable x
Weak Associations
Positive Negative