A Framework for Multi-objective SLA Compliance Monitoring
信息技术服务管理认证试卷

信息技术服务管理认证试卷(答案见尾页)一、选择题1. 信息技术服务管理认证中,哪个要素是服务连续性管理的重要组成部分?A. 事件管理B. 配置管理C. 变更管理D. 问题管理2. 在信息安全管理体系中,哪个标准提供了关于服务连续性的详细描述?A. ISO/IEC 27001B. ISO/IEC 20000-1C. ISO/IEC 22301D. SWOT分析3. 服务级别管理的目标是确保客户对服务的满意度达到或超过预定的标准,这通常通过什么来衡量?A. 故障响应时间B. 服务恢复时间C. 报告的可用性百分比D. 服务水平协议(SLA)的遵守情况4. 在服务质量差距模型中,服务提供者与客户之间的差距通常是什么?A. 服务质量标准B. 客户期望C. 服务交付D. 组织沟通5. 以下哪个选项是服务水平管理的关键组成部分,用于评估和调整服务以满足客户需求?A. 服务目录B. 服务级别协议(SLA)C. 服务报告D. 服务改进6. 在信息技术服务管理中,哪个流程负责确保服务连续性计划的准确性和完整性?A. 变更管理B. 配置管理C. 事件管理D. 问题管理7. 服务级别管理是如何在服务提供商和客户之间建立信任关系的?A. 通过服务水平协议的条款和条件B. 通过定期的服务评审和审计C. 通过提供高质量的服务D. 通过透明的沟通和报告8. 以下哪个选项是服务持续性和灾难恢复计划之间的关系?A. 服务持续性和灾难恢复计划是相同的概念B. 服务持续性好可以保证灾难恢复计划的成功实施C. 灾难恢复计划是服务持续性的一个子集D. 两者之间没有直接关系9. 在ISO/IEC -中,哪个流程负责评估服务提供者的服务连续性管理能力?A. 服务连续性管理流程B. 服务报告流程C. 业务连续性管理流程D. 变更管理流程10. 服务水平管理如何帮助组织实现其业务目标?A. 通过确保服务按需提供B. 通过提高客户满意度C. 通过减少服务中断的时间D. 通过降低运营成本11. 信息技术服务管理的核心是什么?A. 技术支持B. 客户服务C. 系统维护D. 变更管理12. 以下哪个选项是信息技术服务管理体系(ITSM)的基础?A. ISO/IEC 20000-1B. ISO/IEC 27001C. PMPD. ITIL13. 在ITSM中,服务台的主要职责是什么?A. 接待客户咨询B. 提供技术支持C. 监控和报告服务性能D. 实施服务改进措施14. 以下哪个选项不是ITIL框架中的流程?A. 事件管理B. 问题管理C. 变更管理D. 风险管理15. ITIL认为最佳实践是由什么组成的?A. 流程B. 模块C. 指南D. 作业指导书16. 在ITSM中,服务级别管理的目标是确定什么?A. 服务的可用性B. 服务的完整性C. 服务的性能D. 服务的成本17. 以下哪个选项不是信息技术服务管理认证中常用的评估方法?A. 审计B. 问卷调查C. 测试D. 专家评审18. ITIL的版本包括哪几个?A. ITIL v2B. ITIL v3C. ITIL v4D. ITIL v519. 在ITSM中,服务策略定义了什么?A. 服务提供的方式B. 服务的目标C. 服务的优先级D. 服务的预算20. 以下哪个选项不是ITIL框架中的关键活动?A. 服务设计B. 服务转换C. 服务运营D. 服务持续改进21. 信息技术服务管理体系(ITSM)的基础定义是什么?A. ITSM是一种服务管理模型,它通过整合IT服务和流程,提高企业的IT交付能力和客户满意度。
CloudResearch(云服务)_15
Do Clouds Compute?A Framework for Estimating the Value of Cloud ComputingMarkus Klems, Jens Nimis, Stefan TaiFZI Forschungszentrum Informatik Karlsruhe, Germany f klems,nimis, tai g @fzi.de•IntroductionOn-demand provisioning of scalable and reliable compute services, along witha cost model that charges consumers based on actual service usage, hasbeen an objective in distributed computing research and industry for a while.Cloud Computing promises to deliver on this objective: building on compute and storage virtualization technologies, consumers are able to rent infrastructure \in the Cloud"as needed, deploy applications and store data, and access them via Web protocols on a pay-per-use basis.In addition to the technological challenges of Cloud Computing there is a need for an appropriate, competitive pricing model for infrastructure-as-a-service. The acceptance of Cloud Computing depends on the ability to im-plement a model for value co-creation. In this paper, we discuss the need for valuation of Cloud Computing, identify key components, and structure these components in a framework. The framework assists decision makers in esti-mating Cloud Computing costs and to compare these costs to conventional IT solutions.•ObjectiveThe main purpose of our paper is to present a basic framework for estimat-ing value and determine bene ts from Cloud Computing as an alternative to conventional IT infrastructure, such as privately owned and managed IT hard-ware. Our e ort is motivated by the rise of Cloud Computing providers and the question when it is pro table for a business to use hardware resources \in the Cloud". More and more companies already embrace Cloud Computing services as part of their IT infrastructure [1]. However, there is no guide to tell when outsourcing into the Cloud is the way to go and in which cases it does not make sense to do so. With our work we want to give an overview of economic and technical aspects that a valuation approach to Cloud Computing must take into consideration.Valuation is an economic discipline about estimating the value of projects1and enterprises [2]. Corporate management relies on valuation methods in or-der to make reasonable investment decisions. Although the basic methods are rather simple, like Discounted Cash Flow (DCF) analysis, the di culties lie in appropriate application to real world cases.Within the scope of our paper we are not going to cover speci c valuation methods. Instead, we present a generic framework that serves for cost compar-ison analysis between hardware resources \in the Cloud"and a reference model, such as purchasing and installing IT hardware. The result of such a compari-son shows the value of Cloud Computing associated with a speci c project and measured in terms of opportunity costs. In later work the framework must be eshed out with metrics, such as project free cash ows, EBITDA, or other suit-able economic indicators. Existing cost models, such as Gartner's TCO seem promising candidates for the design of a reference model [3].•ApproachA systematic, dedicated approach to Cloud Computing valuation is urgently needed. Previous work from related elds, like Grid Computing, does not con-sider all aspects relevant to Cloud Computing and can thus not be directly applied. Previous approaches tend to mix business objectives with technologi-cal requirements. Moreover, the role of demand behavior and the consequences it poses on IT requirements needs to be evaluated in a new light. Most impor-tant, it is only possible to value the bene t from Cloud Computing if compared to alternative solutions. We believe that a structured framework will be helpful to clarify which general business scenarios Cloud Computing addresses.Figure 1 illustrates our framework for estimating the value of Cloud Com-puting. In the following, we describe in more detail the valuation steps suggested with the framework.2.1 Business ScenarioCloud Computing o ers three basic types of services over the Internet: virtual-ized hardware resources in form of storage capacity and processing power, plus data transfer volume. Since Cloud Computing is based on the idea of Internet-centric computing, access to remotely located storage and processors must be encompassed with su cient data transfer capacities.The business scenario must specify the business domain (internal processes, B2B, B2C, or other), key business objectives (cost e ciency, no SLA viola-tions, short time to market, etc.), the demand behavior (seasonal, temporary spikes, etc.) and technical requirements that follow from business objectives and demand behavior (scalability, high availability, reliability, ubiquitous access, se-curity, short deployment cycles, etc.).23(2) Business DomainIT resources are not ends in themselves but serve speci c business objectives. Organizations can bene t from Grid Computing and Cloud Computing in di er-ent domains: internal business processes, collaboration with business partners and for customer-faced services (compare to [14]). [1] Business ObjectivesOn a high level the typical business bene ts mentioned in the context of Cloud Computing are high responsiveness to varying, unpredictable demand behavior and shorter time to market. The IBM High Performance on Demand Solu-tions group has identi ed Cloud Computing as an infrastructure for fostering company-internal innovation processes [4]. The U.S. Defense Information Sys-tems Agency explores Cloud Computing with the focus on rapid deployment processes, and as a provisionable and scalable standard environment [5].z Demand BehaviorServices and applications in the Web can be divided into two disjoint categories: services that deal with somewhat predictable demand behavior and those that must handle unexpected demand volumes respectively. Services from the rst category must be built on top of a scalable infrastructure in order to adapt to changing demand volumes. The second category is even more challenging, since increase and decrease in demand cannot be forecasted at all and sometimes occurs within minutes or even seconds.Traditionally, the IT operations department of an organization must master the di culties involved in scaling corporate infrastructure up or down. In prac-tice it is impossible to constantly fully utilize available server capacities, which is why there is always a tradeo between resource over-utilization, resulting in glaring usability e ects and possible SLA violations, and under-utilization, leading to negative nancial performance [6]. The IT department dimensions the infrastructure according to expected demand volumes and in a way such that enough space for business growth is left. Moreover, emergency situations, like server outages and demand spikes must be addressed and dealt with. Asso-ciated with under- and over-utilization is the notion of opportunity costs. The opportunity costs of under-utilization are measured in units of wasted compute resources, such as idle running servers. The opportunity costs of over-utilization are the costs of losing customers or being sued as a consequence of a temporary server outage.Expected Demand: Seasonal DemandAn online retail store is a typical service that su ers from seasonal demand spikes. During Christmas the retail store usually faces much higher demand vol-umes than over the rest of the year. The IT infrastructure must be dimensioned such that it can handle even the highest demand peaks in December.Expected Demand: Temporary E ect4Some services and applications are short-lived and targeted to single or sel-dom events, such as Websites for the Olympic Games 2008 in Beijing. As seen with seasonal demand spikes, the increase and decrease of demand volume is somewhat predictable. However, the service only exists for a comparably short period of time, during which it experiences heavy tra c loads. After the event, the demand will decrease to a constant low level and the service be shut down eventually.Expected Demand: Batch ProcessingThe third category of expected demand scenarios are batch processing jobs. In this case the demand volume is usually known beforehand and does not need to be estimated.Unexpected demand: Temporary E ectThis scenario is similar to the \expected temporary e ect", except for one major di erence: the demand behavior cannot be predicted at all or only short time in advance. A typical example for this scenario is a Web start-up company that becomes popular over night because it was featured on a news network. Many people simultaneously rush to the Website of the start-up company, caus-ing signi cant tra c load and eventually bringing down the servers. Named after two famous news sharing Websites this phenomenon is known as \Slash-dot e ect"or \Digg e ect".[12] Technical RequirementsBusiness objectives are put into practice with IT support and thus translate into speci c IT requirements. For example, unpredictable demand behavior translates to the need for scalability and high availability even in the face of signi cant tra c spikes; time to market is directly correlated with deployment times.z Costs of Cloud ComputingAfter having modeled a business scenario and the estimated demand volumes, it is now time to calculate the costs of a Cloud Computing setting that can ful ll the scenario's requirements, such as scalability and high availability.A central point besides the scenario properties mentioned in section3.1.3 is the question: how much storage capacity and processing power is needed in order to cope with demand and how much data transfer will be used? The numbers might either be xed and already known beforehand or are unknown and must be estimated.In a next step a Utility Computing model needs to de ne compute units and thus provides a metric to convert and compare computing resources between the Cloud and alternative infrastructure services. Usually the Cloud Comput-ing provider de nes the Utility Computing model, associated with a pricing scheme, such as Amazon EC2 Compute Units (ECU). The vendor-speci c model can be converted into a more generic Utility Computing unit, such as FLOPS, I/O operations, and the like. This might be necessary when comparing Cloud5Computing o ers of di erent vendors. Since Cloud Computing providers charge money for their services based on the Utility Computing model, these pricing schemes can be used in order to determine the direct costs of the Cloud Com-puting scenario. Indirect costs comprise soft factors, such as learning to use tools and gain experience with Cloud Computing technology.3. Costs of the Reference IT Infrastructure ServiceThe valuation of Cloud Computing services must take into account its costs as well as the cash ows resulting from the underlying business model. Within the context of our valuation approach we focus on a cost comparison between infrastructure in the Cloud and a reference infrastructure service. Reaching or failing to reach business objectives has an impact on cash ows and can therefore be measured in terms of monetary opportunity costs.The reference IT infrastructure service might be conventional IT infrastruc-ture (SME or big business), a hosted service, a Grid Computing service, or something else. This reference model can be arbitrarily complex and detailed, as long as it computes the estimated resource usage in a similar manner as in the Cloud Computing scenario of section 3.2. The resource usage will not in all cases be the same as in the Cloud Computing scenario. Some tasks might e.g. be computed locally, thus saving data transfer. Other di erences could result from a totally di erent approach that must be taken in order to ful ll the business objectives de ned in the business scenario.In the case of privately owned IT infrastructure, cost models, such as Gart-ner's TCO [3], provide a good tool for calculations [8]. The cost model should comprise direct costs, such as Capital Expenditures for the facility, energy and cooling infrastructure, cables, servers, and so on. Moreover, there are Opera-tional Expenditures which must be taken into account, such as energy, network fees and IT employees. Indirect costs comprise costs from failing to meet busi-ness objectives, e.g. time to market, customer satisfaction or Quality of Service related Service Level Agreements. There is no easy way to measure how this can be done and will vary from case to case. More sophisticated TCO models must be developed to mitigate this shortcoming. One approach might be to compare cash ow streams that result from failing to deliver certain business objectives, such as short time to market. If the introduction of a service o ering is delayed due to slow deployment processes, the resulting de cit can be calculated as a discounted cash ow.When all direct and indirect costs have been taken into account, the total costs of the reference IT infrastructure service can be calculated by summing up. Finally, costs of the Cloud Computing scenario and the reference model scenario can be compared.64. Evaluation and DiscussionEarly adopters of Cloud Computing technologies are IT engineers who work on Web-scale projects, such as the New York Times TimesMachine [9]. Start-ups with high scalability requirements turn to Cloud Computing providers, such as Amazon EC2, in order to roll out Web-scale services with comparative low entry costs [7]. These and other examples show that scalability, low market barriers and rapid deployment are among the most important drivers of Cloud Computing.5. New York Times TimesMachineIn autumn 2007 New York Times senior software engineer Derek Gottfrid worked on a project named TimesMachine. The service should provide access to any New York Times issue since 1851, adding up to a bulk of 11 million articles which had to be served in the form of PDF les. Previously Gottfrid and his colleagues had implemented a solution that generated the PDF les dynamically from already scanned TIFF images of the New York Times articles. This approach worked well, but when tra c volumes were about to increase signi cantly it would be better to serve pre-generated static PDF les.Faced with the challenge to convert 4 Terabyte of source data into PDF, Derek Gottfrid decided to make use of Amazon's Web Services Elastic Compute Cloud (EC2) and Simple Storage Service (S3). He uploaded the source data to S3 and started a Hadoop cluster of customized EC2 Amazon Machine Images (AMIs). With 100 EC2 AMIs running in parallel he could complete the task of reading the source data from S3, converting it to PDF and storing it back to S3 within 36 hours.How does this use case t in our framework?Gottfrid's approach was motivated by the simplicity with which the one-time task could be accomplished if performed \in the Cloud". No up-front costs were involved, except for insigni cant expenditures when experimenting if the endeavor was feasible at all. Due to the simplicity of the approach and the low costs involved, his superiors agreed without imposing bureaucratic obstacles.Another key driver was to cut short deployment times and thereby time to market. The alternative to Amazon EC2 and S3 would have been to ask for permission to purchase commodity hardware, install it and nally run the tasks - a process that very likely would have taken several weeks or even months. After process execution, the extra hardware would have to be sold or used in another context.This use case is a good example for a one-time batch-processing job that can be performed in a Grid Computing or Cloud Computing environment. From the backend engineer's point of view it is favorable to be able getting started without much con guration overhead as only the task result is rele vant. The data storage and processing volume is known beforehand and no measures have to be taken to guarantee scalability, availability, or the like.7In a comparative study researchers from the CERN-based EGEE project argue that Clouds di er from Grids in that they served di erent usage patterns. While Grids were mostly used for short-term job executions, clouds usually sup-ported long-lived services [10]. We agree that usage patterns are an important di erentiator between Clouds and Grids, however, the TimesMachine use case shows that this not a question of service lifetime. Clouds are well-suited to serve short-lived usage scenarios, such as batch-processes or situational Mash-up ser-vices.1 Major League BaseballMLB Advanced Media is the company that develops and maintains the Major League Baseball Web sites. During the 2007 season, director of operations Ryan Nelson received the request to implement a chat product as an additional service to the Web site [11]. He was told that the chat had to go online as soon as possible. However, the company's data center in Manhattan did not leave much free storage capacity and processing power.Since there was no time to order and install new machines, Nelson decided to call the Cloud Computing provider Joyent. He arranged for 10 virtual machines in a development cluster and another 20 machines for production mode. Nelson's team developed and tested the chat for about 2 months and then launched the new product. When the playo s and World Series started, more resources were needed. Another 15 virtual machines and additional RAM solved the problem.Ryan Nelson points out two major advantages of this approach. First, the company gains exibility to try out new products quickly and turn them o if they are not a success. In this context, the ability to scale down shows to be equally important as scaling up. Furthermore, Nelson's team can better respond to seasonal demand spikes which are typical for Web sites about sports events. 6) Related WorkVarious economic aspects of outsourcing storage capacities and processing power have been covered by previous work in distributed computing and grid comput-ing [12], [13], [14], [15]. However, the methods and business models introduced for Grid Computing do not consider all economic drivers which we identi ed relevant for Cloud Computing, such as pushing for short time to market in the context of organization inertia or low entry barriers for start-up companies.With a rule of thumb calculation Jim Gray points to the opportunity costs of distributed computing in the Internet as opposed to local computations, i.e. in LAN clusters [12]. In his scenario $1 USD equals 1 GB sent over WAN or alter-natively eight hours CPU processing time. Gray reasons that except for highly processing-intensive applications outsourcing computing tasks into a distributed environment does not pay o because network tra c fees outnumber savings in processing power. Calculating the tradeo between basic computing services can be useful to get a general idea of the economies involved. This method can8910easily be applied to the pricing schemes of Cloud Computing providers. For $1 USD the Web Service Amazon EC2 o ers around 6 GB data transfer or 10 hours CPU processing 1. However, this sort of calculation only makes sense if placed in a broader context. Whether or not computing services can be performed locally depends on the underlying business objective. It might for example be necessary to process data in a distributed environment in order to enable online collaboration. George Thanos, et al evaluate the adoption of Grid Computing technology for business purposes in a more comprehensive way [14]. The authors shed light on general business objectives and economic issues associated with Grid Computing, such as economies of scale and scope, network externalities, market barriers, etc. In particular, the explanations regarding the economic rationale behind complementing privately owned IT infrastructure with utility comput-ing services point out important aspects that are also valid for our valuation model. Cloud Computing is heavily based on the notion of Utility Computing where large-scale data centers play the role of a utility that delivers computing services on a pay-per-use basis. The business scenarios described by Thanos, et al only partially apply to those we can observe in Cloud Computing. Important bene ts associated with Cloud Computing, such as shorter time to market and responsiveness to highly varying demand, are not covered. These business objec-tives bring technological challenges that Cloud Computing explicitly addresses, such as scalability and high availability in the face of unpredictable short-term demand peaks.4 Conclusion and Future Work Cloud Computing is an emerging trend of provisioning scalable and reliable services over the Internet as computing utilities. Early adopters of Cloud Com-puting services, such as start-up companies engaged in Web-scale projects, intu-itively embrace the opportunity to rely on massively scalable IT infrastructure from providers like Amazon. However, there is no systematic, dedicated ap-proach to measure the bene t from Cloud Computing that could serve as a guide for decision makers to tell when outsourcing IT resources into the Cloud makes sense. We have addressed this problem and developed a valuation framework that serves as a starting point for future work. Our framework provides a step-by-step guide to determine the bene ts from Cloud Computing, from describing a business scenario to comparing Cloud Computing services with a reference IT solution. We identify key components: business domain, objectives, demand behavior and technical requirements. Based on business objectives and technical requirements, the costs of a Cloud Computing service, as well as the costs of a reference IT solution, can be calculated and compared. Well-known use cases of1According to the Amazon Web Service pricing in July 2008 one GB of outgoing tra c costs $0.17 for the rst 10 TB per month. Running a s mall AMI instance w ith the compute capacity of a 1.0-1.2 GHz 2007 Xeon or Opteron processor for one hour costs $0.10 USD.11Cloud Computing adopters serve as a means to discuss and evaluate the validity of our framework.In future work, we will identif y and analyze concrete valuation methods that can be applied within the context of our framework. Furthermore, it is necessary to evaluate cost models that might serve as a template for estimating direct and indirect costs, a key challenge that we have only mentioned.References1. Amazon Web Services: Customer Case Studies,/Success-Stories-AWS-home-page/b/ref=sc_fe_l_1?ie=UTF8&node=182241011&no=34406612. Titman, S.,Martin, J.: Valuation. The Art & Science of CorporateInvest-ment Decisions, Addison-Wesley (2007)3. Gartner TCO, /TCO/index.htm4. Chiu, W..: From Cloud Computing to the New Enterprise Data Center,IBM High Performance On Demand Solutions (2008)[5] Pentagon's IT Unit Seeks to Adopt Cloud Comput-ing, New York Times,/idg/IDG_852573C400693880002574890080F9EF.html?ref=technology[6] Schlossnagle, T.: Scalable Internet Architectures, Sams Publishing (2006)[7] PowerSet Use Case, /b?ie=UTF8&node=331766011&me=A36L942TSJ2AJA[8] Koomey, J.: A Simple Model for Determining True Total Cost ofOwnership for Data Centers, Uptime Institute (2007)[9] New York Times TimesMachine use case, /2007/11/01/self-service-prorated-super-computing-fun/[10] Begin, M.: An EGEE Comparative Study: Grids and Clouds - Evolution orRevolution?, CERN Enabling Grids for E-Science (2008)[11] Major League Baseball use case, /news/2007/121007-your-take-mlb.html[12] Gray, J.: Distributed Computing Economics. Microsoft ResearchTechnical Report: MSRTR- 2003-24, Microsoft Research (2003)[13] Buyya, R.,Stockinger, H.,Giddy, J.,Abramson, D.: Economic Models forManagement of Resources in Grid Computing, ITCom (2001)121 Thanos, G., Courcoubetis, C., Stamoulis, G.: Adopting the Grid forBusi-ness Purposes: The Main Objectives and the Associated Economic Is-sues, Grid Economics and Business Models: 4th International Workshop, GECON (2007)2 Hwang, J.,Park, J.: Decision Factors of Enterprises for Adopting GridComputing, Grid Economics and Business Models: 4th International Work-shop, GECON (2007)13。
间充质干细胞治疗阿尔茨海默症的研究进展

间充质干细胞治疗阿尔茨海默症的研究进展云南省基础研究计划-青年项目(2019FD106)*通讯作者:曹宁 Email:******************摘要:阿尔茨海默症是一种神经退行性疾病,目前还没有找到有效的治疗方法。
间充质干细胞作为一种有着广泛应用前景的细胞治疗技术,近年来引起了研究人员的关注。
间充质干细胞是一种具有自我更新和多向分化潜能的细胞,它们还能分泌多种细胞因子,这些因子有助于促进神经再生和修复。
本文就间充质干细胞治疗阿尔茨海默症的研究进展做一综述,以期为未来的临床应用提供更深入的了解和指导。
关键词:间充质干细胞;阿尔茨海默症;治疗;研究进展阿尔茨海默症(Alzheimer's disease,AD) 是一种进行性神经退行性疾病,以进行性记忆力减退和获得性知识丧失、直至完全丧失日常生活活动能力为特征,正迅速成为老年人残疾和死亡的主要原因之一。
2022年国际阿尔茨海默病协会(Alzheimer's Disease International, ADI)发布报告[1],截至2019年,全球约有2019年患痴呆的人数估计为5500万人,预计2050年将增至1.39亿。
ADI评估,全球75%的AD患者未被确诊,在一些中低收入国家,这一比例高达90%。
世界卫生组织估计,2019年全球痴呆症的社会成本为1.3万亿美元[2]。
1.阿尔茨海默症的治疗现状AD的两大病理特征是Aβ沉积形成老年斑(Senile plaque, SP)和Tau蛋白缠结形成神经原纤维缠结(Neurofibrillary tangles, NFTs),另外还有神经退行性疾病的共有特征,即大量神经元的凋亡[3]。
目前,治疗阿尔茨海默病(AD)的主要药物包括乙酰胆碱酯酶抑制剂,如多奈哌齐、利瓦斯汀和加兰他敏,以及NMDA受体的部分拮抗剂美金刚。
这些药物的作用是通过不同的机制来改善AD患者的症状和延缓疾病的进展。
英语七年级教研组活动(3篇)

第1篇Introduction:The English Department at [School Name] has recently organized a comprehensive教研组活动 (research group activity) aimed at enhancingthe teaching techniques and collaboration among the 7th-grade English teachers. This event was a platform for sharing best practices, discussing innovative teaching methods, and fostering a collaborative environment that promotes continuous professional development. The following report outlines the key aspects of the activity.Objective:The primary objective of the教研组活动 was to:1. Improve the overall quality of English teaching in the 7th grade.2. Promote a culture of collaboration and sharing among teachers.3. Explore and implement innovative teaching strategies to engage students more effectively.4. Provide a space for teachers to reflect on their teaching practices and seek feedback from their peers.Activity Outline:1. Opening Remarks and Welcome- The head of the English Department, Mr. [Last Name], opened the session with a warm welcome and emphasized the importance of continuous improvement in teaching methods.- He highlighted the role of the教研组活动 in achieving the department's goals.2. Workshop on Teaching Techniques- A workshop was conducted by Ms. [Last Name], a seasoned English teacher with extensive experience in the 7th grade. The workshop focused on various teaching techniques such as:- Inquiry-based learning- Flipped classroom approach- Gamification of learning- Differentiated instruction- Participants engaged in interactive activities and discussions, sharing their experiences and challenges in implementing these techniques.3. Case Studies and Best Practices- Three teachers from the 7th grade presented case studies of successful teaching strategies they had used in their classrooms. The case studies included:- Effective use of technology in language learning- Implementing project-based learning to enhance student engagement- Utilizing peer tutoring to improve student performance- The presentations were followed by a Q&A session, where other teachers asked questions and sought advice on how to replicate these strategies in their own classrooms.4. Collaborative Planning Session- The group divided into smaller teams to plan a joint project that would involve multiple teachers and classes. The project aimed to create a cohesive learning experience for the 7th-grade students.- Each team discussed the project's objectives, activities, and assessment methods. They also shared their ideas on how to involve students in the planning process.- The teams presented their plans to the larger group, receiving feedback and suggestions for improvement.5. Feedback and Reflection- Each participant filled out a feedback form, sharing their thoughts on the activity and suggesting areas for future improvement.- A reflection session was held, where teachers discussed the highlights of the activity and how they planned to apply the new knowledge and skills in their teaching.6. Closing Remarks- Mr. [Last Name] concluded the activity by thanking all participants for their active involvement and commitment to improving their teaching practices.- He encouraged teachers to continue collaborating and supporting each other in their professional journey.Conclusion:The 7th-grade English教研组活动 was a resounding success, providing a valuable opportunity for teachers to enhance their teaching techniques and collaborate effectively. The event fostered a positive and supportive environment, where teachers felt comfortable sharing their experiences and learning from each other. The strategies and resources discussed during the activity are expected to have a significant impact on the quality of English teaching in the 7th grade at [School Name]. The English Department is committed to organizing similar activities in the future, ensuring that teachers continue to grow professionally and provide the best possible education to their students.第2篇Introduction:The English Department of our school has always attached great importance to the research and teaching of English for Grade 7 students. In order to improve the teaching quality and promote the development of our students, we held an English Grade 7 Research and Teaching Group Activity recently. This activity aimed to share teaching experiences, discuss teaching methods, and explore new ideas for English teaching.I. Activity Objectives:1. Enhance the teaching quality of English for Grade 7 students.2. Promote the communication and exchange of teaching ideas among teachers.3. Explore new teaching methods and strategies for English teaching.4. Improve the students' English proficiency and interest in learning.II. Activity Content:1. Opening RemarksThe activity was opened by the head of the English Department, who emphasized the importance of teaching English for Grade 7 students and the significance of this activity. He also expressed his expectationsfor the activity and encouraged all teachers to actively participate and share their experiences.2. Sharing Teaching ExperiencesSeveral experienced teachers shared their teaching experiences and strategies. They discussed various aspects of teaching English for Grade 7 students, including classroom management, vocabulary teaching, reading comprehension, and writing skills. The following are some of the key points they shared:(1) Classroom management: Teachers should create a positive and engaging classroom atmosphere to encourage students to participate actively in class. They can use various teaching aids, such as multimedia, games, and group activities, to make the classroom more interesting.(2) Vocabulary teaching: Teachers should focus on teaching practical and useful vocabulary, and encourage students to use new words in theirdaily life. They can use word cards, flashcards, and word games to help students memorize new words.(3) Reading comprehension: Teachers should guide students to develop their reading skills, such as skimming, scanning, and intensive reading.They can provide various reading materials, such as short stories, news articles, and poems, to meet the diverse interests of students.(4) Writing skills: Teachers should teach students the basic structure of writing and encourage them to express their thoughts and ideas in English. They can use various writing activities, such as journal writing, story writing, and essay writing, to improve students' writing skills.3. Discussion on Teaching MethodsThe teachers engaged in a lively discussion on various teaching methods, such as project-based learning, flipped classroom, and cooperative learning. They shared their experiences and thoughts on these methods, and explored how to effectively implement them in their teaching practice.4. Workshops and TrainingWorkshops and training sessions were organized to provide teachers with practical skills and knowledge. These sessions covered topics such as grammar teaching, pronunciation, and test preparation. The teachers actively participated in these sessions and gained valuable insights.5. Conclusion and SummaryThe activity concluded with a summary of the key points discussed and a discussion on the future direction of English teaching for Grade 7 students. The head of the English Department expressed his gratitude to all the teachers for their active participation and contribution to the activity.III. Activity Evaluation:1. The activity achieved its objectives, as the teachers shared their experiences and discussed various teaching methods, which will undoubtedly improve the teaching quality of English for Grade 7 students.2. The communication and exchange of teaching ideas among teachers were fruitful, and they gained valuable insights from each other's experiences.3. The teachers actively participated in the workshops and training sessions, which will help them improve their teaching skills and knowledge.Conclusion:The English Grade 7 Research and Teaching Group Activity was a great success, as it provided a platform for teachers to share their experiences, discuss teaching methods, and explore new ideas for English teaching. We believe that this activity will contribute to the continuous improvement of our students' English proficiency and interest in learning. In the future, we will continue to hold such activities to promote the development of English teaching in our school.第3篇IntroductionThe English Language教研组 (Research and Development Group) of our school has always been committed to fostering a dynamic and engaging learning environment for our seventh-grade students. With the aim of enhancing the quality of English language education, we organized a comprehensive教研活动 to explore innovative teaching strategies and share best practices. This report outlines the objectives, activities, and outcomes of the event.Objectives1. To identify and discuss effective teaching strategies that promote active learning in English language classes.2. To explore the integration of technology in English language education.3. To share experiences and best practices among the教研组 members.4. To develop a collaborative framework for continuous professional development within the group.Activity Details1. Opening SessionThe session began with a welcoming address by the教研组长, who emphasized the importance of continuous improvement in teaching methods. The group was reminded of the diverse learning styles and needs of seventh-grade students, highlighting the need for tailored teaching approaches.2. Workshops and Presentationsa. Workshop on Project-Based Learning (PBL): facilitated by Mr. Zhang, a seasoned English teacher. The workshop focused on the benefits of PBL in fostering critical thinking and collaborative skills. Participants engaged in a practical activity, designing a PBL project for a seventh-grade class.b. Interactive Presentation on Technology Integration: presented by Ms. Liu, a technology specialist. The presentation covered various digital tools and platforms that can enhance language learning, such as educational apps, online dictionaries, and virtual reality experiences.c. Case Study Sharing: three teachers shared their experiences of implementing innovative strategies in their classrooms. The case studies highlighted the use of flipped classrooms, peer teaching, and differentiated instruction.3. Group Discussions and ReflectionsParticipants were divided into small groups to discuss the following topics:- The impact of technology on language learning.- Strategies for promoting student engagement and motivation.- The role of the teacher as a facilitator of learning.Each group presented their findings, and the entire group engaged in a lively debate on the best approaches to teaching English in the seventh grade.4. Action Plan DevelopmentBased on the discussions and presentations, the教研组 developed anaction plan to implement the following initiatives:- Introduce a minimum of two technology tools in each English class.- Encourage the use of project-based learning in at least one unit per term.- Organize regular workshops for teachers to share best practices and receive professional development.OutcomesThe教研活动取得了以下成果:1. Enhanced Collaboration: The event fostered a collaborative environment where teachers felt comfortable sharing their experiencesand ideas.2. Increased Awareness: Participants gained a deeper understanding of innovative teaching strategies and their potential impact on student learning.3. Improved Professional Development: The action plan will provide a structured framework for continuous professional growth within the教研组.4. Enhanced Student Learning: The implementation of the proposed initiatives is expected to lead to improved student engagement, motivation, and academic performance.ConclusionThe seventh-grade English Language教研组活动圆满结束,取得了显著的成效。
美国赛博空间作战行动Cyberspace _Operations

CHAPTER II
CYBERSPACE OPERATIONS CORE ACTIVITIES
Introduction................................................................................................................II-1
3.应用
a、本出版物中确立的联合原则适用于联合参谋部、作战司令部指挥官、下属统一司令部、联合特遣部队、这些司令部的下属部门、各军种和作战支持机构。
b、本出版物中的指南具有权威性;因此,除非指挥官认为特殊情况另有规定,否则将遵循这一原则。如果本出版物的内容与出版物的内容发生冲突,则以本出版物为准,除非参谋长联席会议通常与其他参谋长联合会成员协调,提供了更为现行和具体的指导。作为多国(联盟或联盟)军事指挥部一部分的部队指挥官应遵循美国批准的多国原则和程序。对于未经美国批准的条令和程序,指挥官应评估并遵循多国司令部的条令与程序,如果适用并符合美国法律、法规和条令。
•联合职能部门和网络空间运作
第三章权限、角色和职责
•简介III-1
•当局III-2
•角色和职责
•法律考虑因素III-11
第四章规划、协调、执行和评估
•联合规划过程和网络空间运营
•网络空间运营规划考虑因素
•对网络空间的情报和操作分析支持
运营计划IV-6
•针对性IV-8
•网络空间部队的指挥与控制
二语习得(L1)

Course components
Lectures Discussions Assignments Research
Course assessment
Attendance and participation in class discussion (10%) Assignment (20%) Course paper (70%)
Course outline
L1 Introduction to SLA and SLA research L2 The role of the first language L3 The ‘natural’ route of development L4 Contextual variation in language-learner language L5 Individual learner differences L6 The role of the input L7 Learner processes(Learner strategies) L8 Learner processes(The universal hypothesis and SLA) L9 The role of formal instruction L10 Theories of second language acquisition
Students will be able to better describe the psychological and linguistic processes of second language acquisition Students will be able to better identify what internal and external factors help account for why learners do or do not acquire a second language Students will be able to better explain how such factors affect students' classroom performance Students will be able to have a greater understanding of the literature in the field of second language acquisition and develop greater skills in critically reading, understanding, and dissecting that literature Students will be able to relate issues discussed in class to past, current, and prospective learning/teaching experiences and to their future formal and informal research
二语习得引论-读书笔记-chapter-1-2
一.概论Chapter 1. Introducing SLA1.Second language acquisition (SLA)2.Second language (L2)(也可能是第三四五外语) also commonly called a target language (TL)3.Basic questions:1). What exactly does the L2 learner come to know?2). How does the learner acquire this knowledge?3). Why are some learners more successful than others?4.linguistic; psychological; social.Only one (x) Combine (√)Chapter 2. Foundations of SLAⅠ. The world of second languages1.Multi-; bi-; mono- lingualism1)Multilingualism: the ability to use 2 or more languages.(bilingualism: 2 languages; multilingualism: >2)2)Monolingualism: the ability to use only one language.3)Multilingual competence (Vivian Cook, Multicompetence)Refers to: the compound state of a mind with 2 or more grammars.4)Monolingual competence (Vivian Cook, Monocompetence)Refers to: knowledge of only one language.2.People with multicompetence (a unique combination) ≠ 2 monolingualsWorld demographic shows:3.Acquisition4.The number of L1 and L2 speakers of different languages can only beestimated.1)Linguistic information is often not officially collected.2)Answers to questions seeking linguistic information may not bereliable.3) A lack of agreement on definition of terms and on criteria foridentification.Ⅱ. The nature of language learning1.L1 acquisition1). L1 acquisition was completed before you came to school and thedevelopment normally takes place without any conscious effort.2). Complex grammatical patterns continue to develop through the1) Refers to: Humans are born with an innate capacity to learnlanguage.2) Reasons:♦Children began to learn L1 at the same age and in much the same way.♦…master the basic phonological and grammatical operations in L1 at 5/ 6.♦…can understand and create novel utterances; and are not limited to repeating what they have heard; the utterances they produce are often systematically different from those of the adults around them.♦There is a cut-off age for L1 acquisition.♦L1 acquisition is not simply a facet of general intelligence.3)The natural ability, in terms of innate capacity, is that part oflanguage structure is genetically “given” to every human child.3. The role of social experience1) A necessary condition for acquisition: appropriate socialexperience (including L1 input and interaction) is2) Intentional L1 teaching to children is not necessary and may havelittle effect.3) Sources of L1 input and interaction vary for cultural and socialfactors.4) Children get adequate L1 input and interaction→sources has littleeffect on the rate and sequence of phonological and grammatical development.The regional and social varieties (sources) of the input→pronunciationⅢ. L1 vs. L2 learningⅣ. The logical problem of language learning1.Noam Chomsky:1)innate linguistic knowledge must underlie language acquisition2)Universal Grammar2.The theory of Universal Grammar:Reasons:1)Children’s knowledge of language > what could be learned from theinput.2)Constraints and principles cannot be learned.3)Universal patterns of development cannot be explained bylanguage-specific input.Children often say things that adults do not.♦Children use language in accordance with general universal rules of language though they have not developed the cognitive ability to understand these rules. Not learned from deduction or imitation.♦Patterns of children’s language development are not directly determined by the input they receive.。
纹理物体缺陷的视觉检测算法研究--优秀毕业论文

摘 要
在竞争激烈的工业自动化生产过程中,机器视觉对产品质量的把关起着举足 轻重的作用,机器视觉在缺陷检测技术方面的应用也逐渐普遍起来。与常规的检 测技术相比,自动化的视觉检测系统更加经济、快捷、高效与 安全。纹理物体在 工业生产中广泛存在,像用于半导体装配和封装底板和发光二极管,现代 化电子 系统中的印制电路板,以及纺织行业中的布匹和织物等都可认为是含有纹理特征 的物体。本论文主要致力于纹理物体的缺陷检测技术研究,为纹理物体的自动化 检测提供高效而可靠的检测算法。 纹理是描述图像内容的重要特征,纹理分析也已经被成功的应用与纹理分割 和纹理分类当中。本研究提出了一种基于纹理分析技术和参考比较方式的缺陷检 测算法。这种算法能容忍物体变形引起的图像配准误差,对纹理的影响也具有鲁 棒性。本算法旨在为检测出的缺陷区域提供丰富而重要的物理意义,如缺陷区域 的大小、形状、亮度对比度及空间分布等。同时,在参考图像可行的情况下,本 算法可用于同质纹理物体和非同质纹理物体的检测,对非纹理物体 的检测也可取 得不错的效果。 在整个检测过程中,我们采用了可调控金字塔的纹理分析和重构技术。与传 统的小波纹理分析技术不同,我们在小波域中加入处理物体变形和纹理影响的容 忍度控制算法,来实现容忍物体变形和对纹理影响鲁棒的目的。最后可调控金字 塔的重构保证了缺陷区域物理意义恢复的准确性。实验阶段,我们检测了一系列 具有实际应用价值的图像。实验结果表明 本文提出的纹理物体缺陷检测算法具有 高效性和易于实现性。 关键字: 缺陷检测;纹理;物体变形;可调控金字塔;重构
Keywords: defect detection, texture, object distortion, steerable pyramid, reconstruction
II
- 1、下载文档前请自行甄别文档内容的完整性,平台不提供额外的编辑、内容补充、找答案等附加服务。
- 2、"仅部分预览"的文档,不可在线预览部分如存在完整性等问题,可反馈申请退款(可完整预览的文档不适用该条件!)。
- 3、如文档侵犯您的权益,请联系客服反馈,我们会尽快为您处理(人工客服工作时间:9:00-18:30)。
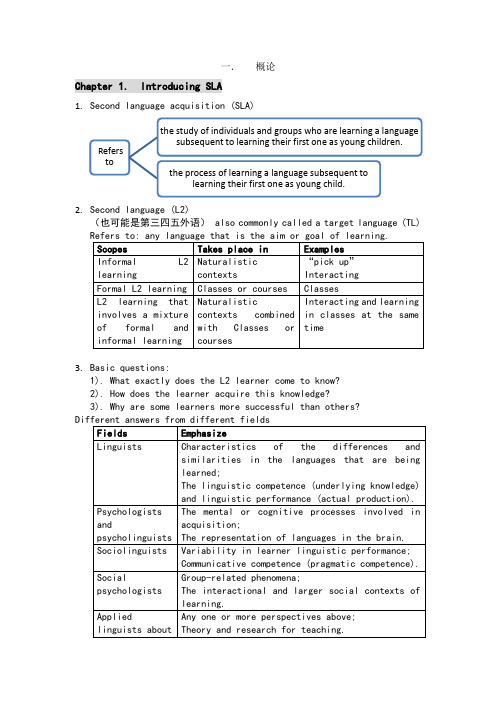
A Framework for Multi-objective SLA ComplianceMonitoringJoel Sommers∗,Paul Barford∗,Nick Duffield†,Amos Ron∗∗University of Wisconsin-Madison†AT&T Labs–ResearchAbstract—Service level agreements(SLAs)specify performance guar-antees made by service providers,typically in terms of packet loss,delay,delay variation,and network availability.While many tools have been developed to measure individual as-pects of network performance,there has been little work to directly address the issue of SLA compliance monitoring in an operational setting where accuracy,parsimony,and other related issues are of vital importance.This paper takes the following steps toward addressing this problem:(1)we introduce an architectural framework for integrating multiple discrete-time active measurement algorithms,an architecture that we call multi-objective monitoring;and(2),we introduce a new active measurement methodology to monitor the packet loss rate along a network path for determining compliance with specified performance targets which significantly improves accuracy over existing techniques.We present a prototype implementation of our monitoring framework,and demonstrate how a unified probe stream can consume lower overall bandwidth than if individual streams are used to measure different path properties.We demonstrate the accuracy and convergence properties of the loss rate monitoring capability of SLA M in a controlled laboratory environment using a range of background traffic scenarios and examine its accuracy improvements over existing techniques.I.I NTRODUCTIONIP networks have become indispensible to businesses,gov-ernments,and individuals,worldwide.Reflecting this impor-tance,it is increasingly common for service providers to offer transport-level performance guarantees using metrics such as packet loss,delay,and network network availability as part of their service level agreements(SLAs)[1]–[4].Meeting agreed-upon performance targets results in the collection of revenue for the service provider,whereas not meeting these objectives can result in credits and loss of revenue to the customer. Accurate network monitoring for the purpose of detecting compliance with performance goals is therefore critical to both parties.The problem of monitoring compliance with agreed-upon performance metrics is a key challenge of SLA engineering.A provider must design SLAs that can be accurately and efficiently monitored,while at the same time minimizing the possibility of non-compliance.For example,guaranteeing a very low loss rate might be possible only if loss rates can be estimated in a lightweight way with sufficiently high confidence.While passive measurements(e.g.,SNMP MIB counters)may provide adequate accuracy for a metric such as loss on a link-by-link basis,they are insufficient for estimating the actual performance experienced by customer traffic(e.g.,due to dynamic routing changes or hardware failures).Thus, although there are situations where active measurements may be too heavyweight or may yield inaccurate results[5]–[7], they nonetheless remain a key mechanism for SLA compliance monitoring.In this paper,we address the following question:can SLA compliance be accurately monitored with a single lightweight probe stream?There have been a number of active measure-ment tools and methodologies proposed over the years to estimate transport-level performance characteristics.Even so, there has been little work to directly address the problem of SLA compliance monitoring.In this context,measurement tool accuracy,parsimony,ability to report confidence bounds,and ability to quickly adapt to changing network conditions are of great importance.Thefirst contribution of this work is the introduction of a framework for integrating multiple discrete time-based active measurement algorithms.Modules for estimating individual path characteristics interact with a central probe scheduler such that a given probe may be used for multiple purposes.The result is a unified probe stream that can consume lower overall bandwidth than if individual streams are used.Moreover, each module operates independently,thus preserving desirable statistical and accuracy properties for each estimation method. We describe the implementation of our framework in a tool called SLA M(SLA M onitor).The second contribution of this paper is the introduction of a new active measurement methodology for estimating end-to-end packet loss rate.Starting from the geometric probe methodology described in[7],we develop a heuristic technique for estimating packet loss rate along a path that significantly improves accuracy over existing approaches.We implement this new methodology as a SLA M module.We demonstrate the properties of SLA M in a controlled laboratory environment using a range of background traffic scenarios.We compare SLA M’s loss estimation accuracy with both Poisson and periodic streams of the same rate,and exam-ine the convergence and robustness of SLA M loss estimates. Our experiments reveal that SLA M estimates the end-to-end loss rate with high accuracy and with good confidence bounds. For example,in a scenario using self-similar background traffic,the true loss rate over a15minute period is0.08% and the SLA M estimate is0.07%.In contrast,Poisson and periodic methods for estimating loss rate have errors of more than two orders of magnitude.II.R ELATED W ORKWhile many details of SLAs are considered proprietary, general aspects and structure of SLAs are discussed in[1], [8].Performance guarantees associated with SLAs range from network path availability,to transport-related metrics such as packet loss,to application-specific metrics such as web response times and voice stream quality.Such guarantees may be based on various statistics of the given metric,such as the mean,median,or a high quantile such as the95th percentile, computed over various time scales.Examples of the types of performance assurances offered by commercial providers are available online[2]–[4].To ensure that SLA performance targets are met with high probability,service providers collect measurements either passively within the network,by injecting measurement probes into the network,or by using a combination of both[9]–[12].While active measurement-based compliance monitoring has received some attention in the past,e.g.,[9],there has been little validation in realistic environments where a reliable basis for comparison can be established.Furthermore,practical issues such as balancing the impact of measurement tools on the network with estimation accuracy have seen less atten-tion.Our work also takes an active measurement approach, introducing a framework for simultaneous,or multi-objective, measurement of transport-level performance metrics which can reduce the overall impact of the measurement process. We further differentiate our work through validation in a controlled,realistic testbed.There has been a great deal of work on the problem of measuring end-to-end packet loss,e.g.,[13]–[20].While there has been limited work addressing the accuracy of common measurement approaches,exceptions are found in[5]–[7].The issue of accuracy clearly has serious implications for SLA compliance monitoring.III.M ULTI-OBJECTIVE P ROBINGIn this section,we introduce an architectural framework for integrating multiple discrete-time active measurement algo-rithms in a single probe scheduler to provide simultaneous estimation different network path properties.Consider an ISP that wishes to monitor packet loss using the algorithm of[7],and simultaneously monitor packet delay and delay variation.Assume that the packet delay and delay variation algorithms operate in discrete time.A typical ap-proach is to use three separate probe streams for monitoring these properties.However,since these algorithms operate in discrete time we may take advantage of the fact that they may send probes at the same time slot.We can accommodate such requests by tagging probes according to the estimator to which they apply.The effect is that a single probe packet may be used for multiple estimation objectives,thereby reducing overall impact of measurement traffic on the network.This is the intuition behind multi-objective probing.The basic architectureof our multi-objective probe sched-uler is depicted in Figure1.The central component of the architecture is a scheduler operating in discrete time thattimeFig.1.Multi-objective probe scheduler architecture.Algorithmic modules interact with a generic discrete-time probe scheduler to perform estimation of delay,delay variation,loss characteristics,or other properties of interest. provides callback and probe scheduling mechanisms.Indepen-dent probe modules interact with the scheduler to implement particular estimation algorithms, e.g.,B ADABING[7]Our probe scheduler design allows for logical separation among multiple,simultaneously operating measurement methods and for optimizations of network bandwidth.We implemented this architecture in a tool called SLA M(SLA M onitor).SLA M sends UDP packets in a one-way manner between a sender and receiver.The scheduler consists of about1,500lines of C++.Two important implementation decisions were made in the SLA M probe sender.First,the scheduler must accommodate estimation techniques that use multi-packet probes,such as B ADABING[7]which uses them to obtain an improved esti-mate of instantaneous congestion.Second,the scheduler must arbitrate among probe modules that may use different packet sizes.At present,the smallest packet size scheduled to be sent at a given time slot is used.For example,suppose three packets of size600bytes have been scheduled to be sent at time slot i for loss estimation and that one packet of size100bytes has also been scheduled for the same time slot i for delay estimation.When time slot i arrives,the scheduler will send a sequence of three packets of sizes100,600,and600bytes.Thefirst packet will tagged for delay estimation,and all three packets will be tagged for loss estimation.At the receiver(assuming these packets are not lost in transit),the delay estimator module will receive one packet of size100bytes,and the loss estimator module will receive three packets of sizes100,600,and600bytes. We discuss implications of these implementation decisions in Section V.IV.P ACKET L OSS R ATE M ONITORING M ETHODOLOGY We now describe the basic assumptions and method for estimating packet loss rate along an end-to-end path.Our objective is to develop an accurate,robust estimator based on a discrete-time probe process to be implemented as a module of SLA M.The methodology described in[7]was shown to yield accu-rate estimates of congestion event frequency( F)and duration ( D)along an end-to-end path.It was noted that the primary difficulty in estimating end-to-end packet loss rate(number of lost packets divided by total number of packets over agiven time interval)—the loss performance metric specified in SLAs—is that it is unclear how to measure demand along the path,particularly during congestion periods.Therefore,we propose the following heuristic approach.Starting from the geometric probe stream in[7],which initiates a probe pair at a given time slot with probability p loss, we measure the loss rate l of the probes during congestion episodes.Since the estimation techniques in[7]do not directlyidentify individual congestion episodes we take an empirical approach,treating consecutive probes in which at least one packet is lost as indication of a congestion episode.As in[7], we assume that the end-to-end loss rate L is stationary and ergodic.Given an estimate of the frequency of congestion F, we estimate the end-to-end loss rate asL= F l.The key assumption of this heuristic is that we treat the probe stream as a markerflow,namely,that the loss rate observed by thisflow has a meaningful relationship to other flows along the path.As a basis for this assumption,we note that the probes in[7]consist of multiple packets(3by default),which has some similarity to a TCP stream where delayed ACKs cause a sender to release two very closely-spaced packets.While we do not claim that the probe stream is,in general,the same as a TCP stream,our results below demonstrate that such an assumption may be reasonable in this context.Finally,we note that using previous work which analyzed the variance of the frequency estimator,we can similarly derive confidence intervals on this loss rate estimator(details omitted due to space constraints)[21].V.SLA M E VALUATIONWe now describe the experimental evaluation of SLA M in a controlled laboratory environment.In our experiments,we fixed the SLA M loss rate module with parameter p loss=0.3 and packet sizes of600bytes,unless otherwise specified. These settings were found to give good loss characteristic estimates[7].We verified the results regarding the setting of the parameter p loss but omit detailed results in this paper. A.Testbed and Traffic ScenariosOur laboratory testbed,depicted in Figure2,consisted of commodity workstation end hosts and commercial IP routing systems configured in a dumbbell-like topology.We used 10workstations on each side of the topology for producing background traffic and one workstation at each side to run SLA M.Each workstation has a Pentium4processor running at 2GHz or better,with at least1GB RAM and an Intel Pro/1000 network interface card and was configured to run either FreeBSD5.4or Linux2.6.The SLA M hosts were configured with a default installation of FreeBSD5.4.Background traffic and probe trafficflowed over separate paths through a Cisco 6500enterprise router(hop A)and was multiplexed onto a bottleneck OC3(155Mb/s)link at a Cisco GSR12000(hop B).Packets exited the OC3via another Cisco GSR12000hop identifier A B C Dboratory testbed.Probes and cross traffic are multiplexed onto a bottleneck OC3(155Mb/s)link.Synchronized Endace DAG monitors are used to collect traces for calculation of true loss and delay values.(hop C)and passed to receiving hosts via a Cisco6500(hop D).NetPath[22]is used between hops C and D to emulate propagation delays for the background traffic hosts in the testbed.We used a uniform distribution of delays with a mean of50msec,minimum of20msec,and maximum of80msec. The bottleneck output queue at the Cisco GSR at hop B was configured to perform tail drop with a maximum of624 packets of size1500bytes,or about50msec of buffer space at155Mb/s.The SLA M workstations were synchronized to a Stratum0NTP server configured with a TrueTime GPS card. We used the synchronization software developed by Corell et al.[23]to provide accurate timestamps for SLA M.All management traffic for the systems in Figure2flowed over a separate network(not pictured in thefigure).An important aspect of our testbed is the ability to establish a reliable“ground truth”for our experiments.Optical splitters were attached to the links between hops A and B and to the link between hops B and C and synchronized Endace DAG4.3 (Gigabit Ethernet)and3.8(OC3)passive monitoring cards were used to capture packet traces entering and leaving the bottleneck node.By comparing packet header information,we were able to identify which packets were lost at the congested output queue during experiments.We used four background traffic scenarios in our experi-ments.For thefirst scenario,we used Iperf[24]to produce constant-bit rate(CBR)UDP traffic for creating a series of approximately constant duration(about65msec)loss episodes that were spaced randomly at exponential intervals with mean of10seconds over a10minute period.The second scenario consisted of100long-lived TCP sources run over a10minute period.For thefinal two scenarios,we used Harpoon[25] with a heavy-tailedfile size distribution to create self-similar traffic approximating a mix of web-like and peer-to-peer traffic commonly seen in today’s networks.We used two different offered loads of60%and75%of the bottleneck OC3. Experiments using the self-similar traffic scenario were run for 15minutes.For all scenarios,we discarded thefirst30and last 30seconds of the traces.Note that the SLA M parameters used in our experiments result in only about0.3%of the bottleneck OC3consumed for measurement traffic.B.Multi-Objective Probing EvaluationWefirst evaluate the bandwidth savings that can arise due to multi-objective probing.As we noted in Section III,if multiple probe modules each wish to send a probe at a given time slot,the smallest packet size of each of the modules is used.An effect of this implementation decision is that the overall bandwidth requirement for the multi-objective stream may be less than the aggregate bandwidth requirement for individual probe modules,were they to be used separately.Assume that we wish monitor packet loss rate using the algorithm described in Section IV.Assume also that we wish to send afixed-rate periodic probe stream for monitoring,e.g., delay or delay variation.We set the probe packet sizes at600 bytes for the loss probe and100bytes for the periodic probe. We compare probe rates using two different parameter sets:in parameter set A,p loss is0.3and the periodic probe interval is 100milliseconds,and for parameter set B,p loss is0.2and the periodic probe interval is20milliseconds.Table I shows the results for these experiments.The table shows,for example, that for parameter set A,the the loss probe stream is separately about345Kb/s,and the delay probe stream is about40Kb/s: a sum of385Kb/s.With SLA M,the probe stream is about 297Kb/s,a savings of23%.While the savings is parameter dependent(as shown in the table),there are clearly obtainable bandwidth savings.TABLE IE XAMPLES OF AVERAGE BANDWIDTH REQUIREMENTS FOR INDIVIDUAL MEASUREMENT METHODS AND FOR MULTI-OBJECTIVE PROBE STREAM. T HE DISCRETIZATION TIME INTERVAL IS SET TO5MILLISECONDS,AND PROBE PACKET SIZES ARE CHOSEN TO BE600BYTES FOR THE LOSS PROBE AND100BYTES FOR A PERIODIC PROBE STREAM.F ORPARAMETER SET A,p loss IS SET TO0.2AND THE PERIODIC PROBE INTERVAL IS SET TO20MILLISECONDS.F OR PARAMETER SET B,p loss IS SET TO0.3AND THE PERIODIC PROBE INTERVAL IS SET TO100MILLISECONDS.A LL VALUES ARE IN K B/S.Parameter Loss Periodic Sum(separate SLA M Savingsset stream streams)A3454038529788(23%)B489849747423(5%)C.Loss Rate Estimation AccuracyWe now examine the accuracy of the loss rate estimates for SLA M,comparing SLA M’s accuracy with standard Poisson-modulated[20]and periodic streams of the same rate as the SLA M stream.Table II compares the true loss rate measured using the passive traces with the loss rate estimates of SLA M and the Poisson and periodic probe streams.Values are shown for each of the four traffic scenarios and are average loss rates over the duration of each experiment.Note that differences in true values are due to inherent variability in traffic sources. We see that for all four scenarios,the Poisson and periodic streams yield very poor estimates of the true loss rate.In all but one case,the estimates are off by more than two orders of magnitude—a significant relative error.In fact,the Poisson and periodic estimates are generally close to zero—a phenomenon consistent with earlier experiments[7]and primarily due to the fact that single packet probes generally yield poor indications of congestion along a path.(Note that these accuracy improvements are consistent with experiments described in[7].)The estimates produced by SLA M are significantly better,with a maximum relative error in the caseof the CBR background traffic.Both SLA M loss rate estimatesfor the self-similar background traffic have relative errors of about10%or less.TABLE IIC OMPARISON OF LOSS RATE ESTIMATION ACCURACY FOR SLA M,P OISSON,AND PERIODIC PROBE STREAMS.V ALUES ARE AVERAGE LOSS RATES OVER THE FULL EXPERIMENT DURATION.Probe stream→SLA M Poisson periodic Traffic scenario↓true estimate true estimate true estimate CBR0.00510.00730.00510.00170.00510.0017 Long-lived TCP0.01630.01890.01630.00620.01630.0050 Harpoon self-similar0.00080.00070.00170.00000.00180.0000 (60%load)Harpoon self-similar0.00490.00500.00550.00000.00600.0011 (75%load)D.Robustness of Loss EstimationEstimation accuracy over relatively long time periods(e.g.,10minutes)is clearly desirable from the standpoint of SLA compliance monitoring.Also important are the dynamic prop-erties of an active measurement estimator,i.e.,how well the method adapts to changing network conditions and how quickly the estimator converges to the average path state.In this section,we examine the time varying nature of the SLA M estimates for packet loss.Figure3shows the true loss rate and SLA M-estimated loss rate over the duration of experiments using long-lived TCP traffic(top)and self-similar traffic at60%offered load (bottom).As above,true loss rate estimates are shown for10 second intervals and estimates for SLA M are shown for30 second intervals.Results for CBR traffic are not shown but are consistent with plots in Figure3.The upper and lower bars for SLA M indicate estimates of one standard deviation above and below the mean using the variance estimates derived from[21].For the SLA M estimates we see the narrowing of variance bounds as an experiment progresses,and that the true loss rate is,with few exceptions,within these bounds.We also see that SLA M tracks the loss rate over time quite well,withits estimated mean closely following the true loss mean.VI.D ISCUSSION AND C ONCLUSIONSSLA monitoring is of significant interest to both customers and providers to ensure that the network is operating within acceptable bounds.This paper introduces a new frameworkfor multi-objective SLA compliance monitoring using active measurements and introduces a new method for measuring end-to-end packet loss rate.We implemented the probing framework and loss rate methodology in a tool called SLA M and evaluated the tool in a controlled laboratory setting.Our results demonstrate the bandwidth savings that can result dueto multi-objective probing.Our results also show that SLA M packet loss rate estimates are much more accurate than loss rate estimates obtained through standard periodic or Poisson probe streams,and that these standard techniques may notqqq qqq qq qq q qq q q qq qq q q qq q q q q q q q q q q q q q q q qq q q q q q q q q q q q q q q 1002003004005000.0000.0100.0200.030time (seconds)l o s s r a t e−−−−−−−−−−−−−−−−−−−−−−−−−−−−−−−−−−−−qtrue loss rate SLAm estimateqqqq q qqq q q q qq q q q q q q q q q q q qq q q q qq q q qq q q qqq q q q q q q q q qq q q qq qq q qq q q qq qq qq q qq qqq qq qq qq qqqq q02004006008000.0000.0050.0100.0150.020time (seconds)l o s s r a t e−−−−−−−−−−−−−−−−−−−−−−−−−−−−−−−−−−−−−−−−−−−−−−−−−−−−−−−−qtrue loss rate SLAm estimateparison of true loss rate with SLA M estimates over time.True loss rates are plotted using 10second intervals.SLA M estimates are plotted using 30second intervals.Plots shown for long-lived TCP (top)and self-similar traffic at 60%offered load (bottom)traffic scenarios.The upper and lower bars for SLA M indicate estimates of one standard deviation above and below the mean using the variance formulation of [21].provide an accurate estimate of the state of the network,thereby preventing an accurate assessment of SLA compliance.Furthermore,we illustrated the convergence and robustness properties of the loss rate estimates of SLA M which make it useful in an operational setting.We believe that SLA M represents a significant step toward accurate,low-impact SLA compliance monitoring using active measurements.However,there are a number of issues that this work does not address.First,there are several other end-to-end properties of interest for SLA compliance monitoring such as delay and delay variation.We intend to enhance SLA M to estimate these characteristics in the future.Second,our focus is on monitoring in the context of a single end-to-end path.In a typical operational settings,however,a network consisting of many links and paths must be monitored.In this context,a deployment strategy must be developed to coordinate probe streams so that links internal to the network are not carrying “too much”measurement traffic.A detailed analysis of this issue is a focus of future work.Next,our validation and calibration of SLA M is performed in a controlled laboratory environment.This setting incorporates many realistic aspects of live networks,including commercial IP routers,commodity workstations and a range of traffic conditions,and provides the critical ability to compare SLA M output with “ground truth”.Performance tests with SLA M in the live Internet are also a subject of future work.Another key question is the following:given a daily (or based on some other time scale)budget of probes that may be used to monitor compliance with a SLA,what are the considerations for optimizing the probe process?Should the probing period be over a relatively long time scale(e.g.,the entire interval of interest),thus potentially limitingthe accuracy of estimates,or should the probing period be over a shorter time scale,potentially improving estimation accuracy but at the cost of not probing over the entire interval,thus potentially missing important events?We intend to consider this issue in future work.R EFERENCES[1] A.Shaikh and A.Greenberg,“Operations and Management ofIP Networks:What Researchers Should Know.Tutorial Ses-sion,ACM SIGCOMM ’05./∼albert/sigcomm05-greenberg-shaikh-tute.pdf,August,2005.”[2]“Sprint NEXTEL service level agreements,”/business/support/serviceLevelAgreements.jsp,2006.[3]“AT&T Managed Internet Service (MIS),”http://new.serviceguide.att.com/mis.htm,2006.[4]“NTT Communications Global IP Network Service Level Agreement(SLA),”/products/sla/sla ts.cfm,2006.[5]M.Roughan,“Fundamental bounds on the accuracy of network perfor-mance measurements,”in ACM SIGMETRICS ,June 2005.[6]P.Barford and J.Sommers,“Comparing probe-and router-based packetloss measurements,”IEEE Internet Computing ,September/October 2004.[7]J.Sommers,P.Barford,N.Duffield,and A.Ron,“Improving accuracyin end-to-end packet loss measurement,”in Proceedings of ACM SIG-COMM ’05,2005.[8]J.Martin and A.Nilsson,“On service level agreements for IP networks,”in IEEE INFOCOM 2002,vol.2,2002.[9]L.Ciavattone,A.Morton,and G.Ramachandran,“Standardized activemeasurements on a tier 1IP backbone,”IEEE Communications ,vol.41,no.6,pp.90–97,June 2003.[10]T.Zseby,“Deployment of sampling methods for SLA validation withnon-intrusive measurements,”in Proceedings of Passive and Active Measurement Workshop ,2001.[11]M.Chan,Y .Lin,and X.Wang,“A scalable monitoring approach forservice level agreements validation,”in IEEE International Conference on Network Protocols (ICNP),2000,pp.37–48.[12]M.Aida,N.Miyoshi,and K.Ishibashi,“A scalable and lightweightQoS monitoring technique combining passive and active approaches,”in Proceedings of IEEE INFOCOM ’03,March 2003.[13]J.Bolot,“End-to-end packet delay and loss behavior in the Internet,”inProceedings of ACM SIGCOMM ’93,San Francisco,September 1993.[14] A.Pasztor and D.Veitch,“A precision infrastructure for active probing,”in Passive and Active Measurement Workshop ,2001.[15]Y .Zhang,N.Duffield,V .Paxson,and S.Shenker,“On the constancy ofInternet path properties,”in Proceedings of ACM SIGCOMM Internet Measurement Workshop ’01,San Francisco,November 2001.[16]M.Yajnik,S.Moon,J.Kurose,and D.Towsley,“Measurement andmodeling of temporal dependence in packet loss,”in Proceedings of IEEE INFOCOM ’99,New York,NY ,March 1999.[17]V .Paxson,“Measurements and analysis of end-to-end Internet dynam-ics,”Ph.D.dissertation,University of California Berkeley,1997.[18]Internet Protocol Performance Metrics,“/ippm/index.html,”2006.[19]V .Paxson,G.Almes,J.Mahdavi,and M.Mathis,“Framework for IPperformance metrics,”IETF RFC 2330,1998.[20]G.Almes,S.Kalidindi,and M.Zekauskas,“A one way packet lossmetric for IPPM,”IETF RFC 2680,September 1999.[21]J.Sommers,P.Barford,N.Duffield,and A.Ron,“A geometric ap-proach to improving active packet loss measurement,”December 2005,submitted to ACM/IEEE Transactions on Networking.[22]S.Agarwal,J.Sommers,and P.Barford,“Scalable network pathemulation,”in Proceedings of IEEE MASCOTS ’05,September 2005.[23] E.Corell,P.Saxholm,and D.Veitch,“A user friendly TSC clock,”in Proceedings of Passive and Active Measurement Conference ,March 2006.[24] A.Tirumala, F.Qin,J.Dugan,J.Ferguson,and K.Gibbs,“Iperf1.7.0–the TCP/UDP bandwidth measurement tool,”/Projects/Iperf,2006.[25]J.Sommers and P.Barford,“Self-configuring network traffic gen-eration,”in Proceedings of ACM SIGCOMM Internet Measurement Conference ’04,2004.。