教案 MATLAB同时绘制多个图像.
MATLAB绘图初步讲解实例教程

详细描述
MATLAB提供了交互式图形工具,如 `ginput`、`axes_crossing_info`等,使用户 能够与图形进行交互。通过这些工具,用户 可以获取图形的坐标值、筛选数据等操作, 从而更深入地分析数据。交互式图形在数据 探索和可视化方面具有很高的实用价值。
04
实例教程
绘制正弦函数和余弦函数
等,可以提高绘图效率和精度。
实践项目
02
通过实践项目来巩固和加深对MATLAB绘图的理解,例如数据
拟合、图像处理等。
参加在线课程和论坛
03
参加在线课程和论坛,与其他用户交流和学习,可以扩展视野
和知识面。
THANKS
感谢观看
mat制基本图形 • 图形进阶技巧 • 实例教程 • 总结与扩展
01
MATLAB绘图基础
绘图函数简介
bar()
绘制条形图,用于 展示分类数据或离 散数据。
hist()
绘制直方图,用于 展示数据的分布情 况。
plot()
绘制二维线图,是 MATLAB中最常用 的绘图函数。
05
总结与扩展
MATLAB绘图的优势与不足
强大的数据处理能力
MATLAB提供了丰富的数据处理函数,方便 用户进行数据分析和可视化。
丰富的图形样式
MATLAB支持多种图形样式,包括散点图、 线图、柱状图等,可以满足各种绘图需求。
MATLAB绘图的优势与不足
• 交互式绘图:MATLAB支持交互式绘图,用户可以通过鼠 标操作对图形进行缩放、旋转等操作。
```
绘制饼状图
在此添加您的文本17字
总结词:饼状图用于展示各类别数据在总数据中所占的比 例。
在此添加您的文本16字
实验2 Matlab绘图操作
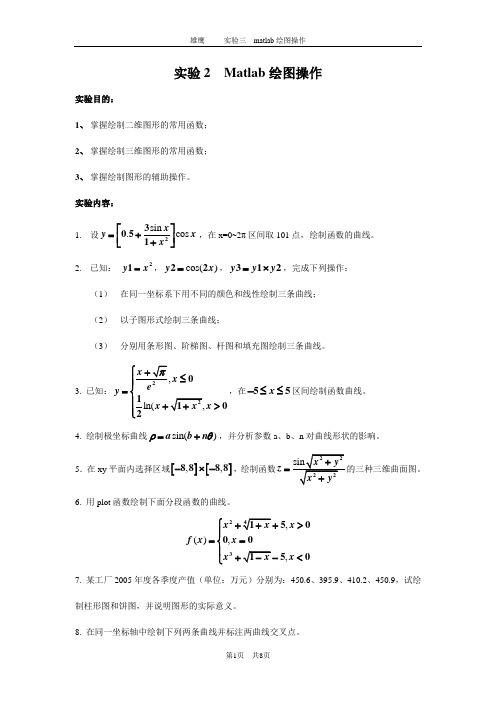
实验2 Matlab 绘图操作实验目的:1、 掌握绘制二维图形的常用函数;2、 掌握绘制三维图形的常用函数;3、 掌握绘制图形的辅助操作。
实验内容:1. 设sin .cos x y x x ⎡⎤=+⎢⎥+⎣⎦23051,在x=0~2π区间取101点,绘制函数的曲线。
2. 已知: y x =21,cos()y x =22,y y y =⨯312,完成下列操作:(1) 在同一坐标系下用不同的颜色和线性绘制三条曲线; (2) 以子图形式绘制三条曲线;(3) 分别用条形图、阶梯图、杆图和填充图绘制三条曲线。
3.已知:ln(x x e y x x ⎧+≤⎪⎪=⎨⎪+>⎪⎩20102,在x -≤≤55区间绘制函数曲线。
4. 绘制极坐标曲线sin()a b n ρθ=+,并分析参数a 、b 、n 对曲线形状的影响。
5.在xy 平面内选择区域[][],,-⨯-8888,绘制函数z =6. 用plot 函数绘制下面分段函数的曲线。
,(),,x x f x x x x ⎧++>⎪==⎨⎪+<⎩235000507. 某工厂2005年度各季度产值(单位:万元)分别为:450.6、395.9、410.2、450.9,试绘制柱形图和饼图,并说明图形的实际意义。
8. 在同一坐标轴中绘制下列两条曲线并标注两曲线交叉点。
(1).y x =-205(2)sin()cos ,sin()sin x t tt y t tπ=⎧≤≤⎨=⎩303详细实验内容:1.设sin .cos x y x x ⎡⎤=+⎢⎥+⎣⎦23051,在x=0~2π区间取101点,绘制函数的曲线。
>> x=(0:2*pi/100:2*pi);>> y=(0.5+3*sin(x)/(1+x.^2))*cos(x); >> plot(x,y)2.已知: y x =21,cos()y x =22,y y y =⨯312,完成下列操作: (1)在同一坐标系下用不同的颜色和线性绘制三条曲线; >> x= linspace(0, 2*pi, 101);>> y1=x.*x; >> y2=cos(2x); >> y3=y1.*y2;plot(x,y1,'r:',x,y2,'b',x,y3, 'ko')(2)以子图形式绘制三条曲线;>> subplot(2,2,1),plot(x,y1)subplot(2,2,2),plot(x,y2)subplot(2,2,3),plot(x,y3)(3)分别用条形图、阶梯图、杆图和填充图绘制三条曲线。
用plot命令和figure命令绘制多个图像

感觉好的软件越学越觉得强大,Matlab 的绘图就是如此,仅一个plot就实现很多的功能。
可以根据自己的需要加一些命令调整图像。
程序源代码%1 add labels and title to the figurefigurex = -pi:.1:pi;y = sin(x);p = plot(x,y)set(gca,'XTick',-pi:pi/2:pi)set(gca,'XTickLabel',{'-pi','-pi/2','0','pi/2','pi'})xlabel('-\pi \leq \Theta \leq \pi')ylabel('sin(\Theta)')title('Plot of sin(\Theta)')% \Theta appears as a Greek symbol (see String)% Annotate the point (-pi/4, sin(-pi/4))text(-pi/4,sin(-pi/4),'\leftarrow sin(-\pi\div4)',...'HorizontalAlignment','left')% Change the line color to red and% set the line width to 2 pointsset(p,'Color','red','LineWidth',2)%2 use different colors to draw the linefiguret = 0:pi/100:2*pi;y = sin(t);y2 = sin(t-0.25);y3 = sin(t-0.5);plot(t,y,'-',t,y2,'--',t,y3,':')%3 use the grid on and hold offfiguresemilogx(1:100,'+')hold all % hold plot and cycle line colorsplot(1:3:300,1:100,'--')hold offgrid on % Turn on grid lines for this plot这是来自help文件的example,它很好的运用了plot的一些功能,看一下相关的解释可以更好的运用plot命令的。
matlab生成多张figure以及自动保存

MATLAB生成多张figure以及自动保存最近开始做毕业论文了。
在整理以前做过的诸多论文实验的时候,发现以前用MATLAB写出来的代码是在太混乱了。
算法程序,数据生成,以及图片绘画的.m文件都放在一个目录下。
不要说拿给别人看,就连我自己时间久了都搞不清楚哪种图片是哪个MATLAB程序生成的。
MATLAB没有Visual C++, Java那正规软件开发环境的工程概念,所以人工管理比较麻烦。
一般外人拿到一个论文的实验程序,最简单的,就是拿到一个入口程序,能够自动跑所有的实验程序,并且生成所有的实验图片。
这样,他就至少可以从这个入口程序一步一步跟踪进去,搞明白这一堆.m是什么东西。
那么有个关键问题,如何在一个程序里面生成多个figure呢?查了一下网上,有通过subplot方法实现的。
不过这个方法似乎不太好,因为它其实是将多个figure嵌到一个figure 里面,那么最终还是得一个个分开才能贴到论文里面。
下面是我论文里面的一个例子:function figure_wages()h=figure(1);figure_SLICE();saveas(h,'figure_wages_SLICE.fig');h=figure(2);figure_CARE();saveas(h,'figure_wages_CARE.fig');end这里我用过两个算法在同一块数据上进行训练,最后结果就生成下图两个figure了。
并且调用saveas函数可以实现自动把这两个figure保存到磁盘的.fig文件。
这里的h=figure(1)目的就是制定当前的默认显示的Figure的ID号,并且返回给句柄h。
PS:这里使用的数据都是真实的个人收入数据,其中另外2个维度分别是学历和工作经历。
大家看得出来,这些是在一个平面上的吗?分享到:4楼dragonworrior 2011-04-07 10:05发表[回复]3楼andysun001 2010-03-10 13:56发表[回复]2楼baltam 2009-11-12 21:58发表[回复]其实,如果你是想产生图片,并插入到论文中。
MatLab图形绘制功能(精编文档).doc
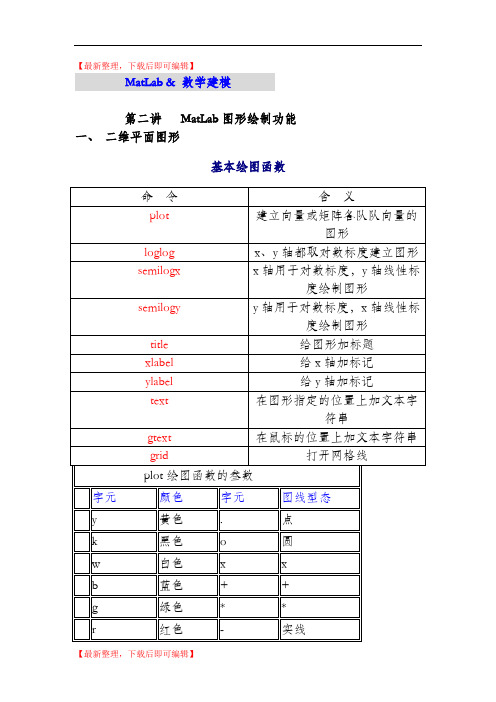
【最新整理,下载后即可编辑】MatLab & 数学建模第二讲MatLab图形绘制功能一、二维平面图形基本绘图函数c 亮青色: 点线m 锰紫色-. 点虚线-- 虚线hold on 命令用于在已画好的图形上添加新的图形plot是绘制一维曲线的基本函数,但在使用此函数之前,我们需先定义曲线上每一点的x及y座标。
下例可画出一条正弦曲线:x=0:0.001:10; % 0到10的1000个点的x座标y=sin(x); % 对应的y座标plot(x,y); % 绘图Y=sin(10*x);plot(x,y,'r:',x,Y,'b') % 同时画两个函数•若要改变颜色,在座标对後面加上相关字串即可:x=0:0.01:10;plot(x,sin(x),'r')若要同时改变颜色及图线型态(Line style),也是在坐标对後面加上相关字串即可:plot(x,sin(x),'r*')用axis([xmin,xmax,ymin,ymax])函数来调整图轴的范围axis([0,6,-1.5,1])MATLAB也可对图形加上各种注解与处理:xlabel('x轴'); % x轴注解ylabel('y轴'); % y轴注解title('余弦函数'); % 图形标题legend('y = cos(x)'); % 图形注解gtext('y = cos(x)'); % 图形注解,用鼠标定位注解位置grid on; % 显示格线fplot的指令可以用来自动的画一个已定义的函数分布图,而无须产生绘图所须要的一组数据做为变数。
其语法为fplot('fun',[xmin xmax ymin ymax]),其中fun为一已定义的函数名称,例如sin, cos 等等;而xmin, xmax, ymin, ymax则是设定绘图横轴及纵轴的下限及上限。
Matlab绘图教程
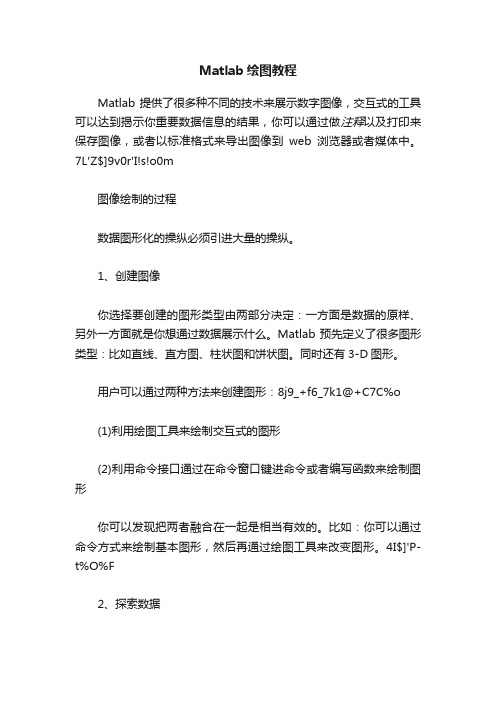
Matlab绘图教程Matlab提供了很多种不同的技术来展示数字图像,交互式的工具可以达到揭示你重要数据信息的结果,你可以通过做注释以及打印来保存图像,或者以标准格式来导出图像到web浏览器或者媒体中。
7L'Z$]9v0r'I!s!o0m图像绘制的过程数据图形化的操纵必须引进大量的操纵。
1、创建图像你选择要创建的图形类型由两部分决定:一方面是数据的原样、另外一方面就是你想通过数据展示什么。
Matlab预先定义了很多图形类型:比如直线、直方图、柱状图和饼状图。
同时还有3-D图形。
用户可以通过两种方法来创建图形:8j9_+f6_7k1@+C7C%o(1)利用绘图工具来绘制交互式的图形(2)利用命令接口通过在命令窗口键进命令或者编写函数来绘制图形你可以发现把两者融合在一起是相当有效的。
比如:你可以通过命令方式来绘制基本图形,然后再通过绘图工具来改变图形。
4I$]'P-t%O%F2、探索数据一旦你创建了一个图形,你就可以从图形中提取指定的信息,比如一个图形的最高点的数据量、一组数据的均匀值等等。
3、编辑图形控件图形由各种对象组成,用户可以修改它的的部分属性,这些属性影响了部分组件的显示和行为。
!s1T0}(L+w2~:~+w比如一个被定义为图形相关系统的轴有以下几种属性:轴的定义域、颜色、标准等。
一条直线有以下属性:颜色等。
-N$c;?"U9H6f4、图形注释%u9t:Z$p#q2h4@%q注释是通过把文本、箭头符号、图像标号以及标签添加到图形中来使得用户了解图形的重要信息。
当你想表现出给其他用户看或者想保存图像为以后引用,那么你就可以代表性的添加注释。
"x*c7F)R0@5、打印和导出图形你可以在任意的连接在计算机上的打印机上打印图形。
导出图形意味着你创建了一标准格式存储的样本,比如:TIF\JPEG\EPS\然后你在以后的文档处理过程中、或者在HTML文档中导进这些图形。
给大家一个非常好用的matlab程序(一个figure中画多幅图,colormap如何设置)
给⼤家⼀个⾮常好⽤的matlab程序(⼀个figure中画多幅图,colormap如何设置)function freezeColors(varargin)% freezeColors Lock colors of plot, enabling multiple colormaps per figure. (v2.3)%% Problem: There is only one colormap per figure. This function provides% an easy solution when plots using different colomaps are desired% in the same figure.%% freezeColors freezes the colors of graphics objects in the current axis so% that subsequent changes to the colormap (or caxis) will not change the% colors of these objects. freezeColors works on any graphics object% with CData in indexed-color mode: surfaces, images, scattergroups,% bargroups, patches, etc. It works by converting CData to true-color rgb% based on the colormap active at the time freezeColors is called.%% The original indexed color data is saved, and can be restored using% unfreezeColors, making the plot once again subject to the colormap and% caxis.%%% Usage:% freezeColors applies to all objects in current axis (gca),% freezeColors(axh) same, but works on axis axh.%% Example:% subplot(2,1,1); imagesc(X); colormap hot; freezeColors% subplot(2,1,2); imagesc(Y); colormap hsv; freezeColors etc...%% Note: colorbars must also be frozen. Due to Matlab 'improvements' this can% no longer be done with freezeColors. Instead, please% use the function CBFREEZE by Carlos Adrian Vargas Aguilera% that can be downloaded from the MATLAB File Exchange% (/matlabcentral/fileexchange/24371)%% h=colorbar; cbfreeze(h), or simply cbfreeze(colorbar)%% For additional examples, see test/test_main.m%% Side effect on render mode: freezeColors does not work with the painters% renderer, because Matlab doesn't support rgb color data in% painters mode. If the current renderer is painters, freezeColors% changes it to zbuffer. This may have unexpected effects on other aspects% of your plots.%% See also unfreezeColors, freezeColors_pub.html, cbfreeze.%%% John Iversen (iversen@) 3/23/05%% Changes:% JRI (iversen@) 4/19/06 Correctly handles scaled integer cdata% JRI 9/1/06 should now handle all objects with cdata: images, surfaces,% scatterplots. (v 2.1)% JRI 11/11/06 Preserves NaN colors. Hidden option (v 2.2, not uploaded)% JRI 3/17/07 Preserve caxis after freezing--maintains colorbar scale (v 2.3)% JRI 4/12/07 Check for painters mode as Matlab doesn't support rgb in it.% JRI 4/9/08 Fix preserving caxis for objects within hggroups (e.g. contourf)% JRI 4/7/10 Change documentation for colorbars% Hidden option for NaN colors:% Missing data are often represented by NaN in the indexed color% data, which renders transparently. This transparency will be preserved% when freezing colors. If instead you wish such gaps to be filled with% a real color, add 'nancolor',[r g b] to the end of the arguments. E.g.% freezeColors('nancolor',[r g b]) or freezeColors(axh,'nancolor',[r g b]),% where [r g b] is a color vector. This works on images & pcolor, but not on% surfaces.% Thanks to Fabiano Busdraghi and Jody Klymak for the suggestions. Bugfixes% attributed in the code.% Free for all uses, but please retain the following:% Original Author:% John Iversen, 2005-10% john_iversen@appdatacode = 'JRI__freezeColorsData';[h, nancolor] = checkArgs(varargin);%gather all children with scaled or indexed CDatacdatah = getCDataHandles(h);%current colormapcmap = colormap;nColors = size(cmap,1);cax = caxis;% convert object color indexes into colormap to true-color data using% current colormapfor hh = cdatah',g = get(hh);%preserve parent axis climparentAx = getParentAxes(hh);originalClim = get(parentAx, 'clim');% Note: Special handling of patches: For some reason, setting% cdata on patches created by bar() yields an error,% so instead we'll set facevertexcdata instead for patches.if ~strcmp(g.Type,'patch'),cdata = g.CData;elsecdata = g.FaceVertexCData;end%get cdata mapping (most objects (except scattergroup) have it)if isfield(g,'CDataMapping'),scalemode = g.CDataMapping;elsescalemode = 'scaled';end%save original indexed data for use with unfreezeColorssiz = size(cdata);setappdata(hh, appdatacode, {cdata scalemode});%convert cdata to indexes into colormapif strcmp(scalemode,'scaled'),%4/19/06 JRI, Accommodate scaled display of integer cdata:% in MATLAB, uint * double = uint, so must coerce cdata to double % Thanks to O Yamashita for pointing this need outidx = ceil( (double(cdata) - cax(1)) / (cax(2)-cax(1)) * nColors);else %direct mappingidx = cdata;/8/09 in case direct data is non-int (e.g. image;freezeColors)% (Floor mimics how matlab converts data into colormap index.)% Thanks to D Armyr for the catchidx = floor(idx);end%clamp to [1, nColors]idx(idx<1) = 1;idx(idx>nColors) = nColors;%handle nans in idxnanmask = isnan(idx);idx(nanmask)=1; %temporarily replace w/ a valid colormap index%make true-color data--using current colormaprealcolor = zeros(siz);for i = 1:3,c = cmap(idx,i);c = reshape(c,siz);c(nanmask) = nancolor(i); %restore Nan (or nancolor if specified)realcolor(:,:,i) = c;end%apply new true-color color data%true-color is not supported in painters renderer, so switch out of that if strcmp(get(gcf,'renderer'), 'painters'),set(gcf,'renderer','zbuffer');end%replace original CData with true-color dataif ~strcmp(g.Type,'patch'),set(hh,'CData',realcolor);elseset(hh,'faceVertexCData',permute(realcolor,[1 3 2]))end%restore clim (so colorbar will show correct limits)if ~isempty(parentAx),set(parentAx,'clim',originalClim)endend %loop on indexed-color objects% ============================================================================ %% Local functions%%%%%%%%%%%%%%%%%%%%%%%%%%%%%%%%%%%%%%%%%%%%%%%%%%%%%%%%%%%%%%%%%%%%%%%%%%%%%%%% %% getCDataHandles -- get handles of all descendents with indexed CData %%%%%%%%%%%%%%%%%%%%%%%%%%%%%%%%%%%%%%%%%%%%%%%%%%%%%%%%%%%%%%%%%%%%%%%%%%%%%%%%function hout = getCDataHandles(h)% getCDataHandles Find all objects with indexed CData%recursively descend object tree, finding objects with indexed CData% An exception: don't include children of objects that themselves have CData:% for example, scattergroups are non-standard hggroups, with CData. Changing% such a group's CData automatically changes the CData of its children,% (as well as the children's handles), so there's no need to act on them.error(nargchk(1,1,nargin,'struct'))hout = [];if isempty(h),return;endch = get(h,'children');for hh = ch'g = get(hh);if isfield(g,'CData'), %does object have CData?%is it indexed/scaled?if ~isempty(g.CData) && isnumeric(g.CData) && size(g.CData,3)==1,hout = [hout; hh]; %#ok<AGROW> %yes, add to listendelse %no CData, see if object has any interesting childrenhout = [hout; getCDataHandles(hh)]; %#ok<AGROW>endend%%%%%%%%%%%%%%%%%%%%%%%%%%%%%%%%%%%%%%%%%%%%%%%%%%%%%%%%%%%%%%%%%%%%%%%%%%%%%%%% %% getParentAxes -- return handle of axes object to which a given object belongs %%%%%%%%%%%%%%%%%%%%%%%%%%%%%%%%%%%%%%%%%%%%%%%%%%%%%%%%%%%%%%%%%%%%%%%%%%%%%%%% function hAx = getParentAxes(h)% getParentAxes Return enclosing axes of a given object (could be self)error(nargchk(1,1,nargin,'struct'))%object itself may be an axisif strcmp(get(h,'type'),'axes'),hAx = h;returnendparent = get(h,'parent');if (strcmp(get(parent,'type'), 'axes')),hAx = parent;elsehAx = getParentAxes(parent);end %%%%%%%%%%%%%%%%%%%%%%%%%%%%%%%%%%%%%%%%%%%%%%%%%%%%%%%%%%%%%%%%%%%%%%%%%%%%%%%% %% checkArgs -- Validate input arguments %%%%%%%%%%%%%%%%%%%%%%%%%%%%%%%%%%%%%%%%%%%%%%%%%%%%%%%%%%%%%%%%%%%%%%%%%%%%%%%% function [h, nancolor] = checkArgs(args)% checkArgs Validate input arguments to freezeColorsnargs = length(args);error(nargchk(0,3,nargs,'struct'))%grab handle from first argument if we have an odd number of argumentsif mod(nargs,2),h = args{1};if ~ishandle(h),error('JRI:freezeColors:checkArgs:invalidHandle',...'The first argument must be a valid graphics handle (to an axis)')end% 4/2010 check if object to be frozen is a colorbarif strcmp(get(h,'Tag'),'Colorbar'),if ~exist('cbfreeze.m'),warning('JRI:freezeColors:checkArgs:cannotFreezeColorbar',...['You seem to be attempting to freeze a colorbar. This no longer'...'works. Please read the help for freezeColors for the solution.'])elsecbfreeze(h);returnendendargs{1} = [];nargs = nargs-1;elseh = gca;end%set nancolor if that option was specifiednancolor = [nan nan nan];if nargs == 2,if strcmpi(args{end-1},'nancolor'),nancolor = args{end};if ~all(size(nancolor)==[1 3]),error('JRI:freezeColors:checkArgs:badColorArgument',...'nancolor must be [r g b] vector');endnancolor(nancolor>1) = 1; nancolor(nancolor<0) = 0;elseerror('JRI:freezeColors:checkArgs:unrecognizedOption',...'Unrecognized option (%s). Only ''nancolor'' is valid.',args{end-1})endendfunction CBH = cbfreeze(varargin)�FREEZE Freezes the colormap of a colorbar.%% SYNTAX:% cbfreeze% cbfreeze('off')% cbfreeze(H,...)% CBH = cbfreeze(...);%% INPUT:% H - Handles of colorbars to be freezed, or from figures to search% for them or from peer axes (see COLORBAR).% DEFAULT: gcf (freezes all colorbars from the current figure)% 'off' - Unfreezes the colorbars, other options are:% 'on' Freezes% 'un' same as 'off'% 'del' Deletes the colormap(s).% DEFAULT: 'on' (of course)%% OUTPUT (all optional):% CBH - Color bar handle(s).%% DESCRIPTION:% MATLAB works with a unique COLORMAP by figure which is a big% limitation. Function FREEZECOLORS by John Iversen allows to use % different COLORMAPs in a single figure, but it fails freezing the% COLORBAR. This program handles this problem.%% NOTE:% * Optional inputs use its DEFAULT value when not given or [].% * Optional outputs may or not be called.% * If no colorbar is found, one is created.% * The new frozen colorbar is an axes object and does not behaves% as normally colorbars when resizing the peer axes. Although, some % time the normal behavior is not that good.% * Besides, it does not have the 'Location' property anymore.% * But, it does acts normally: no ZOOM, no PAN, no ROTATE3D and no% mouse selectable.% * No need to say that CAXIS and COLORMAP must be defined before using% this function. Besides, the colorbar location. Anyway, 'off' or% 'del' may help.% * The 'del' functionality may be used whether or not the colorbar(s)% is(are) froozen. The peer axes are resized back. Try:% >> colorbar, cbfreeze del%% EXAMPLE:% surf(peaks(30))% colormap jet% cbfreeze% colormap gray% title('What...?')%% SEE ALSO:% COLORMAP, COLORBAR, CAXIS% and% FREEZECOLORS by John Iversen% at /matlabcentral/fileexchange%%% ---% MFILE: cbfreeze.m% VERSION: 1.1 (Sep 02, 2009) (<a href="matlab:web('/matlabcentral/fileexchange/authors/11258')">download</a>) % MATLAB: 7.7.0.471 (R2008b)% AUTHOR: Carlos Adrian Vargas Aguilera (MEXICO)% CONTACT: nubeobscura@% REVISIONS:% 1.0 Released. (Jun 08, 2009)% 1.1 Fixed BUG with image handle on MATLAB R2009a. Thanks to Sergio% Muniz. (Sep 02, 2009)% DISCLAIMER:% cbfreeze.m is provided "as is" without warranty of any kind, under the% revised BSD license.% Copyright (c) 2009 Carlos Adrian Vargas Aguilera% INPUTS CHECK-IN% -------------------------------------------------------------------------% Parameters:cbappname = 'Frozen'; % Colorbar application data with fields:% 'Location' from colorbar% 'Position' from peer axes befor colorbar% 'pax' handle from peer axes.axappname = 'FrozenColorbar'; % Peer axes application data with frozen% colorbar handle.% Set defaults:S = 'on'; Sopt = {'on','un','off','del'};H = get(0,'CurrentFig');% Check inputs:if nargin==2 && (~isempty(varargin{1}) && all(ishandle(varargin{1})) && ...isempty(varargin{2}))% Check for CallBacks functionalities:% ------------------------------------varargin{1} = double(varargin{1});if strcmp(get(varargin{1},'BeingDelete'),'on')% Working as DeletFcn:if (ishandle(get(varargin{1},'Parent')) && ...~strcmpi(get(get(varargin{1},'Parent'),'BeingDeleted'),'on'))% The handle input is being deleted so do the colorbar:S = 'del';if ~isempty(getappdata(varargin{1},cbappname))% The frozen colorbar is being deleted:H = varargin{1};else% The peer axes is being deleted:H = ancestor(varargin{1},{'figure','uipanel'});endelse% The figure is getting close:returnendelseif (gca==varargin{1} && ...gcf==ancestor(varargin{1},{'figure','uipanel'}))% Working as ButtonDownFcn:cbfreezedata = getappdata(varargin{1},cbappname);if ~isempty(cbfreezedata)if ishandle(cbfreezedata.ax)% Turns the peer axes as current (ignores mouse click-over):set(gcf,'CurrentAxes',cbfreezedata.ax);returnendelse% Clears application data:rmappdata(varargin{1},cbappname)endH = varargin{1};endelse% Checks for normal calling:% --------------------------% Looks for H:if nargin && ~isempty(varargin{1}) && all(ishandle(varargin{1}))H = varargin{1};varargin(1) = [];end% Looks for S:if ~isempty(varargin) && (isempty(varargin{1}) || ischar(varargin{1}))S = varargin{1};endend% Checks S:if isempty(S)S = 'on';endS = lower(S);iS = strmatch(S,Sopt);if isempty(iS)error('CVARGAS:cbfreeze:IncorrectStringOption',...['Unrecognized ''' S ''' argument.' ])elseS = Sopt{iS};end% Looks for CBH:CBH = cbfreeze(H); �H = cbhandle(H);if ~strcmp(S,'del') && isempty(CBH)% Creates a colorbar and peer axes:pax = gca;CBH = colorbar('peer',pax);elsepax = [];end% -------------------------------------------------------------------------% MAIN% -------------------------------------------------------------------------% Note: only CBH and S are necesary, but I use pax to avoid the use of the % "hidden" 'Axes' COLORBAR's property. Why... �% Saves current position:fig = get( 0,'CurrentFigure');cax = get(fig,'CurrentAxes');% Works on every colorbar:for icb = 1:length(CBH)% Colorbar axes handle:h = double(CBH(icb));% This application data:cbfreezedata = getappdata(h,cbappname);% Gets peer axes:if ~isempty(cbfreezedata)pax = cbfreezedata.pax;if ~ishandle(pax) % just in casermappdata(h,cbappname)continueendelseif isempty(pax) % not generatedtrypax = double(get(h,'Axes')); % NEW feature in COLORBARs catchcontinueendend% Choose functionality:switch Scase 'del'% Deletes:if ~isempty(cbfreezedata)% Returns axes to previous size:oldunits = get(pax,'Units');set(pax,'Units','Normalized');set(pax,'Position',cbfreezedata.Position)set(pax,'Units',oldunits)set(pax,'DeleteFcn','')if isappdata(pax,axappname)rmappdata(pax,axappname)endendif strcmp(get(h,'BeingDelete'),'off')delete(h)endcase {'un','off'}% Unfrozes:if ~isempty(cbfreezedata)delete(h);set(pax,'DeleteFcn','')if isappdata(pax,axappname)rmappdata(pax,axappname)endoldunits = get(pax,'Units');set(pax,'Units','Normalized')set(pax,'Position',cbfreezedata.Position)set(pax,'Units',oldunits)CBH(icb) = colorbar(...'peer' ,pax,...'Location',cbfreezedata.Location);endotherwise % 'on'% Freezes:% Gets colorbar axes properties:cb_prop = get(h);% Gets colorbar image handle. Fixed BUG, Sep 2009hi = findobj(h,'Type','image');% Gets image data and transform it in a RGB:CData = get(hi,'CData');if size(CData,3)~=1% It's already frozen:continueend% Gets image tag:Tag = get(hi,'Tag');% Deletes previous colorbar preserving peer axes position: oldunits = get(pax,'Units');set(pax,'Units','Normalized')Position = get(pax,'Position');delete(h)cbfreezedata.Position = get(pax,'Position');set(pax,'Position',Position)set(pax,'Units',oldunits)% Generates new colorbar axes:% NOTE: this is needed because each time COLORMAP or CAXIS is used, % MATLAB generates a new COLORBAR! This eliminates that behaviour % and is the central point on this function.h = axes(...'Parent' ,cb_prop.Parent,...'Units' ,'Normalized',...'Position',cb_prop.Position...);% Save location for future call:cbfreezedata.Location = cb_prop.Location;% Move ticks because IMAGE draws centered pixels:XLim = cb_prop.XLim;YLim = cb_prop.YLim;if isempty(cb_prop.XTick)% Vertical:X = XLim(1) + diff(XLim)/2;Y = YLim + diff(YLim)/(2*length(CData))*[+1 -1];else % isempty(YTick)% Horizontal:Y = YLim(1) + diff(YLim)/2;X = XLim + diff(XLim)/(2*length(CData))*[+1 -1];end% Draws a new RGB image:image(X,Y,ind2rgb(CData,colormap),...'Parent' ,h,...'HitTest' ,'off',...'Interruptible' ,'off',...'SelectionHighlight','off',...'Tag' ,Tag...)% Removes all '...Mode' properties:cb_fields = fieldnames(cb_prop);indmode = strfind(cb_fields,'Mode');for k=1:length(indmode)if ~isempty(indmode{k})cb_prop = rmfield(cb_prop,cb_fields{k});endend% Removes special COLORBARs properties:cb_prop = rmfield(cb_prop,{...'CurrentPoint','TightInset','BeingDeleted','Type',... % read-only'Title','XLabel','YLabel','ZLabel','Parent','Children',... % handles'UIContextMenu','Location',... % colorbars'ButtonDownFcn','DeleteFcn',... % callbacks'CameraPosition','CameraTarget','CameraUpVector','CameraViewAngle',... 'PlotBoxAspectRatio','DataAspectRatio','Position',...'XLim','YLim','ZLim'});% And now, set new axes properties almost equal to the unfrozen% colorbar:set(h,cb_prop)% CallBack features:set(h,...'ActivePositionProperty','position',...'ButtonDownFcn' ,@cbfreeze,... % mhh...'DeleteFcn' ,@cbfreeze) % againset(pax,'DeleteFcn' ,@cbfreeze) % and again!% Do not zoom or pan or rotate:setAllowAxesZoom (zoom ,h,false)setAllowAxesPan (pan ,h,false)setAllowAxesRotate(rotate3d,h,false)% Updates data:CBH(icb) = h;% Saves data for future undo:cbfreezedata.pax = pax;setappdata( h,cbappname,cbfreezedata);setappdata(pax,axappname,h);end % switch functionalityend % MAIN loop% OUTPUTS CHECK-OUT% -------------------------------------------------------------------------% Output?:if ~nargoutclear CBHelseCBH(~ishandle(CBH)) = [];end% Returns current axes:if ishandle(cax)set(fig,'CurrentAxes',cax)end% [EOF] cbfreeze.m⼤家只要把这个.m⽂件matlab⼯作⽂件夹中即可,此函数⽤来在⼀个figure上作出多个⽴体图形。
数学建模MATLAB教案

数学建模MATLAB教案第一章:MATLAB简介1.1 课程目标了解MATLAB的发展历程和应用领域熟悉MATLAB的工作环境掌握MATLAB的基本命令和操作1.2 教学内容MATLAB的历史和发展MATLAB的应用领域MATLAB的工作环境MATLAB的基本命令和操作1.3 教学方法讲解和示范相结合学生上机实践1.4 教学资源MATLAB软件PPT课件1.5 教学评估课后作业上机实践第二章:MATLAB基本操作2.1 课程目标掌握MATLAB的变量和数据类型熟悉MATLAB的运算符和表达式学会在MATLAB中进行矩阵操作2.2 教学内容MATLAB的变量和数据类型MATLAB的运算符和表达式矩阵的创建和操作矩阵的运算2.3 教学方法讲解和示范相结合学生上机实践2.4 教学资源MATLAB软件PPT课件2.5 教学评估课后作业上机实践第三章:MATLAB函数3.1 课程目标了解MATLAB内置函数的分类和用法学会自定义函数掌握MATLAB脚本文件的编写和运行MATLAB内置函数的分类和用法自定义函数的创建和调用MATLAB脚本文件的编写和运行3.3 教学方法讲解和示范相结合学生上机实践3.4 教学资源MATLAB软件PPT课件3.5 教学评估课后作业上机实践第四章:MATLAB绘图4.1 课程目标熟悉MATLAB绘图的基本命令掌握MATLAB绘图的格式和技巧学会使用MATLAB绘制各种图形4.2 教学内容MATLAB绘图的基本命令MATLAB绘图的格式和技巧绘制各种图形的函数和方法讲解和示范相结合学生上机实践4.4 教学资源MATLAB软件PPT课件4.5 教学评估课后作业上机实践第五章:数学建模基本方法5.1 课程目标了解数学建模的基本概念和方法学会使用MATLAB进行数学建模掌握数学建模的常用算法和技巧5.2 教学内容数学建模的基本概念和方法使用MATLAB进行数学建模的步骤和技巧数学建模的常用算法和实例5.3 教学方法讲解和示范相结合学生上机实践5.4 教学资源MATLAB软件PPT课件5.5 教学评估课后作业上机实践第六章:线性方程组求解6.1 课程目标理解线性方程组的数学理论学会使用MATLAB解线性方程组掌握MATLAB中求解线性方程组的多种方法6.2 教学内容线性方程组的数学描述MATLAB中的线性方程组求解函数(如`解方程组`函数)稀疏矩阵在线性方程组求解中的应用使用`linsolve`函数求解线性方程组使用`guess`函数进行参数估计6.3 教学方法理论讲解与实际操作相结合示例演示学生上机练习6.4 教学资源MATLAB软件线性方程组求解实例6.5 教学评估课后练习题上机练习第七章:最优化问题求解7.1 课程目标理解最优化问题的数学模型学会使用MATLAB解决最优化问题掌握最优化问题的常见求解算法7.2 教学内容最优化问题的数学基础MATLAB中的最优化工具箱概述使用`fmincon`函数求解约束最优化问题使用`fminunc`函数求解无约束最优化问题了解其他最优化函数和算法7.3 教学方法理论讲解与实际操作相结合示例演示学生上机练习7.4 教学资源MATLAB软件最优化问题求解实例7.5 教学评估课后练习题上机练习第八章:微分方程求解8.1 课程目标理解微分方程的基本概念学会使用MATLAB求解微分方程掌握MATLAB中微分方程求解工具的使用8.2 教学内容微分方程的分类和基本概念MATLAB中的微分方程求解函数(如`ode45`)边界值问题的求解(如`bvp4c`)参数估计和敏感性分析8.3 教学方法理论讲解与实际操作相结合示例演示学生上机练习8.4 教学资源MATLAB软件PPT课件微分方程求解实例8.5 教学评估课后练习题上机练习第九章:概率论与数理统计9.1 课程目标掌握概率论和数理统计的基本概念学会使用MATLAB进行概率论和数理统计分析能够运用概率论和数理统计方法解决实际问题9.2 教学内容概率论基本概念和公式数理统计基本方法MATLAB中的概率论和数理统计函数随机数和概率分布函数的绘制假设检验和置信区间的计算9.3 教学方法理论讲解与实际操作相结合示例演示学生上机练习9.4 教学资源MATLAB软件PPT课件概率论和数理统计实例9.5 教学评估课后练习题上机练习第十章:综合案例分析10.1 课程目标能够综合运用所学的数学建模和MATLAB知识解决实际问题学会分析问题、建立模型、选择合适的算法和工具求解10.2 教学内容综合案例的选择和分析建立数学模型的方法MATLAB在模型求解中的应用数学建模报告的结构和要求10.3 教学方法案例分析与讨论学生分组实践10.4 教学资源MATLAB软件PPT课件综合案例数据和背景资料10.5 教学评估数学建模报告评分学生口头报告和讨论第十一章:非线性方程和方程组的求解11.1 课程目标理解非线性方程和方程组的概念学会使用MATLAB求解非线性方程和方程组掌握MATLAB中非线性求解的多种方法11.2 教学内容非线性方程和方程组的数学描述MATLAB中的非线性方程求解函数(如`fsolve`)非线性方程组的求解方法(如`ode45`)图像法求解非线性方程和方程组初始参数的选择和影响11.3 教学方法理论讲解与实际操作相结合示例演示学生上机练习11.4 教学资源MATLAB软件PPT课件非线性方程和方程组求解实例11.5 教学评估课后练习题第十二章:插值与拟合12.1 课程目标理解插值和拟合的概念学会使用MATLAB进行插值和拟合掌握MATLAB中插值和拟合的多种方法12.2 教学内容插值和拟合的基本概念MATLAB中的插值函数(如`interp1`)MATLAB中的拟合函数(如`fit`)插值和拟合的误差分析插值和拟合在数学建模中的应用12.3 教学方法理论讲解与实际操作相结合示例演示学生上机练习12.4 教学资源MATLAB软件PPT课件插值和拟合实例12.5 教学评估课后练习题第十三章:数值分析13.1 课程目标理解数值分析的基本概念学会使用MATLAB进行数值分析掌握MATLAB中数值分析的多种方法13.2 教学内容数值分析的基本概念MATLAB中的数值分析函数误差和稳定性分析数值分析在数学建模中的应用常见数值方法的比较和选择13.3 教学方法理论讲解与实际操作相结合示例演示学生上机练习13.4 教学资源MATLAB软件PPT课件数值分析实例13.5 教学评估课后练习题第十四章:MATLAB在信号处理中的应用14.1 课程目标理解信号处理的基本概念学会使用MATLAB进行信号处理掌握MATLAB中信号处理的基本方法14.2 教学内容信号处理的基本概念MATLAB中的信号处理函数信号的时域和频域分析信号处理在实际应用中的例子MATLAB在信号处理中的优势和局限性14.3 教学方法理论讲解与实际操作相结合示例演示学生上机练习14.4 教学资源MATLAB软件PPT课件信号处理实例14.5 教学评估课后练习题第十五章:MATLAB在图像处理中的应用15.1 课程目标理解图像处理的基本概念学会使用MATLAB进行图像处理掌握MATLAB中图像处理的基本方法15.2 教学内容图像处理的基本概念MATLAB中的图像处理函数图像的增强、滤波和边缘检测图像处理在实际应用中的例子MATLAB在图像处理中的优势和局限性15.3 教学方法理论讲解与实际操作相结合示例演示学生上机练习15.4 教学资源MATLAB软件PPT课件图像处理实例15.5 教学评估课后练习题重点和难点解析重点:1. MATLAB的工作环境及基本命令和操作。