R1R-1.5-RED;R1R-1.5-WHT;R1R-2.0-RED;R1R-2.0-WHT;R1R-2.5-RED;中文规格书,Datasheet资料
Tektronix Source Measure Unit (SMU) 选择指南说明书
SOURCE MEASURE UNITS The Broadest Choice of SMU Instruments Available Selector GuideS ou r c e M e a s u r e U n i t (S MU ) S o u r c e M e t e r ®Precision DMMTrueCurrent SourcePulse GeneratorElectronic LoadPrecision Power SupplyLA source measure unit (SMU) instrument is a five-in-one tool. It combines the useful features of a digital multimeter (DMM), power supply, current source, electronic load and pulse generator, all in a compact form factor. This empowers you to:Precisely source and measure voltage • Run production tests 60% faster and gain up to 10X more throughput • Save time, maximize speed and get jobs done quickly.MAKE MULTIPLE MEASUREMENTS ACCURATELY USING A SINGLE INSTRUMENTFor more than 70 years, Tektronix — the manufacturer of Keithley SMUs — has beendesigning, manufacturing and marketing advanced electrical test instruments and systems for the specialized needs of electronics manufacturers in high performance production testing, process monitoring, product development and research.• Repeatability Guaranteed • High Accuracy and Sensitivity • Fast and Precise • Broadest ChoicesWHY A KEITHLEY SOURCE MEASURE UNIT?2 | /KEITHLEY-SOURCE-MEASURE-UNITSTouch, Test, Invent TM with a Graphical Touchscreen SMU2450 SourceMeter® SMU Instrument (4)2460High Current SourceMeter® SMU Instrument (4)2461 High Current Pulse SourceMeter® SMU Instrument (4)2470 High Voltage SourceMeter® SMU Instrument (4)Standard Performance SMUs for the Most Basic Needs2601B/2602B/2604B Single/Dual Channel System SourceMeter® SMU Instrument (6)2611B/2612B/2614B Single/Dual Channel System SourceMeter® SMU Instrument (6)2634B/2635B/2636B Low Current Single/Dual Channel System SourceMeter®SMU Instrument (6)2601B-PULSE System SourceMeter 10 μs Pulser/SMU Instrument (7)High Power SMUs with Unprecedented Power, Precision, and Speed 2651A 50 Amp High Power System SourceMeter® SMU Instrument (8)2657A 3000 Volt High Power System SourceMeter® SMU Instrument (8)High Density, More Channels in a Smaller Form Factor2606B 4-Channel System SourceMeter® SMU Instrument (9)Specialty SMUs for Very Low Current and Optoelectronics Testing 6430 Sub-femtoamp Remote SourceMeter® SMU Instrument (10)2510 TEC SourceMeter® SMU Instrument (10)2510-AT Autotuning TEC SourceMeter® SMU Instrument (10)2520 Pulsed Laser Diode Test System (10)Determine which Keithley SMU Is Right For You (11)KEITHLEY’S WIDE SELECTION OF SOURCE MEASURE UNIT SMU INSTRUMENTS| 3/KEITHLEY-SOURCE-MEASURE-UNITS• Source and sink (4-quadrant) operation• Dual 1 MS/s digitizers for fast sampling measurements (2461 only)• Enhanced sensitivity with 20 mV and 10 nA source/measure ranges (2450 only)• Built-in, context-sensitive front panel help• SCPI and Test Script Processor (TSP®) programming modes• Front-panel USB 2.0 memory I/O port for transferring data, test scripts, or test configurationsSave Time, Maximize Speed, and Get Jobs Done QuicklySMU models that use familiar graphical interfaces, like icon-based menu structures, are easier to use for all experience levels. You’ll make measurements faster by reducing the learning curve and configuration steps, enabling you to learn faster, work smarter, and invent easier.4 | /KEITHLEY-SOURCE-MEASURE-UNITSSTANDARD PERFORMANCE SMUS FOR THE MOST BASIC NEEDSSeries 2400 SourceMeter SMU InstrumentsSMU VS. POWER SUPPLIES• SMUs can automatically sweep voltage or current to and from negative and positive outputs when the source crosses zero. • During these operations, there is no need to change test leads.• Output of a SMU can settle to within 0.01% of the specified accuracy in as little as 50 ms.• SMU has higher precision and wider operating ranges.• SMU is a more flexible optionSMU VS. THE DMMAND POWER SUPPLY COMBO• SMU tightly integrates the source and measure capability into one instrument, eliminating the need for a separate DMM and power supply.• Improves test times, simplifies overall test system design and increases usability • SMUs can outperform the DMM and Power Supply Combo on current vs. voltage (IV) measurements for a variety of applications.VS.VS.MORE USEFUL THAN THE COMBINATION OF INDIVIDUAL INSTRUMENTS| 5/KEITHLEY-SOURCE-MEASURE-UNITSSeries 2600B System SourceMeter SMU Instruments2601B-PULSE System SourceMeter10 μs Pulser/SMU Instrument• Industry leading 10 A @ 10 V, 10 microsecond pulse output• No tuning required for inductive loads up to 3 μH• Dual 1 Megasample/second digitizers for high speed I/Vpulse measurements (pulser function only)• DC capability up to ±40 V @ ±1.0 A, 40 Watt• TSP technology embeds complete test programs inside theinstrument for best-in-class system-level throughput• TSP-Link expansion technology for multi-channel paralleltest without a mainframe• USB 2.0, LXI-C, GPIB, RS-232, and digital I/O interfaces• Supported in the Keithley KickStart non-programming software toolTypical pulse output from a competitive SMU withovershoot and 6.47 μs rise time.2601B-PULSE output without overshoot and 1.4 µsrise time./KEITHLEY-SOURCE-MEASURE-UNITSAchieving Fast Pulse Measurementsfor Today’s High-Power DevicesGreen initiatives and energy efficiency standards worldwide have motivatedengineers to find ways to design more efficient semiconductor devices andintegrated circuits, and measuring the true state of these devices withoutthe effects of self-heating is critical. Pulsed characterization is a solutionto this issue. The use of a pulsed stimulus demands faster measurements.For high-speed digitization or waveform capture applications that requirethese capabilities, Keithley’s High Power SourceMeter® Instrument also includestwo high-speed ADCs for measuring current and voltage simultaneously. TheseADCs use sampling technology like an oscilloscope and take snapshots of thesignal over time. Each high-speed ADC samples at a rate of up to 1 MHz with18-bit resolution, which is much higher than the typical 8-bit resolution of anoscilloscope, resulting in more precise transient characterization in comparablebandwidths. Coupled with the ability to measure asynchronously from the source,this feature makes the 2651A and 2657A ideal for many waveform capture andtransient characterization applications.• Source or sink:−2,000 W of pulsed power (±40 V, ±50 A)−200 W of DC power (±10 V @ ±20 A, ±20 V@ ± 10 A, ±40 V @ ±5 A)• Easily connect two units (in series or parallel) to create solutions up to ±100 A or ±80 V1 pA resolution enables precise measurement of very low leakage currents1 μs per point (1 MHz), 18-bit sampling, accurately characterizes transient behavior2651A 50 Amp High Power System SourceMeter SMU Instrument2651A LEARN MORE• Source or sink up to 180 W of DC or pulsed power, (±3000 V @ 20 mA, ±1500 V @ 120 mA)• 1 fA low current resolution• Dual 22-bit precision ADCs and dual 18-bit 1 μs per point digitizers for high accuracyand high speed transient capture• Fully TSP® compliant for easy system integration with Series 2600B System SourceMeter modelsand 24XX Graphical SMUs2657A 3000 Volt High Power System SourceMeter SMU Instrument 2657A LEARN MORE8 | /KEITHLEY-SOURCE-MEASURE-UNITSSMALLER FORM FACTORwhich requires placing additionalracks of test equipment on theplant floor.| 9/KEITHLEY-SOURCE-MEASURE-UNITSRemote Electrical TestHead included• Fully digital P-I-D control; Autotuning capability for the thermal control loop (2510-AT)• Designed to control temperature during laser diode module testing• Wide temperature setpoint range (–50˚C to +225˚C) and high setpoint resolution (±0.001˚C) and stability (±0.005˚C)• Compatible with a variety of temperature sensor inputs: thermistors, RTDs, and IC sensors2520 Pulsed Laser Diode Test System• Integrated solution for in-process LIV production testing of laser diodes at the chip or bar level• Combines high accuracy source and measure capabilities or pulsed and DC testing• Synchronized DSP-based measurement channels ensure highly accurate light intensity and voltage measurements • Programmable pulse on time from 500 ns to 5 ms up to 4% duty cycle• Pulse capability up to 5 A, DC capability up to 1 A• 14-bit measurement accuracy on three measurement channels (V F , front photodiode, back photodiode)• Up to 1000-point sweep stored in buffer memory eliminates GPIB traffic during test, increasing throughput2510 LEARN MORE2520 LEARN MORE10 | /KEITHLEY-SOURCE-MEASURE-UNITS| 11 /KEITHLEY-SOURCE-MEASURE-UNITS12 | /KEITHLEY-SOURCE-MEASURE-UNITS| 13 /KEITHLEY-SOURCE-MEASURE-UNITSFor more information about Source Measure Units, visit our Source Measure Unit Tutorial page to review additional literature, and view product demos and webinars. /learning/what-is-a-source-measure-unit14 | /KEITHLEY-SOURCE-MEASURE-UNITSContact Information:Australia 1 800 709 465Austria* 00800 2255 4835Balkans, Israel, South Africa and other ISE Countries +41 52 675 3777Belgium* 00800 2255 4835Brazil +55 (11) 3759 7627Canada 180****9200Central East Europe / Baltics +41 52 675 3777Central Europe / Greece +41 52 675 3777Denmark +45 80 88 1401Finland +41 52 675 3777France* 00800 2255 4835Germany* 00800 2255 4835Hong Kong 400 820 5835India 000 800 650 1835Indonesia 007 803 601 5249Italy 00800 2255 4835Japan 81 (3) 6714 3086Luxembourg +41 52 675 3777Malaysia 180****5835Mexico, Central/South America and Caribbean 52 (55) 56 04 50 90Middle East, Asia, and North Africa +41 52 675 3777The Netherlands* 00800 2255 4835New Zealand 0800 800 238Norway 800 16098People’s Republic of China 400 820 5835Philippines 1 800 1601 0077Poland +41 52 675 3777Portugal 80 08 12370Republic of Korea +82 2 565 1455Russia / CIS +7 (495) 6647564Singapore 800 6011 473South Africa +41 52 675 3777Spain* 00800 2255 4835Sweden* 00800 2255 4835Switzerland* 00800 2255 4835Taiwan 886 (2) 2656 6688Thailand 1 800 011 931United Kingdom / Ireland* 00800 2255 4835USA 180****9200Vietnam 12060128* European toll-free number. If notaccessible, call: +41 52 675 3777Rev. 02.2018Find more valuable resources at Copyright © Tektronix. All rights reserved. Tektronix products are covered by U.S. and foreign patents, issued and pending. Information in this publication supersedes thatin all previously published material. Specification and price change privileges reserved. TEKTRONIX and TEK are registered trademarks of Tektronix, Inc. All other tradenames referenced are the service marks, trademarks or registered trademarks of their respective companies.040920.sbg 1KW-61458-2。
研华嵌入式计算机ITA-1711N系列用户手册说明书

用户手册ITA-1711N系列无风扇嵌入式Celeron级双核紧凑型工业电脑版权声明随附本产品发行的文件为研华公司2020年版权所有,并保留相关权利。
针对本手册中相关产品的说明,研华公司保留随时变更的权利,恕不另行通知。
未经研华公司书面许可,本手册所有内容不得通过任何途径以任何形式复制、翻印、翻译或者传输。
本手册以提供正确、可靠的信息为出发点。
但是研华公司对于本手册的使用结果,或者因使用本手册而导致其它协力厂商的权益受损,概不负责。
认可声明ITA-1711N为研华公司的商标。
所有其他产品名或商标均为各自所属方的财产。
在线技术支持关于技术支持和服务,请访问研华技术支持网站:产品质量保证(两年)从购买之日起,研华为原购买商提供两年的产品质量保证。
但对那些未经授权的维修人员维修过的产品并不进行质量保证。
研华对于不正确的使用、灾难、错误安装产生的问题有免责权利。
如果研华产品出现故障,在质保期内我们提供免费维修或更换服务。
对于出保产品,我们将会酌情收取材料费、人工服务费用。
请联系您的销售人员了解详细情况。
如果您认为您购买的产品出现了故障,请遵循以下步骤:1.收集您所遇到的问题的信息(例如,CPU主频、使用的研华产品及其它软件、硬件等)。
请注意屏幕上出现的任何不正常信息显示。
2.打电话给您的供货商,描述故障问题。
请借助手册,产品和任何有帮助的信息。
3.如果您的产品被诊断发生故障,请从您的供货商那里获得RMA (ReturnMaterial Authorization) 序列号。
这可以让我们尽快地进行故障产品的回收。
4.请仔细地包装故障产品,并在包装中附上完整的售后服务卡片和购买日期证明(如销售发票)。
我们对无法提供购买日期证明的产品不提供质量保证服务。
5.把相关的RMA序列号写在外包装上,并将其运送给销售人员。
料号:2001171180第一版中国印刷2020年3月ITA-1711N用户手册ii致客户研华为客户提供的服务研华的每一款产品都是严格按照规格生产的。
BW材料

B&W材料代换 MBD CHINESE S05R 15 S12R 15 S13R 10 S14A 15MnC S15S 15 S20R 20 S20B 20 S20S 20 S12K 25Mn S30S 30 S35R 35 S36S 35 S39S 40 S44S 40 S45SU 45 S45SY 45 S52R 45 S17R B(>=45正火)20 S18R B(>=45正火)20 S19R 16Mng,20CrMo S35B 35 S40R 35Mn S45RN 45Mn S15Mo 15CrMo S42R-N 35CrMoA S35CrV 40CrV S22Mo 15CrMo S19MO 15CrMo S25Cr1 35CrMo S35CrVX 35CrMo S35CrVY 35CrMo S35CrVZ 35CrMo S42Crl 42CrMo SVITR 38CrMoAI SNITR 38CrMoAI S15N2 12CrNi3 SCrNI 40CrNiMoA S35N2Y 35CrMo S35V2Y 40CrNiMoA SNCrW 4Cr14Ni14W2Mo S90MN1H 9CrWMn SFJB 65Mn SFJR 60Si2CrA SFJE 50CrVA SFJV 50CrV S100RN-H T10 S110B T11
电磁场与电磁波理论基础 第二章 课后答案
1 q1 q2 u (r ) = + 4πε 0 R1 R2
式中
+q
Z
P ( x, y,z )
R1
r
r2
o
R2
R1 = r - r1 = ( x + a ) e x + ye y + e z R1 = ( x + a ) + y 2 + z 2 R 2 = r - r2 = ( x - a ) e x + ye y + e z R2 = ( x - a ) + y 2 + z 2
②当 a <
ρ < b ,此时 Q = 2π al ρ S1 ,由高斯定理可得
D ⋅ dS = 2π l ρ Dρ = Q = 2π al ρ
(S )
S1
Dρ =
a ρS1
ρ
D =
a ρS1
ρ
eρ
E =
a ρS1
ε0ρ
eρ
③当 ρ > b ,此时高斯面内的 Q = 2π al ρ S 1 + 2π bl ρ S 2 ,由高斯定理可得
代入得到
2 2
2
2
é ù 1 ê 8 (4e x - 4e z ) 4 (4e x - 4e y ) ú ê ú E (r ) = 3 3 ú 4pe 0 ê 4 2 4 2 êë úû 1 ée x + e y - 2e z ù = ê ûú 32 2pe 0 ë
(
)
(
)
2-7.一个点电荷+q 位于(-a, 0, 0)处,另一点电荷-2q 位于(a, 0, 0)处,求电位等于零的 面;空间有电场强度等于零的点吗? 解 根据点电荷电位叠加原理,有
基因毒性杂质-基毒、重金属资料

遗传毒性杂质遗传毒性:泛指各种因素(物理、化学因素)与细胞或生物体的遗传物质发生作用而产生的毒性。
1、致突变性:与DNA相互作用产生直接潜在的影响,使基因突变(bacteria reverse mutation(Ames)试验)2、致癌性:具有致癌可能或倾向(需要长期研究!)3、警示结构特征:一些特殊的结构单元具有与遗传物质发生化学反应的能力,会诱导基因突变或者导致染色体重排或断裂,具有潜在的致癌风险。
遗传毒性物质:在很低的浓度下即可诱导基因突变以及染色体的断裂和重排,因此具有潜在的致癌性。
EMA通告(1)、具体事项:1、哪些品种中会出现甲磺酸酯(或甲磺酸烷基酯)。
特别是甲磺酸盐等形式的API或其合成中用到甲磺酸的API,甲磺酸烷基酯-甲磺酸甲酯、乙酯、其它低级醇酯,应认定为潜在杂质。
2、羟乙基磺酸盐、苯磺酸盐、对甲苯磺酸盐的API。
应说明类似物质磺酸烷基酯或芳基酯污染的危险。
3、限度要求:无其它毒性数据时,这些高风险杂质应依据TTC设定限度。
1.5μg÷以g为单位的最大日剂量得ppm限度。
4、法律依据:EP专论要求凡以甲磺酸盐和羟乙基磺酸盐形式存在的API,均应在其生产过程中采取以下安全措施:必须对生产工艺进行评估以确定家磺酸烷基酯(羟乙基磺酸烷基酯)形成的可能,特别是反应溶媒含低级醇的时候,很可能会出现这些杂质。
必需时需对生产工艺进行验证以说明在成品中未检出这类杂质。
(2)、落实措施:1、API生产是否涉及在甲磺酸(羟乙基磺酸盐、苯磺酸盐、对甲苯磺酸等低分子量磺酸)或相应酰氯存在下,使用甲醇、乙醇、正丙醇、异丙醇等低级脂肪醇(如甲醇、乙醇、正丙醇、异丙醇等)。
2、对相应酯形成的可能性是否降到最低。
3、是否有有效的清除精制步骤。
设备清洗-是否设计的低级脂肪醇的使用(方法,TTC限度)?起始物料(低分子量磺酸盐或酰氯)中是否控制了其低级脂肪醇酯(方法,TTC限度)?当被磺酸酯或相关物质污染的磺酸用于API合成时能否保证其中潜在的遗传毒性杂质不超过TTC?应考虑各种烷基或芳基磺酸酯杂质累积的风险。
Depression Scoring Manual

DEPRESSIONSCORING MANUAL A brief guide to scoring the PROMIS ® Depression instruments:ADULT PEDIATRICEARLY CHILDHOOD PARENT-REPORT PARENT PROXY PROMIS Item Bank v1.0 – Depression PROMIS Item Bank v1.0 – Depression (recommended) PROMIS Item Bank v1.0 – Depression (screen-to-CAT) PROMIS Short Form v1.0 – Depression 4a PROMIS Short Form v1.0 – Depression 6a PROMIS Short Form v1.0 – Depression 8a PROMIS Short Form v1.0 – Depression 8b PROMIS-Ca Bank v1.0 – Depression PROMIS Pediatric Bank GenPop v3.0 – Depressive Symptoms PROMIS Pediatric Bank GenPop v3.0 – Depressive Symptoms (screen-to-CAT) PROMIS Pediatric Short Form GenPop v3.0 – Depressive Symptoms 8a PROMIS Pediatric Item Bank v2.0 – Depressive Symptoms* PROMIS Pediatric Item Bank v2.0 – Depressive Symptoms (recommended)* PROMIS Pediatric Item Bank v2.0 – Depressive Symptoms (screen-to-CAT)* PROMIS Pediatric Short Form v2.0 – Depressive Symptoms 8a* PROMIS Pediatric Item Bank v1.1 – Depressive Symptoms* PROMIS Pediatric Short Form v1.1 – Depressive Symptoms 8b* PROMIS Pediatric Item Bank v1.0 – Depressive Symptoms* PROMIS Pediatric Short Form v1.0 – Depressive Symptoms 8a* PROMIS Early Childhood Parent-Report Bank v1.0 – Depressive Symptoms PROMIS Early Childhood Parent-Report Short Form v1.0 – Depressive Symptoms 4a PROMIS Early Childhood Parent-Report Short Form v1.0 – Depressive Symptoms 8a PROMIS Parent Proxy Bank GenPop v3.0 – Depressive Symptoms PROMIS Parent Proxy Bank GenPop v3.0 – Depressive Symptoms (screen-to-CAT) PROMIS Parent Proxy Short Form GenPop v3.0 – Depressive Symptoms 6a PROMIS Parent Proxy Item Bank v2.0 – Depressive Symptoms* PROMIS Parent Proxy Item Bank v2.0 – Depressive Symptoms (recommended)* PROMIS Parent Proxy Item Bank v2.0 – Depressive Symptoms (screen-to-CAT)* PROMIS Parent Proxy Short Form v2.0 – Depressive Symptoms 6a* PROMIS Parent Proxy Item Bank v1.1 – Depressive Symptoms* PROMIS Parent Proxy Short Form v1.1 – Depressive Symptoms 6b* PROMIS Parent Proxy Item Bank v1.0 – Depressive Symptoms* PROMIS Parent Proxy Short Form v1.0 – Depressive Symptoms 6a* *Retired measureCOMPARING SCORES ACROSS VERSIONSSome PROMIS domains have multiple versions of instruments (i.e., v1.0, v1.1, v2.0, v3.0). Generally, it is recommended that you use the most recent version available which can be identified as the instrument with the highest version number. In most cases, an instrument that has a decimal increase (v1.0 to v1.1) retains the same item-level parameters as well as instrument reliability and validity. In cases where a version number increases by a whole number (e.g., v1.0 to v2.0), the changes to the instrument are more substantial.• For Depression, the calibrations between v1.0, v1.1, and v2.0 are identical. Consequently, T-scores from v1.0, v1.1, and v2.0 are comparable.• Scores from Pediatric and Parent Proxy GenPop v3.0 are NOT comparable with v1.0, v1.1, or v2.0 measure scores. Transforming Scores between Versions: To transform T-scores from Pediatric/Parent Proxy v1.0/v1.1/v2.0 Depressive Symptoms measures to the Pediatric/Parent Proxy GenPop v3.0 metric, rescore v1.0/v1.1/v2.0 measures using the HealthMeasures Scoring Service or Assessment Center API. This is the preferred strategy as it produces precise scores.1.Download the v3.0 measure from Search & View Measures on .2.Revise your dataset as needed to match the v3.0 item IDs and response scores:o PROMIS Parent Proxy Bank GenPop v3.0 - Depressive Symptoms and PROMIS Parent Proxy Bank GenPop v3.0 - Depressive Symptoms (screen-to-CAT):The Item ID Pf2depr1r was changed to Pf2depr1r2 to account for the revised Response Scores from 1-2-3-4-5 to 1-2-3-4-4.3.Follow the instructions for using the HealthMeasures Scoring Service. Contact*********************** if using the Assessment Center API for rescoring.The crosswalk tables in Appendix 3 may also be used as a reference to guide understanding of how scores have shifted from the older v1.0, v1.1, and v2.0 measures to the v3.0 measures. If these tables are used to convert older T-scores to GenPop v3.0, please note that the resulting T-scores are not as precise as those generated by using HealthMeasures Scoring Service or Assessment Center API.WHICH CALIBRATION SAMPLE SHOULD I USE?Some PROMIS Parent Proxy v1.0, v1.1, and v2.0 measures (Anxiety, Depressive Symptoms, Fatigue, Mobility, Pain Interference, Peer Relationships) had two calibration samples – “Parent Proxy” and “Parent Proxy Without Local Dependence.” The former (Parent Proxy) included calibrations for all items. This was the default calibration sample. The Parent Proxy Without Local Dependence did not include calibrations for some items. The items without calibrations are enemy items. That is, a dyad or triad of items was identified in which there are psychometric reasons to only administer one of those items to a given respondent. For example, itemPf2anxiety5 and Pf2anxiety4 are enemy items. A participant should only see one of these items in a CAT. Thev3.0 GenPop measure have a single calibration sample and no enemy items.SCORING THE INSTRUMENTShort Forms: PROMIS instruments are scored using item-level calibrations. This means that the most accurate way to score a PROMIS instrument is to use the HealthMeasures Scoring Service(https:///ac_scoringservice) or a data collection tool that automatically calculates scores (e.g., REDCap auto-score). This method of scoring uses responses to each item for each participant. We refer to this as “response pattern scoring.” Because response pattern scoring is more accurate than the use of raw score/scale score look up tables included in this manual, it is preferred. Response pattern scoring is especially useful when there is missing data (i.e., a respondent skipped an item), different groups of participants responded to different items, or you have created a new questionnaire using a subset of questions from a PROMIS item bank.Instructions for the HealthMeasures Scoring Service1.Download the Input Template from the HealthMeasures Scoring Service home page.2.Add your data (all respondents’ individual answers to questions) for one PROMIS measure to thetemplate (multiple timepoints are okay).3.Determine how much data is missing. In order to produce a precise score, a respondent must answer atleast 4 items in measures that include 4 or more items. If a precise score is required, removerespondents who answered less than 4 items from the input template and do not calculate a T-score.4.Upload your spreadsheet to the HealthMeasures Scoring Service. If this is your first time, register as anew user.5.Access your email to receive a spreadsheet with calculated scores.Instructions for Using Raw Sum Score to T-score Conversion TablesEach question usually has five response options ranging in value from one to five. To find the total raw score for a short form with all questions answered, sum the values of the response to each question. For example, for the adult 8-item form, the lowest possible raw score is 8; the highest possible raw score is 40 (see all short form scoring tables in Appendix 1). All questions must be answered in order to produce a valid score using the scoring tables. If a participant has skipped a question, use the HealthMeasures Scoring Service(https:///ac_scoringservice) to generate a final score.Locate the applicable score conversion table in Appendix 1 and use this table to translate the total raw scorei nto a T-score for each participant. The T-score rescales the raw score into a standardized score with a mean of50 and a standard deviation (SD) of 10. Therefore, a person with a T-score of 40 is one SD below the mean. For the Adult PROMIS Depression 8b short form, a raw score of 10 converts to a T-score of 46.2 with a standard error (SE) of 2.8 (see scoring table for the 8b short form in appendix). Thus, the 95% confidence interval around the observed score ranges from 40.7 to 51.7 (T-score + (1.96*SE) or 46.2 + (1.96*2.8).CAT: A minimum number of items (e.g., 4) must be answered in order to receive a score for the Depression CATs. The response to the first item will guide the system’s choice of the next item for the participant. The participant’s response to the second item will dictate the selection of the following question, and so on. As additional items are administered, the potential for error is reduced and confidence in the respondent’s score increases. The CAT will continue until either the standard error drops below a specified level (e.g., on the T-score metric 3.0), or the participant has answered the maximum number of questions (e.g., 12), whichever occurs first. For some CATs, specifically “recommended” and “screen-to-CAT” there are additional stopping rules. These include stopping when the standard error isn’t improving much or if a respondent is asymptomatic. For details on the exact stopping rules for Depression CATs, view the Measure Differences summary.SCORESFor most PROMIS instruments, a score of 50 is the average for the United States general population with a standard deviation of 10 because calibration testing was performed on a large sample of the general population. You can read more about the calibration and centering samples on (/score-and-interpret/interpret-scores/promis). The T-score is provided with an error term (Standard Error or SE). The Standard Error is a statistical measure of variance and represents the “margin of error” for the T-score.Important:A higher PROMIS T-score represents more of the concept being measured. For negatively-worded concepts like depression, a T-score of 60 is one SD worse than average. By comparison, a depression T-score of 40 is one SD better than average.Standard Error (SE): A PROMIS score includes a T-score and a standard error (SE). The standard error is a measure of the variability for a given T-score across hypothetical repeated measurements. The standard error can be used to construct confidence intervals around a T-score. A 95% confidence interval is common. A 95% confidence interval means there is a 95% probability that the true T-score is within this range. The formula for a 95% confidence interval is (T-score + (1.96*SE). For example, if T=52 and SE=2, the lower boundary of the confidence interval is (52 – (1.96*2) = 48 and the upper boundary is (52 + (1.96*2) = 56.FREQUENTLY ASKED QUESTIONS (FAQs)Q: I am interested in learning more. Where can I do that?Review the HealthMeasures website at .Q: How do I handle multiple responses when administering a short form on paper?Guidelines on how to deal with multiple responses have been established. Resolution depends on the responses noted by the research participant.•If two or more responses are marked by the respondent, and they are next to one another, then a data entry specialist will be responsible for randomly selecting one of them to be entered and will write down on the form which answer was selected. Note: To randomly select one of two responses, the data entry specialist will flip a coin (heads - higher number will be entered; tails – lower number will be entered).To randomly select one of three (or more) responses, a table of random numbers should be used with astatistician’s assistance.•If two or more responses are marked, and they are NOT all next to one another, the response will be considered missing.Q: What is the minimum change on a PROMIS instrument that represents a clinically meaningful difference? To learn more about research on the meaning of a change in scores, we suggest conducting a literature review to identify the most current information. The HealthMeasures website (/score-and-interpret/interpret-scores/promis) has additional information on interpreting scores.APPENDIX 1 — SCORING TABLES PROMIS Adult Short Formv1.0 – Depression 4aShort Form Conversion TableRaw Summed Score T-Score SE*4 41.0 6.25 49.0 3.26 51.8 2.77 53.9 2.48 55.7 2.39 57.3 2.310 58.9 2.311 60.5 2.312 62.2 2.313 63.9 2.314 65.7 2.315 67.5 2.316 69.4 2.317 71.2 2.418 73.3 2.419 75.7 2.620 79.4 2.6 SE* = Standard Error on T-ScorePROMIS Adult Short Formv1.0 – Depression 6a Short Form Conversion TableRaw Summed Score T-Score SE*6 38.4 5.87 45.2 3.48 48.3 2.89 50.4 2.410 52.0 2.211 53.4 2.112 54.7 2.013 55.9 2.014 57.0 1.915 58.2 1.916 59.3 2.017 60.5 2.018 61.7 2.019 62.9 2.020 64.2 2.021 65.5 2.022 66.7 2.023 68.0 2.024 69.3 2.025 70.6 2.026 72.0 2.027 73.4 2.028 75.0 2.129 76.9 2.430 80.3 3.5 SE* = Standard Error on T-ScorePROMIS Adult Short Formv1.0 – Depression 8a Short Form Conversion TableRaw Summed Score T-Score SE*8 38.2 5.79 44.7 3.310 47.5 2.711 49.4 2.312 50.9 2.013 52.1 1.914 53.2 1.815 54.1 1.816 55.1 1.717 55.9 1.718 56.8 1.719 57.7 1.720 58.5 1.721 59.4 1.722 60.3 1.723 61.2 1.724 62.1 1.825 63.0 1.826 63.9 1.827 64.9 1.828 65.8 1.829 66.8 1.830 67.7 1.831 68.7 1.832 69.7 1.833 70.7 1.834 71.7 1.835 72.8 1.836 73.9 1.837 75.0 1.938 76.4 2.039 78.2 2.440 81.3 3.4 SE* = Standard Error on T-ScorePROMIS Adult Short Formv1.0 – Depression 8b Short Form Conversion TableRaw Summed Score T-score SE*8 37.1 5.59 43.3 3.410 46.2 2.811 48.2 2.412 49.8 2.213 51.2 2.014 52.3 1.915 53.4 1.816 54.3 1.817 55.3 1.718 56.2 1.719 57.1 1.720 57.9 1.721 58.8 1.722 59.7 1.823 60.7 1.824 61.6 1.825 62.5 1.826 63.5 1.827 64.4 1.828 65.4 1.829 66.4 1.830 67.4 1.831 68.3 1.832 69.3 1.833 70.4 1.834 71.4 1.835 72.5 1.836 73.6 1.837 74.8 1.938 76.2 2.039 77.9 2.440 81.1 3.4SE* = Standard Error on T-ScorePROMIS Pediatric Short Form GenPop v3.0 –Depressive Symptoms 8aShort Form Conversion TableRaw SummedScore T-score SE*8 39.9 5.99 46.9 3.210 49.3 2.711 51.0 2.312 52.4 2.113 53.6 2.014 54.6 1.915 55.6 1.816 56.5 1.817 57.4 1.818 58.3 1.819 59.1 1.820 60.0 1.821 60.8 1.822 61.7 1.823 62.5 1.824 63.3 1.825 64.1 1.826 64.9 1.827 65.7 1.828 66.5 1.729 67.3 1.730 68.0 1.731 68.8 1.732 69.6 1.733 70.4 1.734 71.2 1.835 72.1 1.836 73.1 1.937 74.2 2.038 75.5 2.239 77.2 2.540 80.3 3.4 *SE = Standard Error on T-score metricPROMIS Early Childhood Parent-Report Short Form v1.0 – Depressive Symptoms 4a Short Form Conversion TableRaw Summed Score T-score SE*4 42.4 6.85 50.5 4.46 54.5 3.87 57.6 3.58 60.2 3.49 62.5 3.410 64.8 3.411 67.0 3.412 69.1 3.413 70.9 3.414 72.7 3.415 74.6 3.316 76.4 3.317 78.4 3.318 80.4 3.319 82.4 3.220 84.9 3.1 *SE = T-score standard errorPROMIS Early Childhood Parent-Report Short Form v1.0 – Depressive Symptoms 8a Short Form Conversion TableRaw Summed Score T-score SE*8 41.0 6.59 47.8 4.410 51.0 3.711 53.5 3.112 55.4 2.813 57.1 2.614 58.5 2.515 59.9 2.516 61.2 2.417 62.4 2.418 63.6 2.419 64.8 2.420 65.9 2.421 67.1 2.422 68.2 2.423 69.3 2.424 70.3 2.425 71.3 2.426 72.3 2.427 73.3 2.428 74.3 2.329 75.3 2.330 76.2 2.331 77.2 2.332 78.2 2.333 79.2 2.334 80.2 2.335 81.2 2.336 82.3 2.437 83.5 2.438 84.8 2.439 86.1 2.340 87.4 2.0 SE* = Standard Error on T-ScorePROMIS Parent Proxy Short Form GenPop v3.0 – Depressive Symptoms 6aShort Form Conversion TableRawSummedT-score SE* Score6 40.8 6.27 48.2 3.58 51.1 2.99 53.2 2.510 54.9 2.411 56.4 2.312 57.9 2.213 59.2 2.214 60.6 2.215 61.9 2.216 63.2 2.217 64.6 2.218 65.9 2.219 67.1 2.220 68.3 2.221 69.6 2.222 70.7 2.123 71.9 2.124 73.0 2.125 74.2 2.126 75.4 2.227 76.7 2.328 78.2 2.529 79.8 2.630 82.7 3.1 *SE = Standard Error on T-score metricAPPENDIX 2 – SCORING TABLES FOR RETIRED MEASURESPROMIS Pediatric Short Form v1.0– Depressive Symptoms 8aShort Form Conversion TableRaw Summed Score T-Score SE*0 35.2 5.81 40.4 4.62 43.2 4.23 45.5 3.84 47.4 3.65 49.1 3.46 50.5 3.37 51.9 3.28 53.2 3.19 54.3 3.110 55.5 3.011 56.6 3.012 57.7 3.013 58.7 3.014 59.7 2.915 60.7 2.916 61.8 2.917 62.8 2.918 63.7 2.919 64.7 2.920 65.7 2.921 66.8 2.922 67.8 2.923 68.8 2.924 69.9 2.925 70.9 2.926 72.1 3.027 73.2 3.028 74.5 3.129 75.9 3.230 77.5 3.431 79.3 3.532 81.9 3.7 SE* = Standard Error on T-ScorePROMIS Pediatric Short Form v1.1 – Depressive Symptoms 8b Short Form Conversion Table RawT-score SE* SummedScore0 35.2 5.81 40.4 4.62 43.2 4.23 45.5 3.94 47.4 3.75 49.1 3.56 50.6 3.37 52.0 3.28 53.3 3.29 54.5 3.110 55.7 3.111 56.8 3.012 57.9 3.013 59.0 3.014 60.0 3.015 61.1 3.016 62.1 3.017 63.1 3.018 64.1 3.019 65.1 3.020 66.1 3.021 67.2 2.922 66.2 2.923 69.3 3.024 70.3 3.025 71.4 3.026 72.6 3.027 73.8 3.128 75.1 3.229 76.5 3.330 78.1 3.531 79.9 3.632 82.4 3.7 SE*= Standard Error on T-ScorePROMIS Pediatric Short Form v2.0 – Depressive Symptoms 8a Short Form Conversion TableRaw Summed Score T-Score SE*8 35.2 5.89 40.4 4.610 43.2 4.211 45.5 3.912 47.4 3.713 49.1 3.514 50.6 3.315 52.0 3.216 53.3 3.217 54.5 3.118 55.7 3.119 56.8 3.020 57.9 3.021 59.0 3.022 60.0 3.023 61.1 3.024 62.1 3.025 63.1 3.026 64.1 3.027 65.1 3.028 66.1 3.029 67.2 2.930 68.2 2.931 69.3 3.032 70.3 3.033 71.4 3.034 72.6 3.035 73.8 3.136 75.1 3.237 76.5 3.338 78.1 3.539 79.9 3.640 82.4 3.7 SE* = Standard Error on T-ScorePROMIS Parent Proxy Short Form v1.0 – Depressive Symptoms 6a Short Form Conversion Table RawSummedT-Score SE* Score0 36.0 6.01 42.0 4.02 45.0 4.03 48.0 4.04 50.0 3.05 52.0 3.06 54.0 3.07 55.0 3.08 57.0 3.09 59.0 3.010 60.0 3.011 62.0 3.012 64.0 3.013 65.0 3.014 67.0 3.015 68.0 3.016 70.0 3.017 72.0 3.018 73.0 3.019 75.0 3.020 77.0 3.021 78.0 3.022 80.0 3.023 83.0 4.024 86.0 4.0 SE* = Standard Error on T-ScorePROMIS Parent Proxy Short Form v1.1 – Depressive Symptoms 6b Short Form Conversion TableRaw Summed Score T-Score SE*0 36.0 5.91 42.1 4.42 45.4 4.03 48.0 3.64 50.2 3.45 52.1 3.36 53.9 3.27 55.6 3.18 57.2 3.19 58.9 3.110 60.5 3.111 62.1 3.112 63.7 3.113 65.3 3.114 66.8 3.115 68.4 3.116 70.0 3.117 71.5 3.018 73.1 3.019 74.7 3.020 76.3 3.121 78.1 3.222 80.2 3.323 82.5 3.424 84.7 3.2SE* = Standard Error on T-ScorePROMIS Parent Proxy** Short Form v2.0 – Depressive Symptoms Short Form Conversion Table RawSummedT-Score SE* Score6 36.2 5.97 42.1 4.48 45.4 4.09 48.0 3.610 50.2 3.411 52.1 3.312 53.9 3.213 55.6 3.114 57.2 3.115 58.9 3.116 60.5 3.117 62.1 3.118 63.7 3.119 65.3 3.120 66.8 3.121 68.4 3.122 70.0 3.123 71.5 3.024 73.1 3.025 74.7 3.026 76.3 3.127 78.1 3.228 80.2 3.329 82.5 3.430 84.7 3.2 SE*=Standard Error on T-Score**All scoring tables are based on default Parent Proxy calibrations.APPENDIX 3 – CROSSWALK BETWEEN PEDIATRIC AND PARENT PROXY V2.0 T-SCORES AND PEDIATRIC AND PARENT PROXY GENPOP V3.0 T-SCORESTable 1. PROMIS Pediatric Depressive Symptoms: Crosswalk between v2.0 T-scores and GenPop v3.0 T-scoresPROMIS PediatricDepressive Symptoms T-Score PROMIS PediatricDepressive Symptoms T-Scorev2.0 v3.0 GenPop v2.0 v3.0 GenPop32 37.0 70 69.533 41.0 71 70.034 41.7 72 70.335 42.2 73 71.536 43.7 74 72.337 44.6 75 73.038 45.6 76 74.039 46.5 77 74.540 47.3 78 75.041 48.2 79 76.042 49.0 80 76.043 49.5 81 77.044 50.045 50.746 51.547 52.148 52.749 53.550 54.251 54.952 55.653 56.254 56.855 57.556 58.257 59.058 60.059 60.960 61.661 62.262 63.463 64.164 64.665 65.466 66.067 66.568 68.069 68.7Table 2. PROMIS Parent Proxy Depressive Symptoms: Crosswalk between v2.0 T-scores and GenPop v3.0 T-scoresPROMIS Parent Proxy Depressive SymptomsT-Score PROMIS Parent Proxy Depressive SymptomsT-Scorev2.0 v3.0 GenPop v2.0 v3.0 GenPop32 37.0 70 70.033 39.5 71 71.634 40.0 72 71.935 41.2 73 72.336 43.3 74 73.037 43.7 75 74.038 44.4 76 74.039 45.4 77 75.040 46.441 47.742 48.343 49.344 50.045 50.646 51.247 52.148 52.949 53.650 54.351 55.152 55.953 56.654 57.355 58.156 58.957 59.658 60.559 61.260 62.161 63.062 63.763 64.364 64.865 66.066 67.067 67.468 68.669 69.3。
恒生历年笔试题
恒生历年笔试题单选1、采用面向对象技术开发的应用系统的特点是()。
A.重用性更强B.运行速度更快C.占用存储量小D.维护更复杂2、已经获得除CPU以外的所有所需资源的进程处于()状态。
A.运行状态B.就绪状态C.自由状态D.阻塞状态3、Linu某文件权限一共10位长度,分成四段,第三段表示的内容是()。
A.文件类型B.文件所有者权限C.文件所有者所在组的权限D.其他用户权限4、栈和队列的共同特点是()。
A.都是先进先出B.都是先进后出C.只允许在端点处插入和删除元素D.没有共同点5、一下关于排序算法的叙述中,正确的是()。
A.冒泡排序法中,元素的交换次数与元素的比较次数一定相同B.冒泡排序法中,元素的交换次数不少于元素的比较次数C.简单选择排序中,关键字相同的记录在排序前后的相对位置一定不变D.简单选择排序中,关键字相同的记录在排序前后的相对位置可能交换6.在一个单链表HL中,若要在指针q所指结点的后面插入一个由指针p所指向的结点,则执行()A.q->ne某t=p->ne某t;p->ne某t=q;B.p->ne某t=q->ne某t;q=p;C.q->ne某t=p->ne某t;p->ne某t=q;D.p->ne某t=q->ne某t;q->ne某t=p;7.下列关于线程优先级别的说法中,正确的是()A.线程的优先级是不能改变的B.线程的优先级在创建线程时设定C.在创建线程后的任何时候都可以设置D.B,C8.已知二叉树前序遍历序列是FBEADC,中序遍历序列是EABDFC,它的后序遍历序列()A.CDAEBFB.AEDBCFC.EADBCFD.EBACFD9.数据库的概念模型独立于()A.E-R图B.具体的机器和DBMSC.现实世界D.用户需求10.以下关于主键的描述正确的是()A.标识表中唯一的实体B.创建唯一的索引,允许空值C.只允许以表中第一字段建立11.若某线性表中最常用的操作是在最后一个元素之后插入一个元素和删除第一个元素,则采用()存储方式最节省运算时间。
滤波电路主要有以下四种基本类型
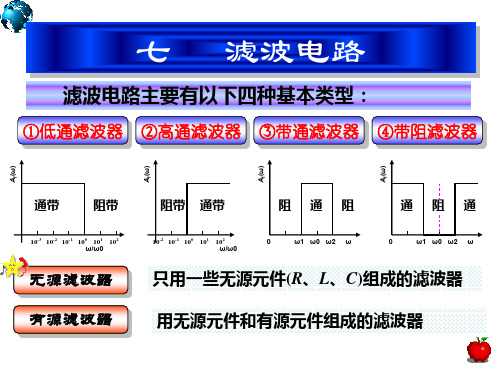
七
①低通滤波器
i
R 1 R jC
1 1 1 jRC
1 0 1 j
1 RC
0
(c)
C
o
U i
R
(b)
U o
它们的截止存在的问题 (1)电路的增益小,最大为1 (2)带负载能力差
1 0.707
0
o
(d )
如在无源滤波电路输 出端接一负载电阻RL, 则其截止频率和增益 均随RL而变化。
简单二阶低通滤波 电路的幅频特性
由幅频特性可见ω>>ω0时衰减 的斜率为-40dB/十倍频。但在 ω0附近,其幅频特性与理想的 低通滤波特性相差较大。
0 -3dB
20 lg
Af ( ) / dB Af
-40dB/十倍 频
0.1 0.37 1
10
ω/ω0
改进
R
1
R
U
2
f
将电容C1的接 地端改接到集成 运放的输出端。
o
up
o
A A
up
高通
1
通
1
阻
2
通
o
带阻滤波器电路图
C
C
R
1
R
f
1 o 1 j 2 Q o 2 Rf 1 1 Af 1 Q R1 RC 22 Af