WinMDI 中文说明书
MDI JADE 中文使用手册-黄老师
MDI Jade 使用手册
X 射线衍射实验操作指导
黄继武 编
中南大学 2006 年 6 月 5 日修改版
2
读入文件
(2)选择文件存贮路径 操作方式与 Windows 其它应用软件相同。 3 文件的读入方式 文件的读入方式有两种,一种是读入,另一种是添加。 (1)Read:读入单个文件或同时读入多个选中的文件。读入时,原来显示在主窗口中的图 谱被清除; (2)Add:增加文件显示。如果主窗口中已显示了一个或多个谱,为了不被新添加的文件 清除,使用增加的方式读入文件。在做多谱线对比时,多用这种方式。 如果需要有序地排列多个谱,建议一个一个地 Add 谱,这在后面的图谱排列中一直有序, 否则,Jade 按默认的方式排列谱。
1
读入文件
读入文件
1 显示“读入文件”对话框 菜单“File | Patterns...”打开一个读入文件的对话框。 工具“ ”具有同样的功能:
菜单“File|Thumbnail…”则以另一种方式显示这个对话框:
还有其它方式读入文件,在“File”菜单或工具栏中。 2 读入文件的参数设置 (1)选择文件(仪器类型)格式。 Jade 可读取的数据类型很多,如: MDI ASCii Pattern Files(*.mdi) JADE 的默认数据格式,也是一种通用的纯文本格式,被很 多其它软件所使用。第一次进入 JADE,所见到的就是这种文件,另外,JADE 也附带了很 多这种类型的文件作为学习的实例,这些文件保存在 JADE\demofiles 文件夹下。 RINT-2000 Binary pattern files(*,raw) 日本理学仪器数据二进制格式。 Jade import ascii pattern files(*.TXT) 通用文本格式,这种格式的文件可由 Jade 产生,也 可读入到 Jade 中。 如果不知道文件类型,或者不愿意选择文件类型,可选文件类型为“*.*”。
Windows mobile操作指南,使用技巧及常见问题解答

操作指南与使用技巧(汇总)基本设置830恢复出厂设置:“开始/设置/系统/清除内存”。
(在恢复出厂设置前,先备份联系人及相关数据。
注:“我的设备”根目录下,pim:联系人)字体大小的选择686:1.点击“联系人(或“今日”桌面上的“约会/任务”)”2.点击“工具/选项”,勾选“使用大字体”,OK。
696:点击“开始/设置/系统/调整屏幕/文字大小”830:“开始/设置/系统/调整屏幕/文字大小”“今日”屏幕显示内容的选择点击“开始/设置/个人/今日/项目”,勾选相应的内容将出现在“今日”屏幕上。
如何实现一键回到桌面/今日的程序?开始/设置/个人/按键/程序按键,选择一个按键,在下面的“分配程序”中选定“今日”命令就行。
开始菜单的选择点击“开始/设置/个人/菜单”,勾选相应的内容将显示在“开始”菜单中,最多可选7个。
取消按键点击时声音点击“开始/设置/个人/声音和提醒”,取消“事件(警告,系统事件)”的勾选。
取消屏幕“对设备锁定”:“开始/设置/个人/今日/项目/电话锁定”锁定的设置及取消:“开始/设置/个人/锁定”设定所在地的电话区号696:打开“联系人/工具/选项”,将区号进行修改。
830:打开“联系人/菜单/选项/区号”背景灯调节:“开始/设置/系统/背景灯/亮度”,另外,点击“电池电源”调节电源关闭时间。
设备关闭时间:“开始/设置/系统/电源/高级”如何才能在今日桌面上的日期项目中加上星期显示?依次打开桌面的开始菜单—设置—系统—区域设置—日期,在长日期项目中选择dddd yyyy MM dd或者dddd yyyy’年’M’月’d’日’,返回到今日桌面你就可以看到完整的星期、年、月、日显示。
编辑常用短语:“开始/信息”,点击右下角“菜单/切换帐户”,选择“短信”,点击“新建”,将光标移到正文处,选右下角“菜单/常用短语/编辑常用短语”,点击右下拉条,在空白处点击,然后编辑。
希望拍照时没有“喀嚓”声,怎么办?。
WinMDI简体中文使用手册
WinMDI简体中文使用手册1、概述虽然大部分FACScan用户喜欢苹果计算机的优质绘图,但由于大多数细胞仪为公共仪器,在仪器使用高峰期,用户往往没办法预约到足够时间来上机分析样品,同时分析实验数据。
为了缓和上述问题,我们建议上机分析样品时将样品存放至IBM-PC 兼容之媒体(U盘或光盘),再携至自己实验室之个人计算机,用WinMDI软件进行离机分析。
WinMDI是一个在IBM-PC 窗口环境下运作的共享程序,由Dr. Joseph Trotter 所设计,放在美国圣地亚哥the Scripps Research Institute (/software.html)的网站上,供各国流式细胞仪用户下载使用。
WinMDI适用于分析由本公司流式细胞仪所产生的数据档案,新型的苹果计算机的数据文件,可直接执行分析,计算机升级前之HP 系统的数据文件,亦可转换成PC兼容格式,在利用WinMDI程序进行分析、统计。
WinMDI 程序提供使用者双色或多色分析功能,除了可以制作一维直方图、二维点图、密度图、等高线图、及三度空间图谱外,可作文字处理之中间插图,亦可将各类图谱或统计资料输出至其它相关PC 程序,如MS WORD, PowerPoint, Excel, LOTUS 123,适用于论文发表,及会议报告使用。
程序全名: Windows Multiple Document Interface For Flow Cytometry, Version 2.82、范例练习2.1 WinMDI的运行程序安装完成后,程序集中应有WinMDI的ICONs,可点击WinMDI 2.8来运行WinMDI。
运行程序:开始→程序集→WinMDI→WinMDI 2.82.2二维点图之数据分析程序以WinMDI Display对话方框来开始,我们先来显示一个二维散点图。
1.在WinMDI Display对话方框中选择Dotplot,点击OK。
WinMDI使用指南
WinMDI使⽤指南Introduction to WinMDI 2.8 (J. Trotter 1993-1998)for the Analysis ofFlow Cytometry Listmode Data FilesObjectives of this tutorial:-Open a listmode data file-Create histograms (single, dual, and 3D histograms)-Perform gating-Perform original analysis-Display statisticsGérald GREGORI, Ph.D.Kathy RAGHEB, M.T.(A.S.C.P.)J. Paul ROBINSON, Ph.D.Purdue University Cytometry LaboratoriesHansen Life Sciences Research Building, B050201 S. University Street,West Lafayette, IN 47907-2064,USAe-mail: gregori@/doc/8022366aaf1ffc4ffe47ac1e.html /doc/8022366aaf1ffc4ffe47ac1e.htmlContentsI. How to Install WinMDI 2.8 (1)II. How to Start WinMDI 2.8 (1)III. How to Create a Single-parameter Histogram (3)IV. How to Create Histogram Overlay (5)V. How to Create a Dual-parameter Histogram (6)1. How to create a dotplot (6)2. How to create a Density plot or a Contour Plot (8)3. How to create a 3-dimensional display (10)4. How to change the parameter labels and font (11)5. How to display a title or write annotations on a graph (11)VI. Zoom (12)VII. How to Create and Display Several Graphs on the Screen (13)VIII. Regions and Gates (14)1. Create a region on a 1-parameter histogram (15)2. Create a region on a 2-parameter histogram (16)3. How to create a quadrant (17)4. How to delete, move, or adjust a region (18)5. Create gates (19)IX. Convert a FCS file to a text file (20)1. Convert a data file (20)2. Only convert the data from a gated region (20)X. Display Statistics (21)XI. Work with a Batch File (22)XII. Overview (23)What we like (23)What we dislike (24)Quick Start in 10 steps (25)1. To start WinMDI2.8 (25)2. To display a 2-parameter histogram (25)3. To create a 3D plot (25)4. To rotate a 3D graph (26)5. To display a new single-parameter histogram (26)6. To create a region (26)7. To create gates (27)8. To display statistics (27)9. To create histogram overlay (28)10. To create 3D view of histograms (28)I. How to Install WinMDI 2.8The Windows Multiple Document Interface software (WinMDI) is freeware designed by J. Trotter (1993-1998;trotter@/doc/8022366aaf1ffc4ffe47ac1e.html ) to analyze flow cytometric listmode data files. You can download it from the URL /doc/8022366aaf1ffc4ffe47ac1e.html /software.html or find it on any of the Purdue CD-Roms. To install WinMDI 2.8 on your computer, just click on the web page link corresponding to your office system (Windows 95/98/NT or Windows3.1/NT 3.x) and open (or save on your computer and install later) the corresponding wm28w95.exe or winmdi28.exe programs. Follow then the instructions.The minimum system requirements are:Processor: 486/33 + 387 fpu math chip or better with 8 megabytes memory.Recommended: 486/66 with 16MB RAM or betterMonitor: SVGA 800x600 or 1024x768 recommended.OS: MS DOS 5.0 or later + MS Windows 3.1 or later, Windows NT, Windows XP, or OS/2Windows 3.1: Use Microsoft's SMARTDrive or other disk cache program.Hint!I SUGGEST THAT YOU USE LISTMODE DATA FILES WITH 8.3 FORMAT FILE NAMES.II. How to Start WinMDI 2.8To start WinMDI just click on the WinMDI icon on the desktop, or use Start ?Programs ? WinMDI ? WinMDI.exe. The following screen is displayed.With WinMDI 2.8 it is possible to create single-parameter histograms, dual-parameters histograms (also called cytograms), and even 3D histograms. The WinMDI Display dialog window offers 4 different graph styles (see figures below):plotDotHistogramplotContourplotDensity-Histogram: displays one or more parameters as a frequency distribution (256 or 1024 channels).-Dotplot: displays correlated data from any two parameters at a 256x256 resolution. Each dot corresponds to an event analyzed by the flow cytometer.Of course, several events can occupy the same dot if they have the sameparameter intensities.-Density plot: displays two parameters as a frequency distribution. Color is used to code the different frequencies of events.-Contour plot: like a dotplot, a contour plot displays correlated data from any two parameters, with contour lines joining points of equal elevation(frequency distribution).III. How to Create a Single-parameter HistogramFrom the WinMDI Display dialog window select the “Histogram” style and click the OK button. A new window allows you to navigate to the sample folder where the listmode data file to analyze is recorded.When the file is selected, press OK. The Select Parameters dialog window appears for selection of the parameter to display.Using the scrolling bar, select the parameter you want to display (FS: forward-angle light scatter; SS: right-angle light scatter; Fl1, Fl2, …, Fln: the first, second, and n th fluorescence recorded by the cytometer). Click the “Read” button to display the corresponding histogram.All the parameters are automatically recorded within each listmode data file. You do not need to type them in the software. Hint!S OMETIMES W IN MDI DOES NOT AUTOMATICALLY RECOGNIZE WHICH AMPLIFICATION IS USED (L INEAR OR L OGARITHMIC).Y OU NEED TO SPECIFY THE SCALE BY SELECTING T OOLS ?S ET L IN L OG TO OPEN THE L IN/L OG V ARIABLES DIALOG WINDOW.T HEN CHECK THE CORRESPONDING SCALE FOR EACH PARAMETER.Very often it is necessary to change the position of the histogram and optimize the size by stretching its different borders and/or corners.In the Select Parameters dialog window scroll bar, the “Show All Parameters” option generates a single graph in which all the histograms of all the different parameters are plotted together. If you click on the graph and select “Format” in the popup menu the Format Histogram dialog window is displayed (see below).Among the available options you can, for instance:Set the color of each histogram. Just select the corresponding histogram name and select the color (scroll menu). You can fill the histograms withtheir respective color (check the “Solid Fill” check box) or leave themempty (uncheck the box).Rescale the histograms by changing the “Y Scale” value.Change the thickness of the lines (change the “Line Width” option);Display all the histograms in black & white (check the “B+W” check box).Display all the histogram in 3 dimensions (check the “3D View” check box).Smooth the histograms.Set up a logarithmic scale for the vertical axis.Insert a title (see the “Title” scroll menu).IV. How to Create Histogram OverlayYou can create a histogram overlay using WinMDI 2.8 (see figure below).To create the overlay:1.Create a single-parameter histogram from a listmode data file: open thedata file by clicking File? Open File, then navigate to the file and press OK.Click on the “Histogram” style, and select a parameter. Click on the “Read”button to display the graph.2.In the same way, open a new data file, click on the “Histogram” style,select the same parameter as previously, but click on the “Overlay” button to create the overlay (not the “Read” button). The histogram will be plotted on top of the previous one.You can overlay up to 12 histogram parameters on the same graph. You can also change the color of the different histograms using the Format Overlay dialogue window (click on the graph and select “Format” in the popup menu. The “Histogram Control” box is for making changes to the original, or first histogram. The “Overlays” box is for making changes to the histograms overlaid on top of the original histogram.V. How to Create a Dual-parameter HistogramIf you decide to plot first a dual-parameter histogram, you need to choose which style of plot you want to draw from the three different styles displayed in the WinMDI Display dialog window: a dotplot, a density plot, or a contour plot.1. How to create a dotplotSelect the “Dotplot” option in the WinMDI Display window and click the OK button. In the Open Dotplot window navigate in the folders and select the listmode data file you want to analyze. Press the OK button. The following window appears on the screen:Different options are displayed in order to create the dotplot.The name of the listmode data file is automatically displayed at the top of the window.Just below the filename, the user can select which parameter to display on the x axis and which one on the y axis. When selected, these two parametersappear in the “Parameter” box. To the right of this box, the “Amplifier/Scale”box display different possible scales for the axes. Select the first parameter(ex: FS on the previous figure) and then select the corresponding scale. Select“Linear” if this parameter has been recorded in linear mode. If this parameterhas been recorded in logarithmic scale, then select the number of decadescorresponding to the flow cytometer protocol setup (3 or 4 decades). Repeatall these steps for the second parameter.In the “Plot Number of Events” area, different options are available in order to display 2000 events only, or half, three quarters or all the events recorded.You can also set a specific number of events (type the value).In the “Draw Option” area are 6 check boxes. The first three are related to kinetics analyses where the intensity of one or several parameters is monitoredwith the time.The “Show XY Labels” check box needs to be checked in order to label theaxes.The “Color 2D Regions” check box needs to be checked to color the eventsgated on a histogram. Gating and coloring events can be used simultaneouslyin order to localize on one or several histograms the events gated in anotherhistogram. For more detail see VII. Regions and Gates.The “Log Grid 3D” check box is dedicated to histograms displaying three parameters at the same time. If this box is checked, a grid is applied on thedifferent axes to underline the logarithmic scale. Of course this grid concernsonly parameters acquired in the logarithmic scale.Six buttons are also available on the “Format Dotplot” window.Click the “OK” button to close the window when all the desired options have been selected.The “Cancel” button closes the “Format Dotplot” window without taking into account the selected options.The “Gates” button opens the Gate List dialog box in order to handle regions or gates (see VII. Regions and Gates).The “New File” button allows you to change the listmode data file to work with.The “3D Plot” is used to convert the current dual-parameter histogram into a 3-dimensional histogram. When this button is clicked the Select xyz dialog window appears. You can choose the three parameters to display. To select a parameter either double-click on it or select it and press the “>>” button. When a parameter is selected it islisted in the right X, Y, and Z Parameters box. To remove or change one or all the parameters click the “Reset” button. When the three parameters are selected press the “OK button.”The “Abort” button aborts the 3D transformation.The “Help” button opens the WinMDI 2.8 help.2. How to create a Density plot or a Contour PlotThese graphs are very useful to identify the borders between several close clusters. In the WinMDI Display dialog windows select the “Density Plot” or “Contour Plot” option and click the OK button.In the new Open Dotplot dialog window, navigate in the folders and select the listmode data file you want to analyze. Press the OK button.Whatever option is selected, the Format 2D Display dialog window appears on the screen. In fact it is not exactly the same window. Indeed, there is one difference: the “Density Plot” check box is checked only in the case of a density plot (see figure below). Later on, it is possible to shift from the density plot to the contour plot just by checking this box or not.Contour Plot:Density Plot:The Format 2D Display dialog window displays several pieces of information on the graph.The name of the listmode data file is automatically displayed in the topleft corner.You can choose which parameters to display (X and Y parameters), thetype of amplification (linear, or logarithmic), and the resolution.Check the “Density Plot” check box to draw a density plot histogram.Check “Label Axes” in order to label the two axes.The “Color” check box is used to display the different densities of eventsaccording to a color code set up automatically (check the “Calculate Colors”check box) or by the user (uncheck the “Calculate Colors” check box andchoose a color through the “Display Colors” menu).Hint!I SUGGEST THAT YOU LET THE SOFTWARE HANDLE THE COLOR CALCULATION AND THE DIFFERENT OPTIONS DISPLAYED ON THE RIGHT OF THE WINDOW (C ONTOUR).L ATER ON, IT IS ALWAYS POSSIBLE TO CALL UP THIS WINDOW AND CHANGE SOME OPTIONS IN ORDER TO SMOOTH THE DENSITY OR THE CONTOUR LINES, TO SET UP A THRESHOLD, TO CHANGE THE THICKNESS OF THE LINES, TO SELECT ANOTHER ALGORITHM TO SET UPTHE CONTOUR OR DENSITY PLOT, ETC.Hint!I T IS ALSO POSSIBLE TO CREATE A 3D HISTOGRAM BY CHECKING THE “S HOW 3D D ISPLAY” CHECK BOX.T HE DENSITY OF EVENTS WILL BE PLOTTED ON THE THIRD AXIS.I T IS THEN POSSIBLE TO COLOR ON THIS 3D HISTOGRAM THE EVENTS WHICH WOULD HAVE BEEN GATED ON THE 2D HISTOGRAM BY CHECKING THE “U SE R EGION C OLORS” CHECK BOX.I T IS POSSIBLE TO CHOOSE THE COLOR USING THE “S ET 3D F ILL C OLOR”MENU.I T IS ALSO POSSIBLE TO CHANGE THE ORIENTATION OF THE 3D DISPLAY BY CHANGING THE “R OTATION” ANGLE AND/OR THE “T ILT” AND “D ISTANCE” VALUES.Five buttons are also available on the Format 2D Display dialog window.- Click the “OK” button to close this window and display the graph when all the desired options have been selected.- Click the “Cancel” button to close the dialog window without taking into account the last changes.- The “Gates” button opens the “Gate List” dialog box and defines the regions or gates (see VII. Regions and Gates).- Click the “New File” button to select another listmode data file.- The “Help” button opens the WinMDI help file.3. How to create a 3-dimensional displayIt is possible to transform any histogram, dot plot, density plot, or contour plot into a 3D graph displaying three different parameters. A left click anywhere on the graph shows a new menu. A left click on the “Format” option opens the Histogram Format, Dot Plot Format, or Format 2D Display dialog window respectively for a histogram, a dot plot, or a density (or contour) plot. To display the 3D graph just check the “3D view” or “Show 3D Display” check box and press OK, or press the “3D Plot” button. These steps are reversible and it is thus possible to come back to a 2D graph.It is possible to change the orientation of the 3D graph using the mouse. Just press the Ctrl key on your keyboard and at the same time click the mouse on the graph. The graph changes and displays then only an empty cube without any labeling (see below).Just keep clicking the Ctrl key and the left mouse button and drag the mouse to change the orientation of the graph. When the desired orientation is reached, release the mouse button to display the graph.4. How to change the parameter labels and fontWinMDI automatically labels the axes of the graphs. The default labels are those recorded in the listmode data file. To set new label(s), select in the tool bar Tool ?Parameter Labels (or press Alt+L) to open a dialog window. Type the new label(s), check the “Use these instead of file labels” check box, and press the OK button.To change the font press F8 or select in the tool bar Window ? Set Defaults ?Font.Select the font, the style, the size, the effects, and the color. Click the OK button.5. How to display a title or write annotations on a graphYou can write a title on each graph and add comments. Select in the tool bar Tools ? Annotate (or press Alt+A) to open the Annotation dialog window. Type the text or the title in the “Text” box. Choose the font, size, and style and press the OK button. Then move the mouse cursor and click with the left mouse button where you want to display the text.You can move, modify or delete the annotation at any time.- To move the text: just click on it and drag it.- To modify the text: keeping the “shift” key pressed, double click on theannotation then type the new text and press “Enter”.- To delete an annotation or a title: keeping the “shift” key pressed, doubleclick on the annotation to select it and press the “Delete” key.VI. ZoomIt is possible to magnify a particular area on any plot:-Click with the right-button of the mouse on the plot of your choice and move the mouse in order to define the area to zoom in.-Click with the left button of the mouse within the defined area. In the pop up menu click on Zoom.To unzoom, click with the left button of the mouse anywhere in the plot and in the pop up menu select Unzoom.Zooming and unzoming can be performed several times on the same plot.VII. How to Create and Display Several Graphs on the ScreenTo create a new graph once the first graph has been displayed, select in the tool bar the “Display” button and choose which type of graph you want to draw. Then repeat the previous steps to select the listmode data file to open and to define the settings of the graph.When all the graphs are displayed, it is possible to resize them, to move them one by one, or to reorganize them automatically using the Windows button in the tool bar.The Windows ? Cascade option superimposes the different graphs on top of each other and only the first one is visible. The Windows ? Tile option shares the screen between the different graphs which are thus all visible.R1 R2Several other options also allow the user to Minimize All, Restore All, and Close All graphs.Hint!T O CREATE A NEW GRAPH WHEN ALL THE PREVIOUS GRAPHS ARE CLOSED, CLICK F ILE ?O PEN F ILE, CHOOSE THE TYPE OF GRAPH TO DISPLAY, AND THEN NAVIGATE TO THE FILE TO OPEN.VIII. Regions and GatesNow that you’ve learned how to open a listmode data file and display the main graphs, you need to learn how to create regions and gates. A region can be defined as set of points carefully selected by the user that determine an area on a graph. One or several regions can be defined on the same graph (see Figure below).The regions have to be distinguished from the gates. Gates are Boolean expressions containing one or several regions. So a gate can be equal to a region, but this is not always the case.The regions are used to compute statistics for the subset of events selected by the user in a peculiar histogram. Moreover, this cluster can then be gated and its events colored on the other graphs.WinMDI offers 4 different region styles. The “Histogram” region can be drawn only on a one-parameter histogram plot. The three other styles (“Polygon,” “SortRect,” and “Ellipse”) can be applied to any two-parameter graph.No region can be directly drawn on 3D graphs.1. Create a region on a 1-parameter histogramTo create a “Histogram” region click the left mouse button on the histogram graph where you want to draw the region. A popup menu will appear. Select “Regions” to open the 2D Regions Tool dialog window. Sixteen regions from R1 to R16 (R means region) are then listed with different colors. The events contained in a region will be colored. To change the color, click on the color and select another one. Select the “Histogram” region style (it should already be selected). Click the “Create” button. The Set Region Tool dialog window appears. On the histogram click with the left mouse button where you want to set up the lower (left) limit of your region. Then click with the right mouse button where you want to set up the upper (right) limit of the region. You have just created a marker (labeled from M1 to M8).The lower and upper limits are displayed on the Set Region Tool dialog window. To transform a marker into a region (labeled R + a number) just press the “Create Region from Current Marker” button. To erase the marker just double-click with the right mouse button on it.You can create other regions on the same histogram by creating a second marker. Just change the marker index and create a new marker on the histogram. Create a second region from this second marker. You can create up to 8 different markers or regions on the same histogram.Hint!Y OU CAN ALSO GENERATE MARKERS WITHOUT GENERATING A REGION TO GET STATISTICS, BUT IN THAT CASE THE EVENTS CANNOT BE GATED ON THE OTHER GRAPHS.T O CREATE A MARKER JUST CLICK THE LEFT MOUSE BUTTON ON THE HISTOGRAM AND SELECT “M ARKERS” IN THE POPUP MENU.T HEN PLACE THE LOWER AND UPPER LIMITS OF THE MARKER AS PREVIOUSLY DESCRIBED.2. Create a region on a 2-parameter histogramOn a 2-parameter histogram you can draw three different region styles. Click the left mouse button on the graph where you want to draw the region. A popup menu appears. Select “Regions” to open the 2D Regions Tool dialog window. Select the region style: Polygon, SortRect, or Ellipse (see figure below).Polygon Style SortRect and Ellipse StylePolygon StyleThe polygon style allows you to draw a polygonal region. Click on the graph where you want to start your region. You just defined the first point in the region. If you release the mouse button and move the mouse to a different position you will see a segment connecting the first point to your mouse pointer. Click to set up the second point in the region. Continue to move the mouse and click when you want to define a new point in the region. To close the region, you need to click on the first point.SortRect and Ellipse StylesThe SortRect style allows you to draw a rectangular (or square) region. Click on the graph where you want to set the upper left corner of the region. Then keep the left mouse button pressed and move the mouse to draw the region. The region appears as a dashed line. When the region is correctly drawn, release the mouse button.The ellipse style allows you to draw an elliptical (or circular) region. To draw such a region just processed as for the rectangular region.3. How to create a quadrantA quadrant can be used only in bivariate displays. Quadrant divides a graph into 4 regions: upper left (labeled UL), upper right (UR), lower left (LL) and lower right (LR).To create a quadrant, click on a graph and select “Quadrant” in the popup menu. The 4 regions are displayed. To adjust the size and the localization of the regions you Click here to select and move the quadrant。
MDI JADE 中文使用手册-黄老师
读入文件
读入文件
1 显示“读入文件”对话框 菜单“File | Patterns...”打开一个读入文件的对话框。 工具“ ”具有同样的功能:
菜单“File|Thumbnail…”则以另一种方式显示这个对话框:
还有其它方式读入文件,在“File”菜单或工具栏中。 2 读入文件的参数设置 (1)选择文件(仪器类型)格式。 Jade 可读取的数据类型很多,如: MDI ASCii Pattern Files(*.mdi) JADE 的默认数据格式,也是一种通用的纯文本格式,被很 多其它软件所使用。第一次进入 JADE,所见到的就是这种文件,另外,JADE 也附带了很 多这种类型的文件作为学习的实例,这些文件保存在 JADE\demofiles 文件夹下。 RINT-2000 Binary pattern files(*,raw) 日本理学仪器数据二进制格式。 Jade import ascii pattern files(*.TXT) 通用文本格式,这种格式的文件可由 Jade 产生,也 可读入到 Jade 中。 如果不知道文件类型,或者不愿意选择文件类型,可选文件类型为“*.*”。
本手册编写之目的,是为了培养大材料学科之学生的实验动手能力、科研参与能 力、数据处理能力、对现代衍射仪实验方法的理解和运用能力。因此,文中多以 材料研究中的实际问题为例。
本手册完全凭个人使用经验编写,文中的表达方法、遣词用句完全凭个人喜好。
由于 Jade 版本不同,操作界面也有不同,某些功能在低版本中无法看到,而低 版本中的某些功能不知什么原因被删除。无法全部顾及,编写时主要参照了 MDI Jade 5.0 版和 6.5 版。因此,文中图片可能是前者也可能是后者中的截图,使用 时注意。
MDI Jade 使用手册
DWIN TFT HMI 4.3英寸显示终端说明书
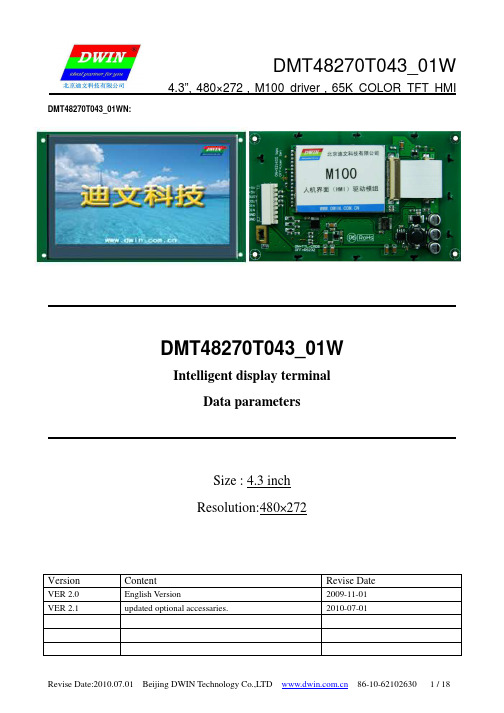
DMT48270T043_01W
4.3”,480×272,M100 driver,65K COLOR TFT HMI
DMT48270T043_01W
Intelligent display terminal Data parameters
Size : 4.3 inch Resolution:480×272
Interface operation
All the interfaces are based on the operation to the pictures which can shorten your time and save you cost.
Multi-controller option
DMT48270T043_01W
4.3”,480×272,M100 driver,65K COLOR TFT HMI
DWIN TFT HMI MODULE FULFILL YOUR DREAMS
THE FULL RANGE OF PRODUCTS: BASIC TYPE、STANDARD TYPE、ENHANCED TYPE To meet the working Environments of your industry
64 levels.
Contrast Ratio
Reaction time(ms)
viewing angle(L/R/U/D)
Screen Mode
Digital
Note[1]: 1.Modules can work in the 90°pattern rotation after software modification.(272*480). 2.viewing angle is also modificable to 6 o’clock or 12 o’clock position.( Required in ordering instructions)。
PowerLite Pro Z9900WNL 3LCD 3-chip 项目器说明书
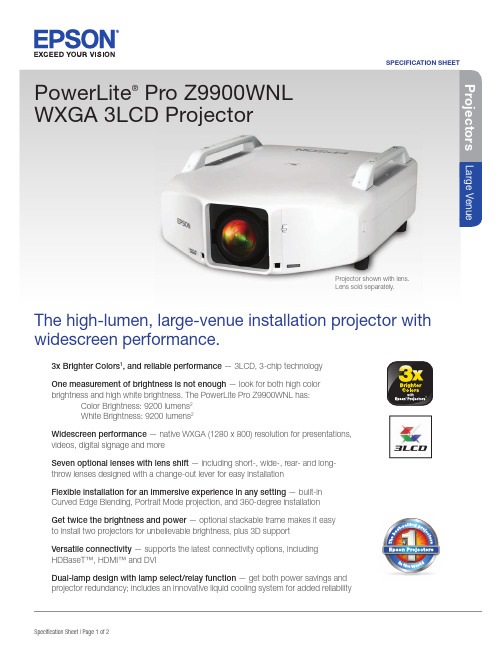
Large VenueSPECIFICATION SHEET3x Brighter Colors 1, and reliable performance — 3LCD, 3-chip technology One measurement of brightness is not enough — look for both high color brightness and high white brightness. The PowerLite Pro Z9900WNL has:Color Brightness: 9200 lumens 2White Brightness: 9200 lumens 2Widescreen performance — native WXGA (1280 x 800) resolution for presentations, videos, digital signage and moreSeven optional lenses with lens shift — including short-, wide-, rear- and long-throw lenses designed with a change-out lever for easy installationFlexible installation for an immersive experience in any setting — built-in Curved Edge Blending, Portrait Mode projection, and 360-degree installation Get twice the brightness and power — optional stackable frame makes it easy to install two projectors for unbelievable brightness, plus 3D support Versatile connectivity — supports the latest connectivity options, including HDBaseT™, HDMI™ and DVIDual-lamp design with lamp select/relay function — get both power savings and projector redundancy; includes an innovative liquid cooling system for added reliabilityPowerLite ®Pro Z9900WNL WXGA 3LCD ProjectorThe high-lumen, large-venue installation projector withwidescreen performance.Projector shown with lens.Lens sold separately.Large VenuePowerLite ® Pro Z9900WNL WXGA 3LCD ProjectorEPSON, EasyMP and PowerLite are registered trademarks, EPSON Exceed Your Vision is a registered logomark and Better Products for a Better Future is a trademark of Seiko Epson Corporation. PrivateLine is a registered trademark, FineFrame is a trademark and Epson Connection is a service mark of Epson America, Inc. SmartWay is a service mark of the U.S. Environmental Protection Agency. All other product and brand names are trademarks and/or registered trademarks of their respective companies. Epson disclaims any and all rights in these marks. Copyright 2014 Epson America, Inc. Com-SS-Oct-13 CPD-41395 6/14 Epson America, Inc.3840 Kilroy Airport Way, Long Beach, CA 90806Epson Canada Limited185 Renfrew Drive, Markham, Ontario L3R 6G3 www.epson.caInterfacesWireless LAN port: 802.11 b/g/n (optional – module sold separately)SpecificationsProjection System High-aperture Epson ®3-chip, 3LCD technologyProjection Method Front/rear/ceiling mountLCD Driving Method Epson Poly-silicon TFT Active Matrix Pixel Number 2,304,000 pixels x 3LCDs Color Brightness 2Color Light Output: 9200 lumens White Brightness 2White Light Output: 9200 lumensAspect Ratio Native 16:10, (supports 4:3, 16:9, 5:4)Native Resolution WXGA (1280 x 800)Contrast Ratio (Normal, Dynamic Mode) Up to 15,000:1Color Reproduction 1.07 billion colors Lamp TypeNormal:380 W x 2 UHE Portrait:304 W x 2 UHE Lamp Life 3Normal:Up to 4000 hours (ECO Mode)Up to 2500 hours (Normal Mode)Portrait:Up to 1000 hours (Normal Mode)Brightness Uniformity (typical) 90%Pixel Arrangement Cross stripeProjection LensScreen Throw Ratio Range 1.74 – 2.82 (standard lens)Size (projected distance) 60" – 500"Type Powered zoom/focusF-number 1.65 – 2.51 (standard lens), lens not included Focal Length 36 mm – 57.35 mm (standard lens)Zoom Ratio Optical zoom 1 – 1.61 (standard lens)Lens Shift (powered)Vertical: ±60%Horizontal: ±18%Keystone CorrectionVertical: -30 degrees to +30 degrees Horizontal: -30 degrees to +30 degreesVideoVideo StandardsAnalog: NTSC/NTSC4.43/PAL/M-PAL/N-PAL/PAL60/SECAM HDMI: 480i/576i/480p/576p/720p/1080i/1080p DVI-D: 480i/576i/480p/576p/720p/1080i/1080pVideo Processing 3D Y/C separation, 3D noise reduction, mosquito noise reductionDCDi ® – Directional Correlational DeinterlacingMotion-compensated Interlace-Progressive conversion (2:2, 3:2 film detection)Super ResolutionFineFrame™ interpolation 8:8 Pull-down processing Closed captioningNetworkingConnectivityWired: Integrated 100 MbpsWireless Security: WPA-PSK (TKIP/AES) / WPA2-PSK (TKIP/AES)E-mail Notification Via network Message Broadcasting SNMP Web Control Secure HTTPRemote Control and ManagementEasyMP ® Monitor, network projection, multi-projection, AMX ® Device Discovery, Crestron ® Integrated Partner and Crestron RoomView ®, Extron ® IP Link and XTP , PJLinkOther FeaturesOperating Temperature32 ° to 122 °F (0 ° to 50 °C) — Normal32 ° to 104 °F (0 ° to 40 °C) — Above 4900 feetPower Supply Voltage 100 – 240 V ±10%, 50/60 Hz AC Power Consumption 821 W (ECO Mode)995 W (Normal Mode)2.7 W standby (Communication on)0.26 W standby (Communication off)Fan Noise35 dB (ECO Mode)38 dB (Normal Mode)Security Kensington ®-style lock provision, anchor (metal) bar for security lock or cable, handles attached to body for cable wrapDimensions (W x D x H)Including Feet (with standard lens) 29.17" x 21.01" x 10.04"Excluding Feet (with standard lens) 29.17" x 21.02" x 7.76"Weight 58 lb with standard lensRemote ControlFeatures Brightness, contrast, tint, saturation, sharpness, input signal, sync, tracking, position, zoom, focus, lens shift, shutter, ID, source search, split screen Operating AngleFront:Right/left ± 60 degreesUpper/lower -45 to +15 degrees Rear:Right/left ± 60 degreesUpper/lower -40 to +15 degrees Operating Distance 98 ftECO FeaturesRoHS compliant Recyclable product 4Epson America, Inc. is a SmartWay SM Transport Partner 5SupportThe Epson Connection SMPre-sales support U.S. and Canada 800-463-7766Internet website Projector ProgramsThree-year projector limited warranty, 90-day limited lamp warranty, Epson Road Service Program and PrivateLine ®dedicated toll-free support (U.S. and Canada only)What’s in the BoxPowerLite Pro Z9900WNL projector, power cable, computer cable, projector remote control, batteries, user manual CD, Quick Setup Sheet, monitor and control CDOrdering Information Product Name Product Code PowerLite Pro Z9900WNL projectorV11H609920AccessoriesProduct CodeStandard zoom lens (ELPLS04) V12H004S04Long-throw zoom lens (ELPLL07)V12H004L07Middle-throw zoom lens 1 (ELPLM06)V12H004M06Middle-throw zoom lens 2 (ELPLM07)V12H004M07Rear-projection wide lens (ELPLR04)V12H004R04Wide zoom lens (ELPLW04)V12H004W04Short-throw zoom lens (ELPLU02) V12H004U02Mount Installation frame (ELPMB44) V12H681010Flush ceiling mount bracketV12H003B25Mount bracket with extended pipe V12H003B26False ceiling plate kit ELPMBP02Wireless LAN module V12H418P12Kensington security lockELPSL01Hardware remote control cable set V12H005C28Replacement remote control2157388Replacement lamp single (ELPLP81)V13H010L81Dual lamp kit (lamp x 2) (ELPLP82)V13H010L82Replacement portrait lamp single (ELPLP83) V13H010L83Dual lamp kit (lamp x 2) (ELPLP84)V13H010L84Replacement air filter set (ELPAF46)V13H134A461Compared to leading 1-chip DLP business and education projectors based on NPD data, July 2011 through June 2012. Color brightness (color light output) measured in accordance with IDMS 15.4. Color brightness will vary depending on usage conditions.2Color brightness (color light output) and white brightness (white light output) will vary depending on usage conditions. Color light output measured in accordance with IDMS 15.4; white light output measured in accordance with ISO 21118.3Lamp life will vary depending upon mode selected, environmental conditions and usage. Lamp brightness decreases over time.4See our website for convenient and reasonable recycling options at /recycle5SmartWay is an innovative partnership of the U.S. Environmental Protection Agency that reduces greenhouse gases and other air pollutants and improves fuel ef ciency.LANDVI-DRS-232CHDBaseTHDMIVideoS-VideoComputer RemoteMonitor Out BNCServicePowerWireless LAN Port Name EmailPhone Number。
菜单命令
MedWinV3 菜单命令
查看
寄存器 命令:[查看|寄存器] 窗口:停驻类型窗口。 功能:激活/关闭寄存器窗口。
特殊功能寄存器 命令:[查看|特殊功能寄存器] 窗口:停驻类型窗口。 功能:激活/关闭特殊功能寄存器窗口。
反汇编窗口 命令:[查看|反汇编窗口] 窗口:标准多文档窗口。 功能:打开程序代码反汇编窗口。
终止运行。
设置断点计数器并运行 命令:[调试|设置断点计数器并运行] 热键:F11 功能:设置断点计数器并全速运行程序,如果重复遇到程序地址断点的次数与设定断点计数
器的次数相同,程序终止运行。
退出函数或子程序 命令:[调试|退出函数或子程序] 热键:F12 功能:全速运行程序到当前函数或程序返回。
执行到 命令:[调试|执行到]
关闭项目 命令:[项目管理|关闭] 功能:关闭当前打开的项目。
新建文件 命令:[项目管理|新建文件] 热键:Alt+F12 功能:新建文件,提供新建文件向导和编程模板。
添加文件 命令:[项目管理|添加] 功能:将被添加的文件路径加入项目文件。
导入文件 命令:[项目管理|导入] 功能:复制被导入的文件到当前项目,并将复制到当前项目的文件路径加入项目文件。
设置编译工具 命令:[设置|设置编译工具] 功能:汇编器、编译器、连接器和头文件、库文件路径设置。
设置通讯方式 命令:[设置|设置通讯方式] 功能:选择通讯方式。
设备驱动管理器 命令:[设置|设备驱动管理器] 功能:选择通讯方式。
观察窗口 命令:[查看|观察窗口] 窗口:停驻类型窗口。 功能:展开观察窗口二级菜单
程序窗口 命令:[查看|程序代码] 热键:Ctrl+3 窗口:停驻类型窗口。 功能:激活/关闭程序代码窗口。
- 1、下载文档前请自行甄别文档内容的完整性,平台不提供额外的编辑、内容补充、找答案等附加服务。
- 2、"仅部分预览"的文档,不可在线预览部分如存在完整性等问题,可反馈申请退款(可完整预览的文档不适用该条件!)。
- 3、如文档侵犯您的权益,请联系客服反馈,我们会尽快为您处理(人工客服工作时间:9:00-18:30)。
WinMDI 2.8
1.1 FACS101 1.ห้องสมุดไป่ตู้2. 3. 4. 5. 6. 7. 8. 9.
: WinMDI2.8 Setup Next Yes Next Next Next Typical Next Setup Complete Finish
WinMDI 2.8 Installation Software License Agreement Information User Information Installation Directory Setup Type Select Program Folder
WinMDI
1. WinMDI 2.8 Trotter WinMDI 2.8 Zip PC WinMDI 2.8 PC WinMDI PC MS WORD, PowerPoint, Excel, LOTUS 123 WinMDI PC WinMDI HP WinMDI PC Scripps Dr. Joseph
4.
FL1-H / FL2-H active pop-up Copy
BDB 5-6
5.
active
Edit
Paste
6. 7. active File Print Active
Excel
2.4 1. Norm001 2. Display OK FL2-H 256 Histogram
Select Parameter FL2-H
pop-up Excel
10.
Window
Increment All
Norm002 Test2.txt
11.
Stats-Histo Norm002
Test2.txt
Append
12.
Microsoft EXCEL
Test2.txt
BDB 5-8
13.
FL2-H
active
14. 15.
Window Norm001 FL2-H
3.
Gates
And [ ]
OK
4.
Read
BDB 5-7
5. 6. Tool 7.
FL2-H Tools Marker
active
8.
Marker Tool
Marker Index OK
2
Marker
9.
FL2-H Stats Save As
active marker Test2.txt OK Stats-Histo
BDB 5-1
2. WinMDI:/Datafile NORM001-012
WinMDI NORM001-4 SimulTEST CD CD : NORM005-8 NORM009-12 CD CD
FITC NORM001 NORM002 NORM003 NORM004 2.1 WinMDI WinMDI WinMDI WinMDI 2.2 WinMDI Display WinMDI 2.8 ICONs IgG1 Isotype Control CD3 CD3 CD3 CD19 CD4 CD8
pop-up Events Mean UL
Stats %Total Geometric UR
13. Test1.txt OK
Stats-Dotplot
Save As
BDB 5-5
14. 15. 16. 17. 18. 19. 20. 2.3 1.
FSC-H / SSC-H pop-up FL1-H / FL2-H Stats-Dotplot Norm002 Window Stats-Dotplot 17-18 Increment All Append Next Norm002
8.
Gates And [ ]
Gate List OK OK FL1-H / FL2-H
9.
Format Dotplot Norm001
10. 11.
Tools
Quadrant Tool
OK
BDB 5-4
12.
FL1-H / FL2-H File Name %Gated Mean LL UR Markers Marker Median CV Peak Value
Open File FL2-H 256 FL2-H FL2-H Display Format Overlay ( Read)
16. Format Overlay
2.5 1. 2. File Exit Yes.
BDB 5-9
active Norm002 Test1.txt Norm003 Norm003 Test1.txt Append
Microsoft EXCEL (Print Page) File Format Print Page
2.
FSC/ SSC Copy
active
Edit
3. active Paste Edit
YOK
Plot Number
(Region) 4. Tools Regions Tool SortRect ( Ellipse Polygon ) Creat
BDB 5-3
5. OK (Gate) 6. norm001 7. Y Display OK X FL2-H 256 FL2 All (6000) Plot Number of Events Color 2D Region FL1-H 256 FL1-H Dotplot
PE IgG2 Isotype Control
WinMDI 2.8
1.
WinMDI Display Dotplot OK
BDB 5-2
2.
C:/Datafile
norm001
OK
3.
FSC-H 256 FSC-H of Events NORM001 3/4 (4500)
X-
SSC-H 256 SSC-H Color 2D Region