统一建模语言UML之毕设管理系统
1.简述统一建模语言

简述统一建模语言
统一建模语言(UML):是一种用于对软件密集系统进行可视化建模的标准语言。
它始于1997年,被采纳为OMG标准,是一种非专利的第三代建模和规约语言。
UML独立于任何具体程序设计语言,是面向对象设计的建模工具。
UML为面向对象开发系统的产品进行说明、可视化和编制文档,展现了一系列最佳工程实践,这些实践在对大规模、复杂系统进行建模方面已经被验证有效。
UML可以贯穿软件开发周期中的每一个阶段,从需求分析到规格,到构造和配置。
UML表示法集中了不同的图形表示方法,剔除了其中容易引起的混淆、冗余或者很少使用的符号,同时添加了一些新的符号。
其中的概念来自于面向对象技术领域中众多专家的思想。
总的来说,UML作为一种模型语言,使开发人员专注于建立产品的模型和结构,而不是选用什么程序语言和算法实现。
当模型建立之后,模型可以被UML 工具转化成指定的程序语言代码。
毕业设计-基于UML建模的班级管理系统分析与设计

班级管理系统分析与设计摘要在日常的班级管理中,涉及到很多事务,班级管理人员(班委)经常需要组织各种班级活动,发布考试信息,班级上课考勤,及提交各种课程作业,及有事情需要通知某位同学等相当多的一些事务。
在目前的高校班级管理中,班级管理人员(班委)需要花费相当大的时间和精力来完成这些事情,而且不停地重复着大量的工作,但在已有的软件中很难找到一个精简实用高效的班级管理系统。
基于以上需求,我在查阅了班级管理相关资料并且咨询了班委以及辅导员后,选择开发基于WEB的高校班级管理系统。
根据课程设计要求,本系统使用UML建模方法完成班级管理这一具体业务紧密结合的信息系统的分析与设计,使用SQLServer2005存储数据,开发平台采用常见的JSP技术,用JDBC实现数据库访问交互。
一、UML建模1.1前期工作1.1.1业务概况基于WEB的高校班级管理系统主要服务与高校各院系的日常班级信息管理中,通过学生档案管理、学生成绩管理、班级任务管理、班级组织管理、班级费用管理、学生考勤管理以及用户管理等几个功能模块,利用发展迅速的高校校园网实现各班级信息的集中管理、分散操作和信息共享,使班级管理数字化、无纸化、智能化,为高校的班级管理打造一个新的网络信息管理平台。
1.1.2存在问题根据当前班级管理的实际情况,以下是经过与班委和辅导员交流后发现的问题:◆班主任与学生之间信息传递效率低。
◆班委们之间分工不明确,信息传递繁琐效率低。
◆班委劳动强度较大且大量重复,班委会开的较多。
◆学生信息不便于更新、查询和分析。
◆班委们容易忘事,工作落实不到位。
这些问题都不仅给班委们增加了很多麻烦,而且也不利于校园信息系统的升级和维护。
所以我将根据高校班级管理系统的特殊需求,以不同的方式来改进传统管理,开发适当的信息系统以解决以上提到的问题,提高班级管理的效率。
1.1.3业务目标通过对实际情况的调查、分析,对该问题领域的了解,最终在与班委们商讨后,根据实际业务需要,确定开发以广东工业大学为背景的高校班级管理系统,以达到如下目标:◆确保班级任务的有效实施。
什么是统一建模语言(UML)?

什么是统一建模语言(UML)?UML是统一建模语言的缩写,是一种标准化建模语言,由一组集成的图表组成,它开发来帮助系统和软件开发人员指定、可视化、构建和记录软件系统的工件,以及业务建模和其他非软件系统。
UML代表了在大型和复杂系统建模中已被证明是成功的最佳工程实践的集合。
UML是开发面向对象软件和软件开发过程中非常重要的一部分。
UML 主要使用图形符号来表示软件项目的设计。
使用UML帮助项目团队沟通,探索潜在的设计,并验证软件的体系结构设计。
在本文中,我们将向您详细介绍UML是什么、UML的历史以及每个UML图类型的描述,以及UML示例。
What is Unified Modeling Language (UML)?UML, short for Unified Modeling Langung of an integrated set of diagrams, developed to help system and software developers for specifying, visualizing, constructing, and documenting the artifacts of software systems, as well as for business modeling and other non-software systems. The UML represents a collection of best engineering practices that have proven successful in the modeling of large and complex systems. The UML is a very important part of developing object oriented software and the software development process. The UML uses mostly graphical notations to express the design of software projects. Using the UML helps project teams communicate, explore potential designs, and validate the architectural design of the software. In this article we will give you detailed ideas about what is UML, the history of UML and a description of each UML diagram type, along with UML examples.The Origin of UMLThe goal of UML is to provide a standard notation that can be used by all object-oriented methods and to select and integrate the best elements of precursor notations. UML has been designed for a broad range of applications. Hence, it provides constructs for a broad range of systems and activities (e.g., distributed systems, analysis, system design and deployment).UML is a notation that resulted from the unification of OMT from1.Object Modeling T echnique OMT [James Rumbaugh 1991] - was best for analysis and data-intensive information systems.2.Booch [Grady Booch 1994] - was excellent for design and implementation. Grady Booch had worked extensively with the Ada language, and had been a major player in the development of Object Oriented techniques for the language. Although the Booch method was strong, the notation was less well received (lots of cloud shapes dominated his models - not very tidy)3.OOSE (Object-Oriented Software Engineering [Ivar Jacobson 1992]) - featured a model known as Use Cases. Use Cases are a powerful technique for understanding the behaviour of an entire system (an area where OO has traditionally been weak).In 1994, Jim Rumbaugh, the creator of OMT, stunned the software world when he left General Electric and joined Grady Booch at Rational Corp. The aim of the partnership was to merge their ideas into a single, unified method (the working title for the method was indeed the "Unified Method").By 1995, the creator of OOSE, Ivar Jacobson, had also joined Rational, and his ideas (particularly the concept of "Use Cases")were fed into the new Unified Method - now called the Unified Modelling Language1. The team of Rumbaugh, Booch and Jacobson are affectionately known as the "Three Amigos"UML has also been influenced by other object-oriented notations:•Mellor and Shlaer [1998]•Coad and Yourdon [1995]•Wirfs-Brock [1990]•Martin and Odell [1992]UML also includes new concepts that were not present in other major methods at the time, such as extension mechanisms and a constraint language.History of UML1.During 1996, the first Request for Proposal (RFP) issued by the Object Management Group (OMG) provided the catalyst for these organizations to join forces around producing a joint RFP response.2.Rational established the UML Partners consortium with several organizations willing to dedicate resources to work toward a strong UML 1.0 definition. Those contributing most to the UML 1.0 definition included:o Digital Equipment Corpo HPo i-Logixo IntelliCorpo IBMo ICON Computingo MCI Systemhouseo Microsofto Oracleo Rational Softwareo TIo Unisys3.This collaboration produced UML 1.0, a modeling language that was well-defined, expressive, powerful, and generally applicable. This was submitted to the OMG in January 1997 as an initial RFP response.14.In January 1997 IBM, ObjecTime, Platinum Technology, Ptech, Taskon, Reich Technologies and Softeam also submitted separate RFP responses to the OMG. These companies joined the UML partners to contribute their ideas, and together the partners produced the revised UML 1.1 response. The focus of the UML 1.1 release was to improve the clarity of the UML 1.0 semantics and to incorporate contributions from the new partners. It was submitted to the OMG for their consideration and adopted in the fall of 1997.1 and enhanced 1.1 to 1.5, and subsequently to UML 2.1 from 01 to 06 (now the UML current version is 2.5)Why UMLAs the strategic value of software increases for many companies, the industry looks for techniques to automate the production of software and to improve quality and reduce cost and time-to-market. These techniques include componenttechnology, visual programming, patterns and frameworks. Businesses also seek techniques to manage the complexity of systems as they increase in scope and scale. In particular, they recognize the need to solve recurring architectural problems, such as physical distribution, concurrency, replication, security, load balancing and fault tolerance. Additionally, the development for the World Wide Web, while making some things simpler, has exacerbated these architectural problems. The Unified Modeling Language (UML) was designed to respond to these needs. The primary goals in the design of the UML summarize by Page-Jones in Fundamental Object-Oriented Design in UML as follows:1.Provide users with a ready-to-use, expressive visual modeling language so they can develop and exchange meaningful models.2.Provide extensibility and specialization mechanisms to extend the core concepts.3.Be independent of particular programming languages and development processes.4.Provide a formal basis for understanding the modeling language.5.Encourage the growth of the OO tools market.6.Support higher-level development concepts such as collaborations, frameworks, patterns and components.7.Integrate best practices.UML - An OverviewBefore we begin to look at the theory of the UML, we are going to take a very brief run through some of the major concepts of the UML.The first thing to notice about the UML is that there are a lot of different diagrams (models) to get used to. The reason for thisis that it is possible to look at a system from many different viewpoints. A software development will have many stakeholders playing a part.For Example:•Analysts•Designers•Coders•Testers•QA•The Customer•Technical AuthorsAll of these people are interested in different aspects of the system, and each of them require a different level of detail. For example, a coder needs to understand the design of the system and be able to convert the design to a low level code. By contrast, a technical writer is interested in the behavior of the system as a whole, and needs to understand how the product functions. The UML attempts to provide a language so expressive that all stakeholders can benefit from at least one UML diagram.Here's a quick look at each one of these 13 diagrams in as shown in the UML 2 Diagram Structure below:Structure diagrams show the static structure of the system and its parts on different abstraction and implementation levels and how they are related to each other. The elements in a structure diagram represent the meaningful concepts of a system, and may include abstract, real world and implementation concepts, there are seven types of structure diagram as follows:•Class Diagram•Component Diagram•Deployment Diagram•Object Diagram•Package Diagram•Composite Structure Diagram•Profile DiagramBehavior diagrams show the dynamic behavior of the objects in a system, which can be described as a series of changes to the system over time, there are seven types of behavior diagrams as follows:•Use Case Diagram•Activity Diagram•State Machine Diagram•Sequence Diagram•Communication Diagram•Interaction Overview Diagram•Timing DiagramWhat is a Class Diagram?The class diagram is a central modeling technique that runs through nearly all object-oriented methods. This diagram describes the types of objects in the system and various kinds of static relationships which exist between them.RelationshipsThere are three principal kinds of relationships which areimportant:1.Association - represent relationships between instances of types (a person works for a company, a company has a number of offices.2.Inheritance - the most obvious addition to ER diagrams for use in OO. It has an immediate correspondence to inheritance in OO design.3.Aggregation - Aggregation, a form of object composition in object-oriented design.Class Diagram ExampleWhat is Component Diagram?In the Unified Modeling Language, a component diagram depicts how components are wired together to form larger components or software systems. It illustrates the architectures of the software components and the dependencies between them. Those software components including run-time components, executable components also the source code components.Component Diagram ExampleWhat is a Deployment Diagram?The Deployment Diagram helps to model the physical aspect of an Object-Oriented software system. It is a structure diagram which shows architecture of the system as deployment (distribution) of software artifacts to deployment targets. Artifacts represent concrete elements in the physical world that are the result of a development process. It models the run-time configuration in a static view and visualizes the distribution of artifacts in an application. In most cases, it involves modeling the hardware configurations together with the software components that lived on.Deployment Diagram ExampleWhat is an Object Diagram?An object diagram is a graph of instances, including objects and data values. A static object diagram is an instance of a class diagram; it shows a snapshot of the detailed state of a system at a point in time. The difference is that a class diagram represents an abstract model consisting of classes and their relationships. However, an object diagram represents an instance at a particular moment, which is concrete in nature. The use of object diagrams is fairly limited, namely to show examples of data structure.Class Diagram vs Object Diagram - An ExampleSome people may find it difficult to understand the difference between a UML Class Diagram and a UML Object Diagram as they both comprise of named "rectangle blocks", with attributes in them, and with linkages in between, which make the two UML diagrams look similar. Some people may even think they are the same because in the UML tool they use both the notations for Class Diagram and Object Diagram are put inside the same diagram editor - Class Diagram.But in fact, Class Diagram and Object Diagram represent two different aspects of a code base. In this article, we will provide you with some ideas about these two UML diagrams, what they are, what are their differences and when to use each of them.Relationship between Class Diagram and Object Diagram You create "classes" when you are programming. For example, in an online banking system you may create classes like 'User', 'Account', 'Transaction', etc. In a classroom management system you may create classes like 'Teacher', 'Student', 'Assignment', etc. In each class, there are attributes and operations that represent the characteristic and behavior of the class. Class Diagram is a UML diagram where you can visualize those classes, along with their attributes, operations and theinter-relationship.UML Object Diagram shows how object instances in your system are interacting with each other at a particular state. It also represents the data values of those objects at that state. In other words, a UML Object Diagram can be seen as a representation of how classes (drawn in UML Class Diagram) are utilized at a particular state.If you are not a fan of those definition stuff, take a look at the following UML diagram examples. I believe that you will understand their differences in seconds.Class Diagram ExampleThe following Class Diagram example represents two classes - User and Attachment. A user can upload multiple attachment so the two classes are connected with an association, with 0..* as multiplicity on the Attachment side.Object Diagram ExampleThe following Object Diagram example shows you how the object instances of User and Attachment class "look like" at the moment Peter (i.e. the user) is trying to upload two attachments. So there are two Instance Specification for the two attachment objects to be uploaded.What is a Package Diagram?Package diagram is UML structure diagram which shows packages and dependencies between the packages. Modeldiagrams allow to show different views of a system, for example, as multi-layered (aka multi-tiered) application - multi-layered application model.Package Diagram ExampleWhat is a Composite Structure Diagram?Composite Structure Diagram is one of the new artifacts added to UML 2.0. A composite structure diagram is similar to a class diagram and is a kind of component diagram mainly used in modeling a system at micro point-of-view, but it depicts individual parts instead of whole classes. It is a type of static structure diagram that shows the internal structure of a class and the collaborations that this structure makes possible.This diagram can include internal parts, ports through which the parts interact with each other or through which instances of the class interact with the parts and with the outside world, and connectors between parts or ports. A composite structure is a set of interconnected elements that collaborate at runtime to achieve some purpose. Each element has some defined role in the collaboration.Composite Structure Diagram ExampleWhat is a Profile Diagram?A profile diagram enables you to create domain and platform specific stereotypes and define the relationships between them. You can create stereotypes by drawing stereotype shapes and relate them with composition or generalization through the resource-centric interface. You can also define and visualize tagged values of stereotypes.Profile Diagram ExampleWhat is a Use Case Diagram?A use-case model describes a system's functional requirements in terms of use cases. It is a model of the system's intended functionality (use cases) and its environment (actors). Use cases enable you to relate what you need from a system to how the system delivers on those needs.Think of a use-case model as a menu, much like the menu you'd find in a restaurant. By looking at the menu, you knowwhat's available to you, the individual dishes as well as their prices. You also know what kind of cuisine the restaurant serves: Italian, Mexican, Chinese, and so on. By looking at the menu, you get an overall impression of the dining experience that awaits you in that restaurant. The menu, in effect, "models" the restaurant's behavior.Because it is a very powerful planning instrument, the use-case model is generally used in all phases of the development cycle by all team members.Use Case Diagram ExampleWhat is an Activity Diagram?Activity diagrams are graphical representations of workflows of stepwise activities and actions with support for choice, iteration and concurrency. It describes the flow of control of the target system, such as the exploring complex business rules and operations, describing the use case also the business process. In the Unified Modeling Language, activity diagrams are intended to model both computational and organizational processes (i.e. workflows).Activity Diagram ExampleWhat is a State Machine Diagram?A state diagram is a type of diagram used in UML to describe the behavior of systems which is based on the concept of state diagrams by David Harel. State diagrams depict the permitted states and transitions as well as the events that effect these transitions. It helps to visualize the entire lifecycle of objects and thus help to provide a better understanding of state-based systems.State Machine Diagram ExampleWhat is a Sequence Diagram?The Sequence Diagram models the collaboration of objects based on a time sequence. It shows how the objects interact with others in a particular scenario of a use case. With the advanced visual modeling capability, you can create complex sequence diagram in few clicks. Besides, some modeling tool such as Visual Paradigm can generate sequence diagram from the flow of events which you have defined in the use case description.Sequence Diagram ExampleWhat is a Communication Diagram?Similar to Sequence Diagram, the Communication Diagram is also used to model the dynamic behavior of the use case. When compare to Sequence Diagram, the Communication Diagram is more focused on showing the collaboration of objects rather than the time sequence. They are actually semantically equivalent, so some of the modeling tool such as, Visual Paradigm allowsyou to generate it from one to the other.Communication Diagram ExampleWhat is Interaction Overview Diagram?The Interaction Overview Diagram focuses on the overview of the flow of control of the interactions. It is a variant of the Activity Diagram where the nodes are the interactions or interaction occurrences. The Interaction Overview Diagram describes the interactions where messages and lifelines are hidden. You can link up the "real" diagrams and achieve high degree navigability between diagrams inside the Interaction Overview Diagram.Interaction Overview Diagram ExampleWhat is Timing Diagram?Timing Diagram shows the behavior of the object(s) in a given period of time. Timing diagram is a special form of a sequence diagram. The differences between timing diagram and sequence diagram are the axes are reversed so that the time are increase from left to right and the lifelines are shown in separate compartments arranged vertically.Timing Diagram ExampleUML Glossary and Terms•Abstract Class - A class that will never be instantiated. An instance of this class will never exist.•Actor - An object or person that initiates events the system is involved with.•Activity: A step or action within an Activity Diagram. Represents an action taken by the system or by an Actor.•Activity Diagram: A glorified flowchart that shows the steps and decisions and parallel operations within a process, such as an algorithm or a business process.•Aggregation - Is a part of another class. Shown with a hollow diamond next to the containing class in diagrams.•Artifacts - Documents describing the output of a step in the design process. The description is graphic, textual, or some combination.•Association - A connection between two elements of a Model. This might represent a member variable in code, or theassociation between a personnel record and the person it represents, or a relation between two categories of workers, or any similar relationship. By default, both elements in an Association are equal, and are aware of each other through the Association. An Association can also be a Navigable Association, meaning that the source end of the association is aware of the target end, but not vice versa.•Association Class: A Class that represents and adds information to the Association between two other Classes.•Attributes - Characteristics of an object which may be used to reference other objects or save object state information.•Base Class: A Class which defines Attributes and Operations that are inherited by a Subclass via a Generalization relationship.•Branch: A decision point in an Activity Diagram. Multiple Transitions emerge from the Branch, each with a Guard Condition. When control reaches the Branch, exactly one Guard Condition must be true; and control follows the corresponding Transition.•Class: A category of similar Objects, all described by the same Attributes and Operations and all assignment-compatible.•Class Diagram - Shows the system classes and relationships between them.•Classifier: A UML element that has Attributes and Operations. Specifically, Actors, Classes, and Interfaces.•Collaboration: A relation between two Objects in a Communication Diagram, indicating that Messages can pass back and forth between the Objects.•Communication Diagram - A diagram that shows how operations are done while emphasizing the roles of objects.•Component: A deployable unit of code within the system.•Component Diagram: A diagram that shows relations between various Components and Interfaces.•Concept - A noun or abstract idea to be included in a domain model.•Construction Phase - The third phase of the Rational Unified Process during which several iterations of functionality are built into the system under construction. This is where the main work is done.•Dependence: A relationship that indicates one Classifier knows the Attributes and Operations of another Classifier, but isn't directly connected to any instance of the second Classifier.•Deployment Diagram: A diagram that shows relations between various Processors.•Domain -The part of the universe that the system is involved with.•Elaboration Phase - The second phase of the Rational Unified Process that allows for additional project planning including the iterations of the construction phase.•Element: Any item that appears in a Model.•Encapsulation - Data in objects is private.•Generalization - Indicates that one class is a subclass on another class (superclass). A hollow arrow points to the superclass.•Event: In a State Diagram, this represents a signal or event or input that causes the system to take an action or switch States.•Final State: In a State Diagram or an Activity Diagram, this indicates a point at which the diagram completes.•Fork: A point in an Activity Diagram where multiple parallel control threads begin.•Generalization: An inheritance relationship, in which aSubclass inherits and adds to the Attributes and Operations of a Base Class.•GoF - Gang of Four set of design patterns.•High Cohesion - A GRASP evaluative pattern which makes sure the class is not too complex, doing unrelated functions.•Low Coupling - A GRASP evaluative pattern which measures how much one class relies on another class or is connected to another class.•Inception Phase - The first phase of the Rational Unified Process that deals with the original conceptualization and beginning of the project.•Inheritance - Subclasses inherit the attributes or characterics of their parent (superclass) class. These attributes can be overridden in the subclass.•Initial State: In a State Diagram or an Activity Diagram, this indicates the point at which the diagram begins.•Instance - A class is used like a template to create an object. This object is called an instance of the class. Any number of instances of the class may be created.•Interface: A Classifier that defines Attributes and Operations that form a contract for behavior. A provider Class or Component may elect to Realize an Interface (i.e., implement its Attributes and Operations). A client Class or Component may then Depend upon the Interface and thus use the provider without any details of the true Class of the provider.•Iteration - A mini project section during which some small piece of functionality is added to the project. Includes the development loop of analysis, design and coding.•Join: A point in an Activity Diagram where multiple parallel control threads synchronize and rejoin.•Member: An Attribute or an Operation within a Classifier.•Merge: A point in an Activity Diagram where different control paths come together.•Message - A request from one object to another asking the object receiving the message to do something. This is basically a call to a method in the receiving object.•Method - A function or procedure in an object.•Model - The central UML artifact. Consists of various elements arranged in a hierarchy by Packages, with relations between elements as well.•Multiplicity - Shown in a domain model and indicated outside concept boxes, it indicates object quantity relationship to quantiles of other objects.•Navigability: Indicates which end of a relationship is aware of the other end. Relationships can have bidirectional Navigability (each end is aware of the other) or single directional Navigability (one end is aware of the other, but not vice versa).•Notation - Graphical document with rules for creating analysis and design methods.•Note: A text note added to a diagram to explain the diagram in more detail.•Object - Object: In an Activity Diagram, an object that receives information from Activities or provides information to Activities. In a Collaboration Diagram or a Sequence Diagram, an object that participates in the scenario depicted in the diagram. In general: one instance or example of a given Classifier (Actor, Class, or Interface).•Package - A group of UML elements that logically should be grouped together.•Package Diagram: A Class Diagram in which all of theelements are Packages and Dependencies.•Pattern - Solutions used to determine responsibility assignment for objects to interact. It is a name for a successful solution to a well-known common problem.•Parameter: An argument to an Operation.•Polymorphism - Same message, different method. Also used as a pattern.•Private: A Visibility level applied to an Attribute or an Operation, indicating that only code for the Classifier that contains the member can access the member.•Processor: In a Deployment Diagram, this represents a computer or other programmable device where code may be deployed.•Protected: A Visibility level applied to an Attribute or an Operation, indicating that only code for the Classifier that contains the member or for its Subclasses can access the member.•Public: A Visibility level applied to an Attribute or an Operation, indicating that any code can access the member.•Reading Direction Arrow - Indicates the direction of a relationship in a domain model.•Realization: Indicates that a Component or a Class provides a given Interface.•Role - Used in a domain model, it is an optional description about the role of an actor.•Sequence Diagram: A diagram that shows the existence of Objects over time, and the Messages that pass between those Objects over time to carry out some behavior. State chart diagram - A diagram that shows all possible object states.•State: In a State Diagram, this represents one state of a system or subsystem: what it is doing at a point in time, as wellas the values of its data.•State Diagram: A diagram that shows States of a system or subsystem, Transitions between States, and the Events that cause the Transitions.•Static: A modifier to an Attribute to indicate that there's only one copy of the Attribute shared among all instances of the Classifier. A modifier to an Operation to indicate that the Operation stands on its own and doesn't operate on one specific instance of the Classifier.•Stereotype: A modifier applied to a Model element indicating something about it which can't normally be expressed in UML. In essence, Stereotypes allow you to define your own "dialect" of UML.•Subclass: A Class which inherits Attributes and Operations that are defined by a Subclass via a Generalization relationship.•Swimlane: An element of an Activity Diagram that indicates what parts of a system or a domain perform particular Activities. All Activities within a Swimlane are the responsibility of the Object, Component, or Actor represented by the Swimlane.•Time Boxing - Each iteration will have a time limit with specific goals.•Transition: In an Activity Diagram, represents a flow of control from one Activity or Branch or Merge or Fork or Join to another. In a State Diagram, represents a change from one State to another.•Transition Phase - The last phase of the Rational Unified Process during which users are trained on using the new system and the system is made available to users.•UML - Unified Modeling Language utilizes text and graphic documents to enhance the analysis and design of software。
毕业设计管理系统详细设计
毕业设计管理系统详细设计毕业设计管理系统详细设计一、引言随着高校教育的普及和学生规模的不断扩大,毕业设计的管理工作变得愈发繁琐。
为了提高毕业设计的效率和质量,设计一套毕业设计管理系统势在必行。
本文将详细设计这套系统的各个模块,包括学生信息管理、课题选择、指导教师分配、进度管理等。
二、学生信息管理模块学生信息管理模块是整个系统的基础,它包括学生的个人信息、选课信息、成绩信息等。
在这个模块中,学生可以登录系统查看自己的个人信息,并进行课题选择和指导教师的申请。
管理员可以对学生信息进行管理,包括录入、修改和删除等操作。
三、课题选择模块课题选择模块是毕业设计过程中的重要环节。
在这个模块中,教师可以发布自己的课题,并设定选课时间和选课人数限制。
学生可以在规定的时间内选择自己感兴趣的课题,并提交选择申请。
系统会根据教师的意愿和学生的成绩等因素进行匹配,最终确定课题分配结果。
四、指导教师分配模块指导教师分配模块是毕业设计过程中的关键环节。
在这个模块中,系统会根据学生的选课情况和成绩等因素,自动分配合适的指导教师给学生。
同时,学生也可以在系统中查看自己的指导教师信息,并进行沟通和交流。
五、进度管理模块进度管理模块是毕业设计过程中的重要环节。
在这个模块中,学生可以在系统中提交自己的毕业设计进度,并进行进度的更新和修改。
指导教师可以查看学生的进度,并进行评审和指导。
管理员可以对学生的进度进行监控和管理,确保毕业设计按时完成。
六、成绩评定模块成绩评定模块是毕业设计最终的结果展示和评定环节。
在这个模块中,学生可以提交自己的毕业设计报告和相关材料。
指导教师会对学生的毕业设计进行评审,并给出成绩。
管理员可以对成绩进行审核和确认,最终确定学生的毕业设计成绩。
七、系统安全性设计为了保证毕业设计管理系统的安全性,需要设计相应的安全机制和权限控制。
在系统中,学生只能查看和修改自己的信息,而不能查看其他学生的信息。
指导教师可以查看自己指导的学生信息,但不能修改其他学生的信息。
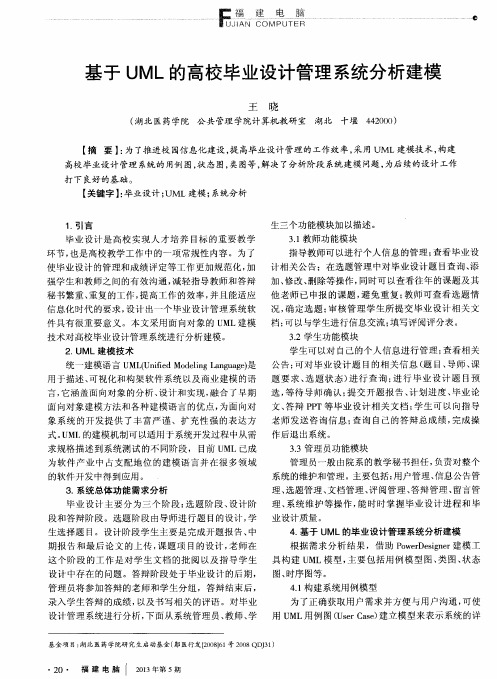
基于UML的高校毕业设计管理系统分析建模
ML用 例 图 ( U s e r C a s e ) 建立 模 型来 表 示系 统 的详 设 计 管理 系统 进 行分 析 , 下面 从 系 统管 理 员 、 教师 、 学 用 U
基金 项 目: 湖北 医药学院研 究生启动基金( 郧 医行发 [ 2 o 0 8 】 6 1 号2 0 0 8 QD J 3 1 )
打下 良好 的基础 。
【 关键字 】 : 毕业设计 ; U ML建模 ; 系统分析
生三个 功 能模块 加 以描述 。 3 . 1 教 师功 能模 块
1 . 引 言
Байду номын сангаас
毕业 设计 是 高 校 实 现 人 才 培 养 目标 的 重要 教 学 环节 , 也 是 高校 教学 工 作 中的一 项 常规 性 内容 。为 了
惹 一
嚣
基于 U ML的高校毕业设计管理 系统分 析建模
王 晓
( 湖 北 医药 学院 公 共 管理 学院计 算机教 研 室 湖北 十堰 4 4 2 0 0 0 )
【 摘 要】 : 为了 推进校园信 息化建设 , 提高毕业设计管理的工作效率, 采用 UML建模技术 , 构建
高校 毕业设 计 管理 系统 的 用例 图 , 状 态 图, 类 图等 , 解 决 了分析 阶段 系统建模 问题 , 为后 续 的设 计 工作
4 . 基于 U ML的毕 业设计 管理 系统 分析 建模
根据 需求 分 析 结 果 ,借 助 P o w e r D e s i g n e r 建模 工 图、 时序 图等 。 4 . 1 构 建系统 用例 模 型 为 了正确 获取 用 户需 求 并方 便 与用 户 沟通 , 可 使
期 报 告 和 最后 论 文 的上 传 , 课 题 项 目的设 计 , 老 师 在
毕业设计管理系统用例模型
毕业设计管理系统用例模型篇一:毕业设计管理系统浙江理工大学信息学院《统一建模语言UML》实验报告(XX/XX学年第2学期)课题名称:毕业设计管理系统专业:班级:姓名:学号:指导教师:贾宇波XX年6月毕业设计管理系统建模一、需求分析毕业论文管理是高校必不可缺的组成部分,它是把握毕业生质量的重要一关。
长期以来,毕业论文管理都使用传统人工管理方式,这种管理方式效率低、容易出错、实时性和互动性不强,与发挥学生特长、更有效地通过毕业论文和设计强化学生知识体系的目标不吻合,也无法实现学分制下教学管理的要求。
为了使毕业论文的管理和成绩评定等工作更加规范化,减轻指导教师和答辩秘书繁重、重复的工作,提高工作的效率,使论文指导教师能将大部分精力用在指导学生的毕业论文上而不是用来处理繁重、重复的文书工作。
高效率、低成本的快速设计和开发出一种毕业论文管理系统,使高校的毕业论文管理工作智能化、网络化和信息化就具有了很重要的意义。
因此,采用统一建模语言(UnifiedModelingLanguage,简称UML)来规划设计基于Web 的毕业设计管理系统。
二、实验环境Windows7 (32bit)Rational Rose XX三、实验内容1、Rational Rose基本操作2、用例图设计3、类图设计4、行为图设计5、交互图设计6、实现图设计四、概要设计系统主要包括以下几个模块。
如图4-1所示图4-1 毕业设计管理模块设计应老师要求,以下实验均以选课模块作为基础其中选题模块可分为以下几个过程。
如图4-2所示。
图4-2选题管理模块结构图五、系统建模1、创建系统用例模型毕业设计管理系统的参与者有:教务人员教师学生数据维护人员1.1教务人员用例图教务人员能够通过该系统进行如下活动。
图5-1-1 教务人员用例图1.2 学生用例图学生能够通过该系统进行如下活动。
图5-1-2学生用例图1.3 教师用例图教师能够通过该系统进行如下活动。
UML统一建模语言实验报告完整版
UML统一建模语言实验报告完整版UML(Unified Modeling Language)统一建模语言是一种用于软件系统建模和设计的图形化语言。
通过使用UML,开发人员可以清晰地表示软件系统的结构、行为和交互。
下面是一份关于UML统一建模语言的实验报告。
实验目的:熟悉UML统一建模语言的概念和使用方法,了解如何使用UML进行软件系统的建模和设计。
实验步骤:1.了解UML的基本概念:UML包括多种图形元素,如用例图、类图、时序图等。
在实验开始前,我们对UML的基本概念进行了学习和了解。
2.创建用例图:用例图是UML中用来描述系统功能的图形化工具。
我们使用UML建模工具创建了一个简单的用例图,并添加了系统的参与者和用例。
用例图清楚地显示出系统的功能和用户之间的交互。
3.创建类图:类图是UML中用来描述系统静态结构的图形化工具。
我们使用UML建模工具创建了一个包含类、属性和方法的类图,并建立了它们之间的关系。
类图能够清楚地表示出系统的数据结构和类之间的依赖关系。
4.创建时序图:时序图是UML中用来描述系统交互行为的图形化工具。
我们使用UML建模工具创建了一个简单的时序图,并按照时间顺序显示了系统中对象之间的交互。
时序图可以帮助开发人员更好地理解系统中对象之间的通信过程。
5.创建活动图:活动图是UML中用来描述系统过程和流程的图形化工具。
我们使用UML建模工具创建了一个包含活动和决策的活动图,并展示了系统中的流程和操作顺序。
活动图可以帮助开发人员更好地理解系统中的工作流程。
实验结果:通过这些实验步骤,我们成功地创建了一个简单的UML模型,包括用例图、类图、时序图和活动图。
这些图形化工具帮助我们更好地理解和设计软件系统,并与其他开发人员进行沟通和合作。
实验总结:通过本次实验,我们深入了解了UML统一建模语言的概念和使用方法。
UML提供了多种图形化工具,可以方便地描述系统的结构、行为和交互。
这些工具对软件系统的设计和开发非常有帮助,可以提高开发效率,减少错误。
基于UML的学生信息管理系统
基于UML的学生信息管理系统随着学校学生人数的不断增加,学生信息的管理变得越来越重要。
为了更好地管理学生信息,开发一个基于UML的学生信息管理系统是十分必要的。
UML(Unified Modeling Language)是一种可视化的面向对象建模语言,它提供了一种图形化的方式来表示软件开发过程中的各种概念和元素。
通过UML建模,可以更好地理解软件开发过程中的各种关系和结构,从而更好地管理系统。
在基于UML的学生信息管理系统中,我们可以使用以下几种图形来表示不同的概念和元素:类图类图表示学生信息管理系统的各个类及其之间的关系。
其中,学生类是最基本的类,它包含了学生的基本信息,如学号、姓名、性别、出生日期等。
还可以包括其他类,如教师类、课程类、成绩类等。
这些类之间通过各种关系相互,如关联、聚合、组合等。
对象图对象图表示学生信息管理系统的各个对象及其之间的关系。
在系统中,我们可以创建多个对象,每个对象都包含了一定的属性值。
例如,一个学生对象可以包含学生的基本信息,如学号、姓名、性别、出生日期等。
用例图用例图表示学生信息管理系统的功能需求和系统行为。
通过用例图,可以清楚地看出系统的功能需求和各个用例之间的关系。
在用例图中,我们可以将学生信息管理系统分为多个用例,如学生信息录入、学生信息查询、学生信息修改、学生信息删除等。
序列图序列图表示学生信息管理系统中的各个对象之间的交互关系。
通过序列图,可以清楚地看出各个对象之间的消息交互顺序和时间顺序。
例如,在成绩录入时,教师可以先从课程列表中选择课程,然后选择学生并录入成绩,最后提交成绩单。
通过以上几种UML图形,我们可以更好地管理系统中的各个概念和元素之间的关系,从而更好地实现学生信息管理系统的开发。
随着学校规模的扩大和管理的复杂化,学生信息管理变得尤为重要。
传统的手工管理模式已经无法满足学校对学生信息的需求。
因此,我们需要一个高效、方便、实用的学生信息管理系统。
先极毕业设计(论文)智能管理系统
先极毕业设计(论文)智能管理系统篇一:中国海洋大学毕业(设计)论文智能管理系统快速使用指南中国海洋大学毕业论文(设计)系统快速使用指南第一部分主要角色操作功能说明一、专业负责人功能概述1、流程管理(专业负责人的主要操作功能部分)专业负责人设置论文起止时间;指导教师申报课题后,专业负责人审核课题;专业负责人审核专业课题;指导教师下达任务书后专业负责人审核任务书;学生论文提交后指导教师评分,指导教师评分后,专业负责人为学生分配评阅教师,专业负责人管理答辩小组和查看各答辩小组信息。
2.帐号管理(专业负责人管理个人登录密码和答辩录入员帐号)专业负责人管理个人登入密码,专业负责人管理答辩小组后,就添加答辩录入员账号。
3.特殊情况处理(专业负责人处理所属专业的学生论文各个阶段的特殊情况)4.过程信息统计(专业负责人查询和统计所属专业学生论文课题信息和学生论文成绩)过程信息统计:毕设学生信息、课题选择信息、学生选题信息、任务书信息、开题报告信息、外文翻译信息、学生论文成绩信息、校外申请信息、评阅答辩学生信息。
二、指导教师功能概述1.帐号管理(指导教师管理个人登录密码和个人基础信息)帐号管理:修改此登录帐号的密码;修改个人信息,即维护个人的一些基本信息。
2.流程管理(指导教师的主要操作功能部分)流程管理包括:课题申报、确认选题、下达任务书、下达外文翻译原文、审阅外出毕业设计申请、审阅开题报告、填写中期检查、审阅外文翻译、审核周进展、审核设计(论文)草稿、审核设计(论文)定稿、查看答辩学生论文信息、优秀指导教师申请、校级设计(论文)推荐、学生材料打印。
3.特殊情况处理(指导教师处理所带课题学生论文各个阶段的特殊情况)4.交流互动(指导教师在线给系统中的其他角色进行留言和管理指导日志以及所带学生联系方式)收件箱,即教师查收本系统所有人发来的邮件信息;发件箱,即教师查看在本系统中发出的所有邮件信;指导日志,即教师填写所有课题的指导日志信息;学生联系信息,记录教师所带课题的学生联系方式。
跟我学统一建模语言UML——软件系统的总体设计及示例
1.1跟我学统一建模语言UML——软件系统的总体设计及示例1.1.1软件系统的总体设计1、软件系统设计(1)什么是软件系统设计所谓的软件系统设计就是通过某种特定的平台,而达到完成整体软件的功能的工作过程。
主要涉及包括软件系统的概要设计(静态结构)和软件系统的详细设计(动态结构)。
(2)软件系统设计的主要任务软件系统设计阶段的主要任务是在系统需求分析和建模的基础上,更加深入、综合地考虑辅助决策系统的目标、技术要求和约束,同时也扩展和细化软件系统需求分析阶段的模型。
(3)软件系统设计的目标系统设计人员最终提交出精化的设计方案并开发出一个明确描述设计方案的可视化模型——各种UML的设计图,并保障设计模型最终能平滑地过渡到软件系统的程序代码实现,即解决“怎么做”的主要问题。
(4)软件系统设计的目的1)指明一种易转化成程序代码的工作方案,并对软件系统的需求分析工作进一步细化;2)进一步细化软件系统需求分析阶段所提取的程序类(包括其中的功能方法和特征属性),并且增加新的程序类以处理系统中诸如数据库、用户接口、通信、设备等技术领域中的相关问题。
3)设计是对问题域外部可见行为的规格说明、并增添实际的计算机系统实现所需的细节,包括人机交互、任务管理和数据管理等方面的细节。
(5)软件系统需求分析和系统设计需要相互合作1)软件系统需求分析主要是面向问题,是明确动力的过程,重在对问题的理解和翻译,灵活性比较高2)软件系统设计主要是面向方案,是排除阻力和解决棘手的技术问题的过程,重在对问题进一步的精化和适应,受到的约束比较大。
从整体上看,软件系统需求分析和系统设计的对立是保障问题和方案趋于一致的基本动力。
就像两个相反方向的张力,使软件系统的开发过程朝着正确的方向前进。
2、软件系统概要设计(结构设计)(1)在什么时期进行软件系统的概要设计在软件系统的需求明确、准备开始程序编码之前,要做软件系统的概要设计方面的工作,因为软件系统的概要设计对后续的软件系统开发、测试、实施、维护等阶段的工作起到关键性的影响。
- 1、下载文档前请自行甄别文档内容的完整性,平台不提供额外的编辑、内容补充、找答案等附加服务。
- 2、"仅部分预览"的文档,不可在线预览部分如存在完整性等问题,可反馈申请退款(可完整预览的文档不适用该条件!)。
- 3、如文档侵犯您的权益,请联系客服反馈,我们会尽快为您处理(人工客服工作时间:9:00-18:30)。
浙江理工大学信息学院《统一建模语言UML》实验报告(2014/2015学年第2学期)课题名称:毕业设计管理系统专业:班级:姓名:学号:指导教师:贾宇波2015年6月毕业设计管理系统建模一、需求分析毕业论文管理是高校必不可缺的组成部分,它是把握毕业生质量的重要一关。
长期以来,毕业论文管理都使用传统人工管理方式,这种管理方式效率低、容易出错、实时性和互动性不强,与发挥学生特长、更有效地通过毕业论文和设计强化学生知识体系的目标不吻合,也无法实现学分制下教学管理的要求。
为了使毕业论文的管理和成绩评定等工作更加规范化,减轻指导教师和答辩秘书繁重、重复的工作,提高工作的效率,使论文指导教师能将大部分精力用在指导学生的毕业论文上而不是用来处理繁重、重复的文书工作。
高效率、低成本的快速设计和开发出一种毕业论文管理系统,使高校的毕业论文管理工作智能化、网络化和信息化就具有了很重要的意义。
因此,采用统一建模语言(UnifiedModelingLanguage,简称UML)来规划设计基于Web的毕业设计管理系统。
二、实验环境Windows7 (32bit)Rational Rose 2003三、实验内容1、Rational Rose基本操作2、用例图设计3、类图设计4、行为图设计5、交互图设计6、实现图设计四、概要设计系统主要包括以下几个模块。
如图4-1所示图4-1 毕业设计管理模块设计应老师要求,以下实验均以选课模块作为基础其中选题模块可分为以下几个过程。
如图4-2所示。
图4-2选题管理模块结构图五、系统建模1、创建系统用例模型毕业设计管理系统的参与者有:1.1 教务人员用例图教务人员能够通过该系统进行如下活动。
图5-1-1 教务人员用例图教务人员教师学生数据维护人员选题管理发布拟题要求教师立题发布选题结果专家评审题目学生选题分配评审题目上报题目双向选择发布选题结果手工调整上传文件开通教师立题发布题目教师选学生开通双向选择关闭双向选择确定专家特殊调整1.2 学生用例图学生能够通过该系统进行如下活动。
图5-1-2学生用例图1.3 教师用例图教师能够通过该系统进行如下活动。
图5-1-3教师用例图1.4 数据维护人员用例图数据维护人员能够通过该系统进行如下活动。
图5-1-4数据维护人员用例图2. 创建系统静态模型2.1 系统所有用例分析得到的实体类见表5-2-1,5-2-2表5-2-2 实体类汇总22.2 构建实体类关系模型。
如图5-2-3所示图5-2-3 类之间的关系示例3. 创建系统动态模型在毕业设计管理系统的选题管理中,通过上述用例可以获得以下的交互行为:3.1 “上传文件“创建上传文件的序列图如图5-3-1所示。
图5-3-1 上传文件序列图与序列图等价的协作图如图5-3-2所示。
图5-3-2 上传文件协作图3.2 “开通教师立题”创建开通教师立题的序列图如图5-3-3所示。
图5-3-3开通教师立题序列图与序列图等价的协作图如图5-3-4所示。
图5-3-4 开通教师立题协作图3.3 “上报题目”创建上报题目的序列图如图5-3-5所示。
图5-3-5上报题目序列图与序列图等价的协作图如图5-3-6所示。
图5-3-6上报题目协作图3.4 “确定专家”用例创建确定专家的序列图如图5-3-7所示。
图5-3-7确定专家序列图与序列图等价的协作图如图5-3-8所示。
图5-3-8确定专家协作图3.5 “分配评审题目”创建分配评审题目的序列图如图5-3-9所示。
图5-3-9分配评审题目序列图与序列图等价的协作图如图5-3-10所示。
图5-3-10分配评审题目协作图3.6 “专家评审题目”创建专家评审题目的序列图如图5-3-11所示。
图5-3-11专家评审题目序列图与序列图等价的协作图如图5-3-12所示。
图5-3-12专家评审题目协作图3.7 “发布题目”创建发布题目的序列图如图5-3-13所示。
图5-3-13发布题目序列图与序列图等价的协作图如图5-3-14所示。
图5-3-14发布题目协作图3.8 “开通双向选择”创建开通双向选择的序列图如图5-3-15所示。
图5-3-15开通双向选择序列图图5-3-16开通双向选择协作图3.9 “学生选题”创建学生选题的序列图如图5-3-17所示。
图5-3-17学生选题序列图图5-3-18学生选题协作图3.10 “教师选学生”创建教师选学生的序列图如图5-3-19所示。
图5-3-19教师选学生序列图与序列图等价的协作图如图5-3-20所示。
图5-3-20教师选学生协作图3.11 “关闭双向选择”创建关闭双向选择的序列图如图5-3-21所示。
图5-3-21关闭双向选择序列图与序列图等价的协作图如图5-3-22所示。
图5-3-22关闭双向选择协作图3.12 “手工调整”创建手工调整的序列图如图5-3-23所示。
图5-3-23手工调整序列图与序列图等价的协作图如图5-3-24所示。
图5-3-24手工调整协作图3.13 “发布选题结果”创建发布选题结果的序列图如图5-3-25所示。
图5-3-25发布选题结果序列图与序列图等价的协作图如图5-3-26所示。
图5-3-26发布选题结果协作图3.14 “特殊调整”创建特殊调整的序列图如图5-3-27所示。
图5-3-27特殊调整序列图与序列图等价的协作图如图5-3-28所示。
图5-3-28特殊调整协作图在毕业设计管理系统中,有明确状态的类包括:题目、学生。
题目包含以下的状态:指导教师拟的新题目、未通过审查的题目、审查通过的题目、发布的题目、被删除的题目。
创建题目的状态图如图 5-3-29所示。
图5-3-29 题目状态图学生包含以下的状态:新学生、被选择学生、未选择学生、被删除学生。
创建学生的状态图如图 5-3-30所示。
图5-3-30 学生状态图在毕业设计管理系统中可建立教务人员、教师、学生的活动图。
创建教务人员的活动图如图5-3-31所示。
图5-3-31 教务人员活动图创建学生的活动图。
如图5-3-32所示。
图5-3-32 学生活动图创建教师的活动图。
如图5-3-33所示。
图5-3-33 教师活动图4、创建系统部署模型毕业设计管理系统的的构件图如图5-4-1所示。
图5-4-1 基本业务构件毕业设计管理系统的部署图如图5-4-2所示。
图5-4-2 系统部署图六、实验心得毕业设计(论文)是大学生在校学习期间的一个重要环节,既是对学生学习效果、实践经验与研究能力的全面总结,又是对学生素质与能力的一次综合培养,还是学生毕业资格与学位资格认定的重要依据。
它的目的在于培养学生综合运用所学的基础理论、专业知识和基本技能进行分析与解决实际问题的能力,培养学生的创新精神。
具体应注重以下方面能力的培养:一、调研、查阅中外文献和收集资料的能力;二、理论分析、制定设计或试验方案的能力;三、实验研究和数据处理的能力;四、设计、计算和绘图的能力。
五、综合分析、编制设计说明书及撰写论文的能力;六、外语、计算机应用能力。
从以上关于毕业设计(论文)的介绍中,可以看出其重要性,无论对学生,教师以及学校都是学校运作相当关键的一环。
由老师选题到答辩结束,再到成绩提交等整个与毕业设计相关的流程,都需要学校各个部门的通力合作,互相协调;基于传统的线下所涉及的操作相当复杂而且繁琐,而毕业设计又是学生在校的一个重要环节,因此能用计算机相关技术开发出一个功能完备的管理信息系统,即毕业设计管理系统,并通过使用这个系统,能完善和规范学院有关毕业设计工作的整个流程,进一步实现学校管理工作的电子化,自动化,无纸化,以提高毕业设计(论文)管理工作的效率等目标。
开发本管理信息系统要运用到本人所在专业核心课程的相关知识,统一建模语言(UML),可想而知,这是在校综合知识的一次综合运用和重要的实践机会,也是本专业学生的一次全面考核。
在实验过程中,我也遇到了许多问题,比如激活条不会画,协作图不会画等等。
其中协作图是在代课老师上课的过程中讲到后自己才会画的,实质上也只是点了一个按钮自动生成而已。
而时序图的激活条这是在自己随意玩弄的过程中无意中发现的,这也是做这次大型实验过程中一个小小的惊喜。
总之,我从这次实验中获得了非常多的经验,从刚开始的一头雾水,到了后来的能自己静下心来分析对一个系统进行概要设计,划分各个子模块,以及对各个模块利用UML建模。
我相信,在今后的学习或工作中肯定有用到这类经验的地方,就最近比如毕业论文来说,我可以充分利用所学的UML建模知识来进行自己毕业设计的建模,为后期的工作打下坚实的基础。