音乐之声鉴赏
《音乐之声》评析
我最感兴趣的电影(之一):《音乐之声》《音乐之声》(The Sound of Music)是一部改编自玛丽亚·冯·崔普的著作《崔普家庭演唱团》的戏剧作品,最初以音乐剧的形式于百老汇上演,之后被改编成电影,其主题曲与电影同名。
从其它译名,如《真善美》、《仙乐飘飘处处闻》中,我们可以猜测出这部电影所要表达的思想。
《音乐之声》由美国20世纪福克斯电影公司发行,于1965年3月2日正式公映。
该影片时长174min(约2.9小时),语言为英语,属于歌舞、剧情类电影;由多次荣获奥斯卡金像奖的Robert Wise导演,编剧是Ernest Lehman,由国际知名演员Julie Andrews、Christopher Plummer和Richard Haydn主演。
《音乐之声》曾获得1965年金球奖,1966年第38届奥斯卡金像奖中的多种奖项;并于2001年被美国国家电影保护局确定为国家影片登记奖。
这部电影自登上舞台,便“受到全世界各个国家数百万观众的喜爱,被认为是人类记忆中最值得珍惜和细细回味的艺术佳作,好莱坞音乐歌舞片中经典中的经典,电影史上绝妙的神来之笔。
”(来自百度)电影《音乐之声》描写了热爱音乐的见习修女玛利亚,在退役海军上校冯·特拉普家中做家庭教师的故事。
善良的心灵和美妙的音乐帮助玛利亚赢得了孩子们的喜爱,进而改变了冯·特拉普家中严肃冷酷的气氛,并因此打动了特拉普,与他终成眷属。
最后,当德国占领奥地利后,上校一家又凭借参加音乐节的机会逃离了纳粹的控制。
22岁的玛丽亚是一个活泼好动、热爱自然的志愿修女,但她的性格却总是让她在修道院里惹麻烦。
修女院女院长决定让玛丽亚到冯·特拉普上校家当家庭教师,也借此让她探索出真正的生活目的。
玛丽亚对特拉普严格管教7个孩子的做法不满,她用窗帘给每个孩子逢制游戏服装,带领他们到市场游玩,在美丽的阿尔卑斯山上野餐,还教他们唱歌,用温柔和善良感化孩子。
《音乐之声》电影音乐赏析
《音乐之声》电影音乐赏析《音乐之声》电影音乐赏析1. 引言介绍《音乐之声》这部经典音乐电影的背景和意义,概括主要故事情节。
2. 电影概述详细描述《音乐之声》的情节、角色和主题,包括主要场景和时间背景。
3. 原声音乐赏析3.1 主题曲《音乐之声》解读主题曲的歌词和旋律,分析其在电影中的象征意义和作用。
3.2 古典音乐介绍电影中引用的古典音乐作品,如贝多芬的《第九交响曲》等,分析其在电影中的运用效果和符号意义。
4. 历史背景与文化影响4.1 纳粹德国时期解释电影背景中的历史背景,包括纳粹德国时期的音乐政策和对音乐家的限制。
4.2 女性地位与自由意志探讨电影中女性角色的地位和他们对自由意志的追求,分析音乐在电影中成为女性自由表达的媒介。
5. 音乐教育与儿童成长5.1 音乐的教育作用讨论电影中音乐教育对儿童成长的影响,分析教育者与学习者之间的互动关系。
5.2 童声合唱和儿童音乐剧介绍电影中的童声合唱和儿童音乐剧的表现形式和作用,分析其在电影中的情节推动和情感表达。
6. 音乐与爱情探讨电影中音乐对爱情的表达方式,分析音乐作为情感表达的媒介和强化剧情的手段。
7. 结语总结电影《音乐之声》的音乐赏析,强调其在电影史和音乐影响上的地位和意义。
附件:电影《音乐之声》的海报、剧照和相关音乐资源。
法律名词及注释:1. 版权法:保护创作者对其原创作品的权利,包括音乐作品的演奏、复制和发行权。
2. 表演权:指演艺人员对其表演活动享有的权益,包括音乐演唱和演奏等。
3. 作曲权:指作曲家对他们创作的音乐作品享有的权益,包括改编、演奏和发行等。
仙乐飘飘乐融融──《音乐之声》赏析

仙乐飘飘乐融融──《音乐之声》赏析
仙乐飘飘乐融融──《音乐之声》赏析
《音乐之声》于1965年在美国进行第一次演出,时隔四十年,该片仍作为音乐歌舞片经典中的经典,受到全世界各阶层人们的欢迎。
我觉得之所以如此成功,在于它的音乐和影片中家庭教师和七个孩子纯真甜美的微笑。
《音乐之声》以音乐贯穿全程,音乐既推动了故事情节的发展,也成为整部影片最动人的部分,被观众广为传诵。
高山之巅,玛利亚独唱充满激情的《音乐之声》;修道院里,修女们运用说白与歌唱结合的形式讨论玛利亚迟到的原因;田野里,玛利亚教孩子们唱欢快动听的《哆来咪》;音乐节上,上校一家一边演唱深情款款的《雪绒花》,一边逃离奥地利……所有这些可爱的音符组合在一起,就是完美无暇的《音乐之声》。
影片处处充满了阳光一般温暖的气息和浪漫情调,观众一边听着动人的音乐,一边观赏优美的自然风光,很容易就被融于其中的淳朴之情打动。
国际电影巨星成龙曾经给这部影片以很高的评价:“我最喜爱的电影既不是史泰龙的枪炮,也不是施瓦辛格的特技,而是充满温馨的《音乐之声》。
因为在这部影片中,我所感到的是人世间那种最淳朴、最简单的友爱和挚爱之情,这部影片让我的全身心都得到放松。
”影片通过音乐很好地阐释了真善美的主题。
可以说,我们生活在这个世界上,做的所有事情,最终极的目标都是为了追求真善美,还有爱,是这四者令我们生存的世界。
电影音乐之声鉴赏
电影音乐之声鉴赏《音乐之声》电影鉴赏《音乐之声》是电影史上相当经典的音乐片,取材于奥地利修女玛利亚奥古斯都特拉普的同名自传体小说,根据百老汇同名音乐剧改编而成。
片中众多情景交融的歌曲令电影观众沉醉不已,理查德罗杰斯创作的优美动听、流畅生动的音乐和百老汇制作人奥斯卡汉默斯坦二世撰写的雅俗共赏、惹人喜爱的歌词,无疑是影片取得空前成功的关键因素,负责编曲兼指挥的影片音乐总监欧文柯斯堤尔因此获得了奥斯卡最佳音乐奖。
自上映以来,《雪绒花》、《哆来咪》等多首歌曲被广为传唱,成为经典曲目,《音乐之声》电影原声带更驻留唱片排行榜上长达233周之久。
《音乐之声》这部欢声笑语的喜剧片反映的是严肃、深刻、崇高的人道主义内涵,也表达了奥地利人民反侵略的正义心声和不畏强暴的必胜信念。
影片中天性自由,不受繁文缛节约束的美丽修女玛利亚,迷人的阿尔卑斯山、清澈的湖泊、明媚的气候、雅致的别墅,七个活泼可爱的孩子,以及反纳粹、追求自由的勇气,积极的生活态度,深深打动了世界各地人们的心,激励和鼓舞了一代又一代的人。
影片也被翻译成了30多种文字在世界各国上映,至今仍然有电影院在上演,它的意义已经远远不是票房收入所能代表的了。
该片被好莱坞的电影评论家、《时代周刊》以及民意投票一致选为“美国最受欢迎的十大电影之一”。
电影《音乐之声》的剧情简介22岁的玛利亚是一个萨尔茨堡修道院里的志愿修女,但是,她活泼好动和热爱自然的性格却总是让她在修道院里惹麻烦。
修女院里的女院长(Mother Abbess)觉得她这样的活泼的性格不适合僧侣生活。
于是,当她接到冯特拉普上校家寻求家庭教师的请求,她决定让玛利亚去,也借此让她探索出真正的生活目的。
玛利亚到达冯特拉普(Captain Georg Von Trapp)家,发现他是一个有七个孩子的鳏夫(这里指丧偶的男子),长期的海军生活和亡妻的悲伤使他对待孩子像管教士兵一样严格。
很快,玛利亚就明白了以前那些家庭教师离开的原因,原来是孩子们得不到父亲的关爱,总是用捉弄教师来吸引父亲的注意。
电影《音乐之声》赏析
电影《音乐之声》赏析电影《音乐之声》赏析《音乐之声》以音乐剧的形式塑造了一群各具清晰性格特色的鲜活人物形象,讲述了一个既富有生动活泼的浓郁生活气息,又充满理解与爱心的真实感人的故事。
与其他影片不同的突出风格是:它不仅具有浓厚的戏剧性情节,而且有优美悦耳的歌声和大量自然而又精彩的人物对白。
其语言独具特色:既有用词精练、韵律整齐、节奏规范、艺术性强的高雅诗歌歌词,又有大量朴实、自然而又颇具风趣的日常生活对话。
《音乐之声》四十年前第一次在美国演出起,便一直受到世界各国人民的喜爱。
电影中优美的自然景观,积极的生活态度,可爱的孩子,感人的爱情,博大深厚的民族感情,以及出色的电影音乐,使得无论从哪个标准来评价,它都是美国音乐片的经典之作。
它获得了最佳影片、景佳导演、最佳音响、最佳剪辑与最佳作曲五项奥斯卡大奖。
成龙曾给这部影片以很高的评价:“我最喜爱的电影既不是史泰龙的枪炮,也不是施瓦辛格的特技,而是充满温馨的《音乐之声》。
因为在这部影片中,我所感到的是人世间那种最淳朴、最简单的友爱和挚爱之情,这部影片让我的全身心都得到放松。
”每一次看《音乐之声》,它都带给观众不一样的欢乐、感动,让人的心灵得到净化。
《音乐之声》讲述了热情活泼的修女玛丽亚到奥地利退役军官特拉普海军上校家当7个孩子的家庭教师的故事。
上校的妻子几年前去世,上校心灰意冷,用管理水兵的方法来管教孩子。
孩子们的生活就像钟摆一样循规蹈矩,毫无生气。
玛丽亚来到上校家后,顺应孩子们天性活泼的特点,教他们唱歌跳舞,带他们去野餐、郊游、爬树和划船,使家中充满欢乐。
她的热情、爱心赢得了孩子们的信任和喜爱,最终也赢得了上校的爱慕,后来成了孩子们的母亲。
纳粹德国占领奥地利后,爱国的上校不愿意效力于纳粹海军,于是,在一次民谣节上,上校带领全家成功地逃出了魔掌,翻越群山奔向自由。
正如玛丽亚在电影序幕中所唱的:“群山因为音乐充满生气,唱了千年的歌,我的心中充满了音乐,要唱出每支歌,我心震得像鸟儿翅膀,由湖边飞上树,我心叹息像钟声飘扬,微笑像是小溪流过,夜晚歌唱像云雀祈祷,当我奔向山里心1/4页情悲伤,我听到昔日歌声,我心就会歌唱,因为音乐的响起,我要再度歌唱??”纯真善良的玛丽亚用歌声打开了故事的序幕,从她的歌声中我们可以看出玛丽亚的博爱,而实际上也确实如此,玛丽亚对自然的热爱,对生活的热爱,对那群孩子的爱以及她对爱情的渴望都充分说明了这一点。
《音乐之声》电影音乐赏析

《音乐之声》电影音乐赏析《音乐之声》电影音乐赏析概述:《音乐之声》是一部由罗伯特·维斯特曼执导的经典音乐剧电影,于1965年上映。
该电影以音乐为主线,讲述了一个年轻的音乐家到一个富有的军官家中担任家庭教师,并最终将家庭的六个孩子带入音乐事业的故事。
电影中的音乐作为情节和角色发展的重要元素,给观众带来了深刻的感动和快乐。
一、曲目简介:本部电影共包含了多首经典的音乐作品,下面对其中几首进行简要赏析:1、《The Sound of Music》(音乐之声)这是电影的主题曲,由朱利·安德鲁斯(Julie Andrews)演唱。
这首歌以优美的旋律和温暖的歌词,表达了音乐给人们带来的力量和快乐。
2、《Do-Re-Mi》(C调上的小调)这是一首非常欢快的童谣,由朱利·安德鲁斯和孩子们合唱。
歌曲通过简单易学的旋律和歌词,教给观众音阶的概念,同时传递了音乐的教育意义。
3、《Edelweiss》(雪绒花)这是一首温柔动人的歌曲,由克里斯托弗·普卢默(Christopher Plummer)演唱。
歌曲以雪绒花为象征,表达了对家园的热爱和珍惜。
二、音乐与情节发展:音乐在电影中扮演了重要的角色,推动了剧情的发展和角色的塑造。
1、让·西默瑞安(Maria Rner)的音乐才华:作为主角,让·西默瑞安通过她的音乐才华,影响了冯·特拉普家庭的孩子们,并与冯·特拉普上校建立了深厚的感情。
她用音乐治愈了孩子们的创伤,也改变了自己的人生轨迹。
2、音乐的教育意义:电影中的音乐不仅仅是表演艺术形式,更是对孩子们进行教育和引导的工具。
让·西默瑞安通过音乐教育,帮助孩子们培养了对音乐的热爱,并为他们打开了一扇探索世界的窗户。
三、法律名词及注释:1、版权(Copyright):指对于原创作品的独家权利,包括复制、分发、公开表演、展示等权利。
2、音乐授权(Music Licensing):指向他人购买使用音乐作品的许可证。
鉴赏音乐之声
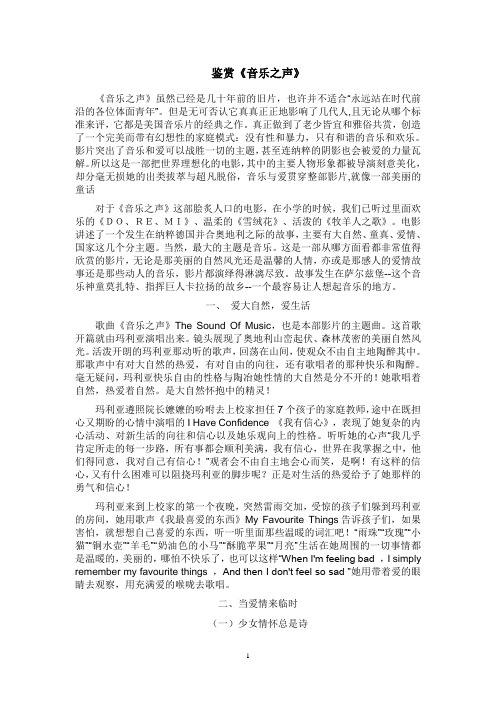
鉴赏《音乐之声》《音乐之声》虽然已经是几十年前的旧片,也许并不适合“永远站在时代前沿的各位体面青年”。
但是无可否认它真真正正地影响了几代人,且无论从哪个标准来评,它都是美国音乐片的经典之作。
真正做到了老少皆宜和雅俗共赏,创造了一个完美而带有幻想性的家庭模式:没有性和暴力,只有和谐的音乐和欢乐。
影片突出了音乐和爱可以战胜一切的主题,甚至连纳粹的阴影也会被爱的力量瓦解。
所以这是一部把世界理想化的电影,其中的主要人物形象都被导演刻意美化,却分毫无损她的出类拔萃与超凡脱俗,音乐与爱贯穿整部影片,就像一部美丽的童话对于《音乐之声》这部脍炙人口的电影,在小学的时候,我们已听过里面欢乐的《DO、RE、MI》、温柔的《雪绒花》、活泼的《牧羊人之歌》。
电影讲述了一个发生在纳粹德国并合奥地利之际的故事,主要有大自然、童真、爱情、国家这几个分主题。
当然,最大的主题是音乐。
这是一部从哪方面看都非常值得欣赏的影片,无论是那美丽的自然风光还是温馨的人情,亦或是那感人的爱情故事还是那些动人的音乐,影片都演绎得淋漓尽致。
故事发生在萨尔兹堡--这个音乐神童莫扎特、指挥巨人卡拉扬的故乡--一个最容易让人想起音乐的地方。
一、爱大自然,爱生活歌曲《音乐之声》The Sound Of Music,也是本部影片的主题曲。
这首歌开篇就由玛利亚演唱出来。
镜头展现了奥地利山峦起伏、森林茂密的美丽自然风光。
活泼开朗的玛利亚那动听的歌声,回荡在山间,使观众不由自主地陶醉其中。
那歌声中有对大自然的热爱,有对自由的向往,还有歌唱者的那种快乐和陶醉。
毫无疑问,玛利亚快乐自由的性格与陶冶她性情的大自然是分不开的!她歌唱着自然,热爱着自然。
是大自然怀抱中的精灵!玛利亚遵照院长嬷嬷的吩咐去上校家担任7个孩子的家庭教师,途中在既担心又期盼的心情中演唱的I Have Confidence 《我有信心》,表现了她复杂的内心活动、对新生活的向往和信心以及她乐观向上的性格。
电影《音乐之声》之音乐赏析
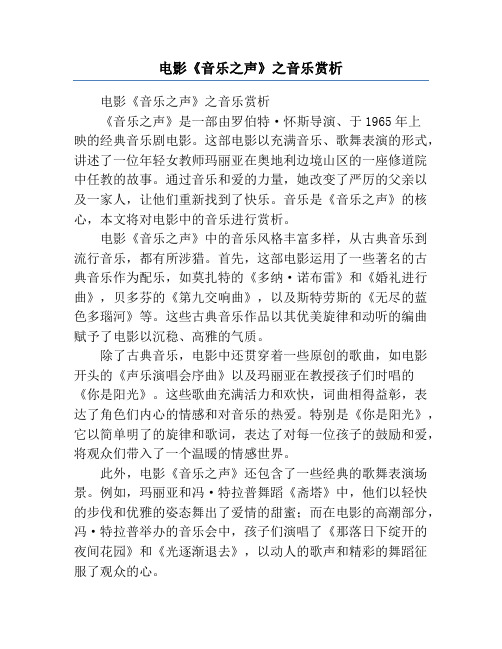
电影《音乐之声》之音乐赏析电影《音乐之声》之音乐赏析《音乐之声》是一部由罗伯特·怀斯导演、于1965年上映的经典音乐剧电影。
这部电影以充满音乐、歌舞表演的形式,讲述了一位年轻女教师玛丽亚在奥地利边境山区的一座修道院中任教的故事。
通过音乐和爱的力量,她改变了严厉的父亲以及一家人,让他们重新找到了快乐。
音乐是《音乐之声》的核心,本文将对电影中的音乐进行赏析。
电影《音乐之声》中的音乐风格丰富多样,从古典音乐到流行音乐,都有所涉猎。
首先,这部电影运用了一些著名的古典音乐作为配乐,如莫扎特的《多纳·诺布雷》和《婚礼进行曲》,贝多芬的《第九交响曲》,以及斯特劳斯的《无尽的蓝色多瑙河》等。
这些古典音乐作品以其优美旋律和动听的编曲赋予了电影以沉稳、高雅的气质。
除了古典音乐,电影中还贯穿着一些原创的歌曲,如电影开头的《声乐演唱会序曲》以及玛丽亚在教授孩子们时唱的《你是阳光》。
这些歌曲充满活力和欢快,词曲相得益彰,表达了角色们内心的情感和对音乐的热爱。
特别是《你是阳光》,它以简单明了的旋律和歌词,表达了对每一位孩子的鼓励和爱,将观众们带入了一个温暖的情感世界。
此外,电影《音乐之声》还包含了一些经典的歌舞表演场景。
例如,玛丽亚和冯·特拉普舞蹈《斋塔》中,他们以轻快的步伐和优雅的姿态舞出了爱情的甜蜜;而在电影的高潮部分,冯·特拉普举办的音乐会中,孩子们演唱了《那落日下绽开的夜间花园》和《光逐渐退去》,以动人的歌声和精彩的舞蹈征服了观众的心。
《音乐之声》不仅有着精彩的音乐,还通过音乐传达了一些深刻的思想。
就像电影中所展示的那样,音乐有着无穷的力量,可以超越语言、文化和社会的界限,打动人心,传递情感。
音乐不仅可以改变个人的命运和心境,也能够改变整个社群的氛围和态度。
这对电影中的角色来说是至关重要的,他们通过音乐找到了勇气和希望,改变了以往的固定观念和生活方式。
综上所述,电影《音乐之声》通过精彩的音乐和歌舞表演,为观众呈现了一部充满魅力和感动的作品。
- 1、下载文档前请自行甄别文档内容的完整性,平台不提供额外的编辑、内容补充、找答案等附加服务。
- 2、"仅部分预览"的文档,不可在线预览部分如存在完整性等问题,可反馈申请退款(可完整预览的文档不适用该条件!)。
- 3、如文档侵犯您的权益,请联系客服反馈,我们会尽快为您处理(人工客服工作时间:9:00-18:30)。
profile.doc last updated 6/23/94 [by Guido]PROFILER DOCUMENTATION and (mini) USER'S MANUALCopyright 1994, by InfoSeek Corporation, all rights reserved.Written by James RoskindPermission to use, copy, modify, and distribute this Python software and its associated documentation for any purpose (subject to the restriction in the following sentence) without fee is hereby granted, provided that the above copyright notice appears in all copies, and that both that copyright notice and this permission notice appear in supporting documentation, and that the name of InfoSeek not be used in advertising or publicity pertaining to distribution of the software without specific, written prior permission. This permission is explicitly restricted to the copying and modification of the software to remain in Python, compiled Python, or other languages (such as C) wherein the modified or derived code is exclusively imported into a Python module.INFOSEEK CORPORATION DISCLAIMS ALL WARRANTIES WITH REGARD TO THIS SOFTWARE, INCLUDING ALL IMPLIED WARRANTIES OF MERCHANTABILITY AND FITNESS. IN NO EVENT SHALL INFOSEEK CORPORATION BE LIABLE FOR ANY SPECIAL, INDIRECT OR CONSEQUENTIAL DAMAGES OR ANY DAMAGES WHATSOEVER RESULTING FROM LOSS OF USE, DATA OR PROFITS, WHETHER IN AN ACTION OF CONTRACT, NEGLIGENCE OR OTHER TORTIOUS ACTION, ARISING OUT OF OR IN CONNECTION WITH THE USE OR PERFORMANCE OF THIS SOFTWARE.The profiler was written after only programming in Python for 3 weeks. As a result, it is probably clumsy code, but I don't know for sure yet 'cause I'm a beginner :-). I did work hard to make the code run fast, so that profiling would be a reasonable thing to do. I tried not to repeat code fragments, but I'm sure I did some stuff in really awkward ways at times. Please send suggestions for improvements to:jar@. I won't promise *any* support. ...but I'd appreciate the feedback.SECTION HEADING LIST:INTRODUCTIONHOW IS THIS profile DIFFERENT FROM THE OLD profile MODULE?INSTANT USERS MANUALWHAT IS DETERMINISTIC PROFILING?REFERENCE MANUALFUNCTION profile.run(string, filename_opt)CLASS Stats(filename, ...)METHOD strip_dirs()METHOD add(filename, ...)METHOD sort_stats(key, ...)METHOD reverse_order()METHOD print_stats(restriction, ...)METHOD print_callers(restrictions, ...)METHOD print_callees(restrictions, ...)METHOD ignore()LIMITATIONSCALIBRATIONEXTENSIONS: Deriving Better ProfilersINTRODUCTIONA "profiler" is a program that describes the run time performance of a program, providing a variety of statistics. This documentation describes the profiler functionality provided in the modules "profile" and "pstats." This profiler provides "deterministic profiling" of any Python programs. It also provides a series ofreport generation tools to allow users to rapidly examine the results of a profile operation.HOW IS THIS profile DIFFERENT FROM THE OLD profile MODULE?The big changes from standard profiling module are that you get more information, and you pay less CPU time. It's not a trade-off, it's a trade-up.To be specific:bugs removed: local stack frame is no longer molested, execution time is now charged to correct functions, ....accuracy increased: profiler execution time is no longer charged to user's code, calibration for platform is supported, file reads are not done *by* profiler *during* profiling (and charged touser's code!), ...speed increased: Overhead CPU cost was reduced by more than a factor of two (perhaps a factor of five), lightweight profiler module isall that must be loaded, and the report generating module(pstats) is not needed during profiling.recursive functions support: cumulative times in recursive functionsare correctly calculated; recursive entries are counted; ...large growth in report generating UI: distinct profiles runs can be added together forming a comprehensive report; functions that importstatistics take arbitrary lists of files; sorting criteria is now based on keywords (instead of 4 integer options); reports showswhat functions were profiled as well as what profile file wasreferenced; output format has been improved, ...INSTANT USERS MANUALThis section is provided for users that "don't want to read the manual." It provides a very brief overview, and allows a user torapidly perform profiling on an existing application.To profile an application with a main entry point of "foo()", youwould add the following to your module:import profileprofile.run("foo()")The above action would cause "foo()" to be run, and a series ofinformative lines (the profile) to be printed. The above approach is most useful when working with the interpreter. If you would like tosave the results of a profile into a file for later examination, youcan supply a file name as the second argument to the run() function:import profileprofile.run("foo()", 'fooprof')When you wish to review the profile, you should use the methods in the pstats module. Typically you would load the statistics data asfollows:import pstatsp = pstats.Stats('fooprof')The class "Stats" (the above code just created an instance of this class) has a variety of methods for manipulating and printing the data that was just read into "p". When you ran profile.run() above, what was printed was the result of three method calls:p.strip_dirs().sort_stats(-1).print_stats()The first method removed the extraneous path from all the module names. The second method sorted all the entries according to the standard module/line/name string that is printed (this is to comply with the semantics of the old profiler). The third method printed out all the statistics. You might try the following sort calls:p.sort_stats('name')p.print_stats()The first call will actually sort the list by function name, and the second call will print out the statistics. The following are some interesting calls to experiment with:p.sort_stats('cumulative').print_stats(10)This sorts the profile by cumulative time in a function, and then only prints the ten most significant lines. If you want to understand what algorithms are taking time, the above line is what you would use.If you were looking to see what functions were looping a lot, and taking a lot of time, you would do:p.sort_stats('time').print_stats(10)to sort according to time spent within each function, and then print the statistics for the top ten functions.You might also try:p.sort_stats('file').print_stats('__init__')This will sort all the statistics by file name, and then print out statistics for only the class init methods ('cause they are spelled with "__init__" in them). As one final example, you could try:p.sort_stats('time', 'cum').print_stats(.5, 'init')This line sorts stats with a primary key of time, and a secondary key of cumulative time, and then prints out some of the statistics. To be specific, the list is first culled down to 50% (re: .5) of itsoriginal size, then only lines containing "init" are maintained, and that sub-sub-list is printed.If you wondered what functions called the above functions, you could now (p is still sorted according to the last criteria) do:p.print_callers(.5, 'init')and you would get a list of callers for each of the listed functions.If you want more functionality, you're going to have to read the manual (or guess) what the following functions do:p.print_callees()p.add('fooprof')WHAT IS DETERMINISTIC PROFILING?"Deterministic profiling" is meant to reflect the fact that all "function call", "function return", and "exception" events are monitored, and precise timings are made for the intervals between these events (during which time the user's code is executing). In contrast, "statistical profiling" (which is not done by this module) randomly samples the effective instruction pointer, and deduces where time is being spent. The latter technique traditionally involves less overhead (as the code does not need to be instrumented), but provides only relative indications of where time is being spent.In Python, since there is an interpreter active during execution, the presence of instrumented code is not required to do deterministic profiling. Python automatically provides a hook (optional callback)for each event. In addition, the interpreted nature of Python tends to add so much overhead to execution, that deterministic profiling tends to only add small processing overhead, in typical applications. The result is that deterministic profiling is not that expensive, but yet provides extensive run time statistics about the execution of a Python program.Call count statistics can be used to identify bugs in code (surprising counts), and to identify possible inline-expansion points (high callcounts). Internal time statistics can be used to identify hot loopsthat should be carefully optimized. Cumulative time statistics shouldbe used to identify high level errors in the selection of algorithms. Note that the unusual handling of cumulative times in this profiler allows statistics for recursive implementations of algorithms to be directly compared to iterative implementations.REFERENCE MANUALThe primary entry point for the profiler is the global functionprofile.run(). It is typically used to create any profileinformation. The reports are formatted and printed using methods forthe class pstats.Stats. The following is a description of all ofthese standard entry points and functions. For a more in-depth viewof some of the code, consider reading the later section on "Profiler Extensions," which includes discussion of how to derive "better"profilers from the classes presented, or reading the source code for these modules.FUNCTION profile.run(string, filename_opt)This function takes a single argument that has can be passed to the "exec" statement, and an optional file name. In all cases thisroutine attempts to "exec" its first argument, and gather profiling statistics from the execution. If no file name is present, then this function automatically prints a simple profiling report, sorted by the standard name string (file/line/function-name) that is presented ineach line. The following is a typical output from such a call:cut here----main()2706 function calls (2004 primitive calls) in 4.504 CPU seconds Ordered by: standard namencalls tottime percall cumtime percall filename:lineno(function) 2 0.006 0.003 0.953 0.477 pobject.py:75(save_objects) 43/3 0.533 0.012 0.749 0.250 pobject.py:99(evaluate) ...cut here----The first line indicates that this profile was generated by the call: profile.run('main()'), and hence the exec'ed string is 'main()'. The second line indicates that 2706 calls were monitored. Of those calls, 2004 were "primitive." We define "primitive" to mean that the call was not induced via recursion. The next line: "Ordered by: standard name", indicates that the text string in the far right column was used to sort the output. The column headings include:"ncalls" for the number of calls,"tottime" for the total time spent in the given function(and excluding time made in calls to sub-functions), "percall" is the quotient of "tottime" divided by "ncalls""cumtime" is the total time spent in this and all subfunctions(i.e., from invocation till exit). This figure isaccurate *even* for recursive functions."percall" is the quotient of "cumtime" divided by primitive calls"filename:lineno(function)" provides the respective data of each functionWhen there are two numbers in the first column (e.g.: 43/3), then the latter is the number of primitive calls, and the former is the actual number of calls. Note that when the function does not recurse, these two values are the same, and only the single figure is printed.CLASS Stats(filename, ...)This class constructor creates an instance of a statistics object from a filename (or set of filenames). Stats objects are manipulated by methods, in order to print useful reports.The file selected by the above constructor must have been created by the corresponding version of profile. To be specific, there is *NO* file compatibility guaranteed with future versions of this profiler, and there is no compatibility with files produced by other profilers (e.g., the standard system profiler).If several files are provided, all the statistics for identical functions will be coalesced, so that an overall view of several processes can be considered in a single report. If additional files need to be combined with data in an existing Stats object, the add() method can be used.METHOD strip_dirs()This method for the Stats class removes all leading path information from file names. It is very useful in reducing the size of the printout to fit within (close to) 80 columns. This method modifies the object, and the striped information is lost. After performing a strip operation, the object is considered to have its entries in a "random" order, as it was just after object initialization and loading. If strip_dir() causes two function names to be indistinguishable (i.e., they are on the same line of the same filename, and have the same function name), then the statistics for these two entries are accumulated into a single entry.METHOD add(filename, ...)This methods of the Stats class accumulates additional profiling information into the current profiling object. Its arguments should refer to filenames created my the corresponding version ofprofile.run(). Statistics for identically named (re: file, line, name) functions are automatically accumulated into single function statistics.METHOD sort_stats(key, ...)This method modifies the Stats object by sorting it according to the supplied criteria. The argument is typically a string identifying the basis of a sort (example: "time" or "name").When more than one key is provided, then additional keys are used as secondary criteria when the there is equality in all keys selected before them. For example, sort_stats('name', 'file') will sort all the entries according to their function name, and resolve all ties (identical function names) by sorting by file name.Abbreviations can be used for any key names, as long as the abbreviation is unambiguous. The following are the keys currently defined:Valid Arg Meaning"calls" call count"cumulative" cumulative time"file" file name"module" file name"pcalls" primitive call count"line" line number"name" function name"nfl" name/file/line"stdname" standard name"time" internal timeNote that all sorts on statistics are in descending order (placing most time consuming items first), where as name, file, and line number searches are in ascending order (i.e., alphabetical). The subtle distinction between "nfl" and "stdname" is that the standard name is a sort of the name as printed, which means that the embedded line numbers get compared in an odd way. For example, lines 3, 20, and 40 would (if the file names were the same) appear in the string order "20" "3" and "40". In contrast, "nfl" does a numeric compare of the line numbers. In fact, sort_stats("nfl") is the same assort_stats("name", "file", "line").For compatibility with the standard profiler, the numeric argument -1, 0, 1, and 2 are permitted. They are interpreted as "stdname", "calls", "time", and "cumulative" respectively. If this old style format (numeric) is used, only one sort key (the numeric key) will be used, and additionally arguments will be silently ignored.METHOD reverse_order()This method for the Stats class reverses the ordering of the basiclist within the object. This method is provided primarily for compatibility with the standard profiler. Its utility is questionable now that ascending vs descending order is properly selected based on the sort key of choice.METHOD print_stats(restriction, ...)This method for the Stats class prints out a report as described inthe profile.run() definition.The order of the printing is based on the last sort_stats() operation done on the object (subject to caveats in add() and strip_dirs()).The arguments provided (if any) can be used to limit the list down to the significant entries. Initially, the list is taken to be the complete set of profiled functions. Each restriction is either an integer (to select a count of lines), or a decimal fraction between 0.0 and 1.0 inclusive (to select a percentage of lines), or a regular expression (to pattern match the standard name that is printed). If several restrictions are provided, then they are applied sequentially. For example:print_stats(.1, "foo:")would first limit the printing to first 10% of list, and then only print functions that were part of filename ".*foo:". In contrast, the command:print_stats("foo:", .1)would limit the list to all functions having file names ".*foo:", and then proceed to only print the first 10% of them.METHOD print_callers(restrictions, ...)This method for the Stats class prints a list of all functions that called each function in the profiled database. The ordering is identical to that provided by print_stats(), and the definition of the restricting argument is also identical. For convenience, a number is shown in parentheses after each caller to show how many times this specific call was made. A second non-parenthesized number is the cumulative time spent in the function at the right.METHOD print_callees(restrictions, ...)This method for the Stats class prints a list of all function that were called by the indicated function. Aside from this reversal of direction of calls (re: called vs was called by), the arguments and ordering are identical to the print_callers() method.METHOD ignore()This method of the Stats class is used to dispose of the valuereturned by earlier methods. All standard methods in this classreturn the instance that is being processed, so that the commands canbe strung together. For example:pstats.Stats('foofile').strip_dirs().sort_stats('cum').print_stats().ignore()would perform all the indicated functions, but it would not returnthe final reference to the Stats instance.LIMITATIONSThere are two fundamental limitations on this profiler. The first isthat it relies on the Python interpreter to dispatch "call", "return",and "exception" events. Compiled C code does not get interpreted,and hence is "invisible" to the profiler. All time spent in C code (including builtin functions) will be charged to the Python functionthat was invoked the C code. IF the C code calls out to some nativePython code, then those calls will be profiled properly.The second limitation has to do with accuracy of timing information.There is a fundamental problem with deterministic profilers involving accuracy. The most obvious restriction is that the underlying "clock"is only ticking at a rate (typically) of about .001 seconds. Hence no measurements will be more accurate that that underlying clock. Ifenough measurements are taken, then the "error" will tend to averageout. Unfortunately, removing this first error induces a second sourceof error...The second problem is that it "takes a while" from when an event is dispatched until the profiler's call to get the time actually *gets*the state of the clock. Similarly, there is a certain lag whenexiting the profiler event handler from the time that the clock'svalue was obtained (and then squirreled away), until the user's codeis once again executing. As a result, functions that are called manytimes, or call many functions, will typically accumulate this error.The error that accumulates in this fashion is typically less than the accuracy of the clock (i.e., less than one clock tick), but it *can* accumulate and become very significant. This profiler provides ameans of calibrating itself for a give platform so that this error canbe probabilistically (i.e., on the average) removed. After theprofiler is calibrated, it will be more accurate (in a least squaresense), but it will sometimes produce negative numbers (when call counts are exceptionally low, and the gods of probability work against you :-). ) Do *NOT* be alarmed by negative numbers in the profile. They should *only* appear if you have calibrated your profiler, and the results are actually better than without calibration.CALIBRATIONThe profiler class has a hard coded constant that is added to each event handling time to compensate for the overhead of calling the time function, and socking away the results. The following procedure can be used to obtain this constant for a given platform (see discussionin LIMITATIONS above).import profilepr = profile.Profile()pr.calibrate(100)pr.calibrate(100)pr.calibrate(100)The argument to calibrate() is the number of times to try to do the sample calls to get the CPU times. If your computer is *very* fast, you might have to do:pr.calibrate(1000)or even:pr.calibrate(10000)The object of this exercise is to get a fairly consistent result. When you have a consistent answer, you are ready to use that number in the source code. For a Sun Sparcstation 1000 running Solaris 2.3, the magical number is about .00053. If you have a choice, you are better off with a smaller constant, and your results will "less often" show up as negative in profile statistics.The following shows how the trace_dispatch() method in the Profile class should be modified to install the calibration constant on a Sun Sparcstation 1000:def trace_dispatch(self, frame, event, arg):t = self.timer()t = t[0] + t[1] - self.t - .00053 # Calibration constantif self.dispatch[event](frame,t):t = self.timer()self.t = t[0] + t[1]else:r = self.timer()self.t = r[0] + r[1] - t # put back unrecorded delta returnNote that if there is no calibration constant, then the line containing the callibration constant should simply say:t = t[0] + t[1] - self.t # no calibration constantYou can also achieve the same results using a derived class (and the profiler will actually run equally fast!!), but the above method is the simplest to use. I could have made the profiler "self calibrating", but it would have made the initialization of theprofiler class slower, and would have required some *very* fancy coding, or else the use of a variable where the constant .00053 was placed in the code shown. This is a ****VERY**** critical performance section, and there is no reason to use a variable lookup at this point, when a constant can be used.EXTENSIONS: Deriving Better ProfilersThe Profile class of profile was written so that derived classescould be developed to extend the profiler. Rather than describing all the details of such an effort, I'll just present the following two examples of derived classes that can be used to do profiling. If the reader is an avid Python programmer, then it should be possible to use these as a model and create similar (and perchance better) profile classes.If all you want to do is change how the timer is called, or which timer function is used, then the basic class has an option for that in the constructor for the class. Consider passing the name of afunction to call into the constructor:pr = profile.Profile(your_time_func)The resulting profiler will call your time function instead ofos.times(). The function should return either a single number, or alist of numbers (like what os.times() returns). If the functionreturns a single time number, or the list of returned numbers haslength 2, then you will get an especially fast version of the dispatch routine.Be warned that you *should* calibrate the profiler class for thetimer function that you choose. For most machines, a timer thatreturns a lone integer value will provide the best results in terms oflow overhead during profiling. (os.times is *pretty* bad, 'cause itreturns a tuple of floating point values, so all arithmetic isfloating point in the profiler!). If you want to be substitute abetter timer in the cleanest fashion, you should derive a class, andsimply put in the replacement dispatch method that better handles your timer call, along with the appropriate calibration constant :-).cut here------------------------------------------------------------------#**************************************************************************** # OldProfile class documentation#**************************************************************************** ## The following derived profiler simulates the old style profile, providing# errant results on recursive functions. The reason for the usefulness of this # profiler is that it runs faster (i.e., less overhead) than the old# profiler. It still creates all the caller stats, and is quite# useful when there is *no* recursion in the user's code. It is also# a lot more accurate than the old profiler, as it does not charge all# its overhead time to the user's code.#**************************************************************************** class OldProfile(Profile):def trace_dispatch_exception(self, frame, t):rt, rtt, rct, rfn, rframe, rcur = self.curif rcur and not rframe is frame:return self.trace_dispatch_return(rframe, t)return 0def trace_dispatch_call(self, frame, t):fn = `frame.f_code`self.cur = (t, 0, 0, fn, frame, self.cur)if self.timings.has_key(fn):tt, ct, callers = self.timings[fn]self.timings[fn] = tt, ct, callerselse:self.timings[fn] = 0, 0, {}return 1def trace_dispatch_return(self, frame, t):rt, rtt, rct, rfn, frame, rcur = self.currtt = rtt + tsft = rtt + rctpt, ptt, pct, pfn, pframe, pcur = rcurself.cur = pt, ptt+rt, pct+sft, pfn, pframe, pcurtt, ct, callers = self.timings[rfn]if callers.has_key(pfn):callers[pfn] = callers[pfn] + 1else:callers[pfn] = 1self.timings[rfn] = tt+rtt, ct + sft, callersreturn 1def snapshot_stats(self):self.stats = {}for func in self.timings.keys():tt, ct, callers = self.timings[func]nor_func = self.func_normalize(func)nor_callers = {}nc = 0for func_caller in callers.keys():nor_callers[self.func_normalize(func_caller)]=\callers[func_caller]nc = nc + callers[func_caller]self.stats[nor_func] = nc, nc, tt, ct, nor_callers#**************************************************************************** # HotProfile class documentation#**************************************************************************** ## This profiler is the fastest derived profile example. It does not# calculate caller-callee relationships, and does not calculate cumulative# time under a function. It only calculates time spent in a function, so。