Analysis for the Deployment of Single-Point Mooring Buoy System Based on Multi-Body Dynamics Me
Summary
A Web Services Data Analysis Grid*William A. Watson III†‡, Ian Bird, Jie Chen, Bryan Hess, Andy Kowalski, Ying Chen Thomas Jefferson National Accelerator Facility12000 Jefferson Av, Newport News, VA 23606, USASummaryThe trend in large-scale scientific data analysis is to exploit compute, storage and other resources located at multiple sites, and to make those resources accessible to the scientist as if they were a single, coherent system. Web technologies driven by the huge and rapidly growing electronic commerce industry provide valuable components to speed the deployment of such sophisticated systems. Jefferson Lab, where several hundred terabytes of experimental data are acquired each year, is in the process of developing a web-based distributed system for data analysis and management. The essential aspects of this system are a distributed data grid (site independent access to experiment, simulation and model data) and a distributed batch system, augmented with various supervisory and management capabilities, and integrated using Java and XML-based web services.KEY WORDS: web services, XML, grid, data grid, meta-center, portal1. Web ServicesMost of the distributed activities in a data analysis enterprise have their counterparts in the e-commerce or business-to-business (b2b) world. One must discover resources, query capabilities, request services, and have some means of authenticating users for the purposes of authorizing and charging for services. Industry today is converging upon XML (eXtensible Markup Language) and related technologies such as SOAP (Simple Object Access Protocol), WSDL (Web Services Description Language), and UDDI (Universal Description, Discovery and Integration) to provide the necessary capabilities [1].The advantages of leveraging (where appropriate) this enormous industry investment are obvious: powerful tools, multiple vendors (healthy competition), and a trained workforce* Work supported by the Department of Energy, contract DE-AC05-84ER40150.† Correspondence to: William Watson, Jefferson Laboratory MS 16A, 12000 Jefferson Av, Newport News, VA 23606.‡ Email: Chip.Watson@.(reusable skill sets). One example of this type of reuse is in exploiting web browsers for graphical user interfaces. The browser is familiar, easy to use, and provides simple access to widely distributed resources and capabilities, ranging from simple views to applets, including audio and video streams, and even custom data streams (via plug-ins).Web services are very much like dynamic web pages in that they accept user-specified data as part of the query, and produce formatted output as the response. The main difference is that the input and output are expressed in XML (which focuses upon the data structure and content) instead of HTML (which focuses upon presentation). The self-describing nature of XML (nested tag name + value sets) facilitates interoperability across multiple languages, and across multiple releases of software packages. Fields (new tags) can be added with no impact on previous software.In a distributed data analysis environment, the essential infrastructure capabilities include: · Publish a data set, specifying global name and attributes· Locate a data set by global name or by data set attributes· Submit / monitor / control a batch job against aggregated resources· Move a data set to / from the compute resource, including to and from the desktop · Authenticate / authorize use of resources (security, quotas)· Track resource usage (accounting)· Monitor and control the aggregate system (system administration, user views)· (for some applications) Advance reservation of resourcesMost of these capabilities can be easily mapped onto calls to web services. These web services may be implemented in any language, with Java servlets being favored by Jefferson Lab (described below).It is helpful to characterize each of these capabilities based upon the style of the interaction and the bandwidth required, with most operations dividing into low data volume information and control services (request + response), and high volume data transport services (long-lived data flow).In the traditional web world, these two types of services have as analogs web pages (static or dynamic) retrieved via http, and file transfers via ftp. A similar split can be made to map a data analysis activity onto XML based information and control services (request + response), and a high bandwidth data transport mechanism such as a parallel ftp program, for example bbftp [2]. Other non-file-based high bandwidth I/O requirements could be met by application specific parallel streams, analogous to today’s various video and audio stream formats.The use of web services leads to a traditional three tier architecture, with the application or browser as the first tier. Web services, the second tier, are the integration point, providing access to a wide range of capabilities in a third tier, including databases, compute and file resources, and even entire grids implemented using such toolkits as Condor [3], Legion[4], Globus[5] (see Figure 1).As an example, in a simple grid portal, one uses a single web server (the portal) to gain access to a grid of resources “behind” the portal. We are proposing a flexible extension of this architecture in which there may be a large number of web servers, each providing access to local resources or even remote services, either by using remote site web services or by using a non-web grid protocol.All operations requiring privileges use X.509 certificate based authentication and secure sockets, as is already widely used for e-commerce. Certificates are currently issued by a simple certificate authority implemented as a java servlet plus OpenSSL scripts and username + password authentication. These certificates are then installed in the user’s web browser, and exported for use by other applications to achieve the goal of “single sign-on”. In the future, this prototype certificate authority will be replaced by a more robust solution to be provided by another DOE project. For web browsing, this certificate is used directly. For applications, a temporary certificate (currently 24 hours) is created as needed and used for authentication. Early versions of 3rd party file transfers supports credential forwarding of these temporary certificates.2. Implementation: Data Analysis RequirementsThe Thomas Jefferson National Accelerator Facility (Jefferson Lab) is a premier nuclear physics research laboratory engaged in probing the fundamental interactions of quarks andgluons inside the nucleus. The 5.7 GeV continuous electron beam accelerator provides a high quality tool for up to three experimental halls simultaneously. Experiments undertaken by a user community of over eight hundred scientists from roughly 150 institutions from around the world acquire as much as a terabyte of data per day, with data written to a 12000 slot StorageTek silo installation capable of holding a year’s worth of raw, processed, and simulation data.First pass data analysis (the most I/O intensive) takes place on a farm of 175 dual processor Linux machines. Java-based tools (JASMine and JOBS, described below) provide a productive user environment for file migration, disk space management, and batch job control at the laboratory. Subsequent stages of analysis take place either at the Lab or at university centers, with off-site analysis steadily increasing. The Lab is currently evolving towards a more distributed, web-based data analysis environment which will wrap the existing tools into web services, and add additional tools aimed at a distributed environment.Within a few years, the energy of the accelerator will be increased to 12 GeV, and a fourth experimental hall (Hall D) will be added to house experiments which will have ten times the data rate and analysis requirements of the current experiments. At that point, the laboratory will require a multi-tiered simulation and analysis model, integrating compute and storage resources situated at a number of large university partners, with raw and processed data flowing out from Jefferson Lab, and simulation and analysis results flowing into the lab.Theory calculations are also taking a multi-site approach – prototype clusters are currently located at Jefferson Lab and MIT for lattice QCD calculations. MIT has a cluster of 12 quad-processor alpha machines (ES40s), and will add a cluster of Intel machines in FY02. Jefferson Lab plans to have a cluster of 128 dual Xeons (1.7+ GHz) by mid FY02, doubling to 256 duals by the end of the year. Other university partners are planning additional smaller clusters for lattice QCD. As part of a 5 year long range national lattice computing plan, Jefferson Lab plans to upgrade the 0.5 teraflops capacity of this first cluster to 10 teraflops, with similar capacity systems being installed at Fermilab and Brookhaven, and smaller systems planned for a number of universities.For both experiment data analysis and theory calculations the distributed resources will be presented to the users as a single resource, managing data sets and providing interactive and batch capabilities in a domain specific meta-facility.3. The Lattice PortalWeb portals for science mimic their commercial counterparts by providing a convenient starting point for accessing a wide range of services. Jefferson Lab and its collaborators at MIT are in the process of developing a web portal for the Lattice Hadron Physics Collaboration. This portal will eventually provide access to Linux clusters, disk caches, and tertiary storage located at Jefferson Lab, MIT, and other universities. The Lattice Portal is being used as a prototype for a similar system to serve the needs of the larger Jefferson Labexperimental physics community, where FSU is taking a leading role in prototyping activities.The two main focuses of this portal effort are (1) a distributed batch system, and (2) a data grid. The MIT and JLab lattice clusters run the open source Portable Batch System (PBS) [6]. A web interface to this system [7][8] has been developed which replaces much of the functionality of the tcl/tk based gui included with openPBS. Users can view the state of batch queues and nodes without authentication, and can submit and manipulate jobs using X.509 certificate based authentication.The batch interface is implemented as Java servlets using the Apache web server and the associated Tomcat servlet engine [9]. One servlet periodically obtains the state of the PBS batch system, and makes that available to clients as an XML data structure. For web browsing, a second servlet applies a style sheet to this XML document to produce a nicely formatted web page, one frame within a multi-frame page of the Lattice Portal. Applications may also attach directly to the XML servlet to obtain the full system description (or any subset) or to submit a new job (supporting, in the future, wide area batch queues or meta-scheduling).Because XML is used to hold the system description, much of this portal software can be ported to an additional batch system simply by replacing the interface to PBS. Jefferson Lab’s JOBS [9] software provides an extensible interface to the LSF batch system. In the future, the portal software will be integrated with an upgraded version of JOBS, allowing support for either of these back end systems (PBS or LSF).The portal’s data management interface is similarly implemented as XML servlets plus servlets that apply style sheets to the XML structures for web browsing (Figure 2.).The replica catalog service tracks the current locations of all globally accessible data sets. The back end for this service is an SQL database, accessed via JDBC. The replica catalog is organized like a conventional file-system, with recursive directories, data sets, and links. From this service one can obtain directory listings, and the URL’s of hosts holding a particular data set. Recursive searching from a starting directory for a particular file is supported now, and more sophisticated searches are envisaged.A second service in the data grid (the grid node) acts as a front end to one or more disk caches and optionally to tertiary storage. One can request files to be staged into or out of tertiary storage, and can add new files to the cache. Pinning and un-pinning of files is also supported. For high bandwidth data set transfers, the grid node translates a global data set name into the URL of a file server capable of providing (or receiving) the specified file. Access will also be provided to a queued file transfer system that automatically updates the replica catalog.While the web services can be directly invoked, a client library is being developed to wrap the data grid services into a convenient form (including client-side caching of some results, a significant performance boost). Both applet and stand-alone applications are being developed above this library to provide easy-to-use interfaces for data management, while also testing the API and underlying system.The back end services ( JASMine [11] disk and silo management) used by the data web services are likewise written in Java. Using Java servlets and web services allowed a re-use of this existing infrastructure and corresponding Java skills. The following is a brief description of this java infrastructure that is being extended from the laboratory into the wide area web by means of the web services described above.4. Java Infrastructure4.1. JASMineJASMine is a distributed and modular mass storage system developed at Jefferson Lab to manage the data generated by the experimental physics program. Originally intended to manage the process of staging data to and from tape, it is now also being applied for user accessible disk pools, populated by user’s requests, and managed with automatic deletion policies.JASMine was designed using object-oriented software engineering and was written in Java. This language choice facilitated the creation of rapid prototypes, the creation of a component based architecture, and the ability to quickly port the software to new platforms.Java’s performance was never a bottleneck since disk subsystems, network connectivity, and tape drive bandwidth have always been the limiting factors with respect to performance. The added benefits of garbage collection, multithreading, and the JDBC layer for database connectivity have made Java an excellent choice.The central point of management in JASMine is a group of relational databases that store file-related meta-data and system configurations. MySQL is currently being used because of its speed and reliability; however, other SQL databases with JDBC drivers could be used.JASMine uses a hierarchy of objects to represent and organize the data stored on tape. A single logical instance of JASMine is called a store. Within a store there may be many storage groups. A storage group is a collection of other storage groups or volume sets. A volume set is a collection of one or more tape volumes. A volume represents a physical tape and contains a collection of bitfiles. A bitfile represents an actual file on tape as well as its meta-data. When a file is written to tape, the tape chosen comes from the volume set of the destination directory or the volume set of a parent directory. This allows for the grouping of similar data files onto a common set of tapes. It also provides an easy way to identify tape volumes that can be removed from the tape silo when the data files they contain are no longer required.JASMine is composed of many components that are replicated to avoid single points of failure: Request Manager handles all client requests, including status queries as well as requests for files. A Library Manager manages the tape. A Data Mover manages the movement of data to and from tape.Each Data Mover has a Dispatcher that searches the job queue for work, selecting a job based on resource requirements and availability. A Volume Manager tracks tape usage and availability, and assures that the Data Mover will not sit idle waiting for a tape in use by another Data Mover. A Drive Manager keeps track of tape drive usage and availability, and is responsible for verifying and unloading tapes.The Cache Manager keeps track of the files on the stage disks that are not yet flushed to tape and automatically removes unused files when additional disk space is needed to satisfy requests for files. This same Cache Manager component is also used to manage the user accessible cache disks for the Lattice Portal. For a site with multiple disk caches, the Cache Managers work collaboratively to satisfy requests for cached files, working essentially like a local version of the replica catalog, tracking where each file is stored on disk (Figure 3). The Cache Manager can organize disks into disk groups or pools. These disk groups allow experiments to be given a set amount of disk space for user disk cache – a simple quota system. Different disk groups can be assigned different management (deletion) policies. The management policy used most often is the least recently used policy. However, the policies are not hard coded, and additional management policies can be added by implementing the policy interface.The Jefferson Lab Offline Batch System (JOBS, or just “the JobServer”) is a generic user interface to one or more batch queuing systems. The JobServer provides a job submission API and a set of user commands for starting and monitoring jobs independent of the underlying system. The JobServer currently interfaces with Load Sharing Facility (LSF). Support for other batch queuing systems can be accomplished by creating a class that interfaces with the batch queuing system and implements the batch system interface of the JobServer.The JobServer has a defined set of keywords that users use to create a job command file. This command file is submitted to the JobServer, where it is parsed into one or more batch jobs. These batch jobs are then converted to the format required by the underlying batch system and submitted. The JobServer also provides a set of utilities to gather information on submitted jobs. These utilities simply interface to the tools or APIs of the batch system and return the results.Batch jobs that require input data files are started in such a way as to assure that the data is pre-staged to a set of dedicated cache disks before the job itself acquires a run slot and is started. With LSF, this is done by creating multiple jobs with dependencies. If an underlying batch system does not support job dependencies, the JobServer can pre-stage the data before submitting the job.5. Current Status and Future DevelopmentsThe development of the data analysis web services will proceed on two fronts: (1) extending the capabilities that are accessible via the web services, and (2) evolving the web services to use additional web technology.On the first front, the batch web services interface will be extended to include support for LSF through the JOBS interface described above, allowing the use of the automatic staging of data sets which JOBS provides (current web services support only PBS). For the data grid, policy based file migration will be added above a queued (third party) file transfer capability, using remote web services (web server to web server) to negotiate transfer protocols and target file daemon URL’s.On the second front, prototypes of these web services will be migrated to SOAP (current system uses bare XML). Investigations of WSDL and UDDI will focus on building more dynamic ensembles of web-based systems, moving towards the multi-site data analysis systems planned for the laboratory.6. Relationship to Other ProjectsThe web services approach being pursued by Jefferson Lab has some overlap with the grid projects in the Globus and Legion toolkits, Condor, and with the Unicore product [12]. Each seeks to present a set of distributed resources to client applications (and users) as a single integrated resource. The most significant difference between Jefferson Lab’s work and these other products is the use of web technologies to make the system open, robust and extensible. Like Unicore, the new software is developed almost entirely in Java, facilitating easy integration with the Lab’s existing infrastructure. However, the use of XML and HTTP as the primary application protocol makes the web services approach inherently multi-language and open, whereas Unicore uses a Java-only protocol. At this early stage, the new system does not cover as wide a range of capabilities (such as the graphical complex job creation tool in Unicore or the resource mapping flexibility in Condor-G), but is rapidly covering the functionality needed by the laboratory. In particular, details it contains capabilities considered essential by the laboratory and not yet present in some of the alternatives (for example, the Globus Replica Catalog does not yet have recursive directories, which are now planned for a future release). In cases where needed functionality can be better provided by one of these existing packages, the services of these systems can be easily wrapped into an appropriate web service. This possibility also points towards the use of web service interfaces as a way of tying together different grid systems. In that spirit, Jefferson Lab is collaborating with the Storage Resource Broker [13] team at SDSC to define common web service interfaces to data grids. SRB is likewise developing XML and web based interfaces to their very mature data management product. ACKNOWLEDGEMENTSPortions of the Lattice Portal software is being developed as part of Jefferson Lab’s work within the Particle Physics Data Grid Collaboratory [14], a part of the DOE’s Scientific Discovery Through Advanced Computing initiative.REFERENCES[1] For additional information on web services technologies, see (July 9, 2001)/TR/2000/REC-xml-20001006Extensible Markup Language (XML)1.0 (Second Edition) W3C Recommendation 6 October 2000;/TR/SOAP/Simple Object Access Protocol (SOAP) 1.1 W3C Note08 May 2000; /TR/wsdl Web Services Description Language(WSDL) 1.1 W3C Note, 15 March 2001; /[2] See http://doc.in2p3.fr/bbftp/ (July 9, 2001). bbftp was developed by Gilles Farrache(farrache@cc.in2p3.fr) from IN2P3 Computing Center, Villeurbanne (FRANCE) to support the BaBar high energy physics experiment.[3] Michael Litzkow, Miron Livny, and Matt Mutka, Condor - A Hunter of IdleWorkstations Proceedings of the 8th International Conference of Distributed Computing Systems, June, 1988; see also /condor/[4] Michael J. Lewis, Andrew Grimshaw. The Core Legion Object Model Proceedings ofthe Fifth IEEE International Symposium on High Performance Distributed Computing, August 1996.[5] I. Foster and C. Kesselman. Globus: A Metacomputing Infrastructure Toolkit.International Journal of Supercomputing Application s. 11(2):115-128, 1997[6] See: /. (July 9, 2001) The Portable Batch System (PBS) is aflexible batch queueing and workload management system originally developed by Veridian Systems for NASA.[7] See /. (July 9, 2001)[8] P. Dreher, MIT W. Akers, J. Chen, Y. Chen, C. Watson, Development of Web-basedTools for Use in Hardware Clusters Doing Lattice Physics Proceedings of the Lattice 2001 Conference, to be published (2002) Nuclear Physics B.[9] See /tomcat/ (July 9, 2001)[10] I Bird, R Chambers, M Davis, A Kowalski, S Philpott, D Rackley, R Whitney,Database Driven Scheduling for Batch Systems, Computing in High Energy Physics Conference 1997.[11] Building the Mass Storage System at Jefferson Lab Proceedings of the 18th IEEESymposium on Mass Storage Systems (2001).[12] See http://www.unicore.de/ (July 9, 2001)[13] See /DICE/SRB/[14] See /. (July 9, 2001)。
华为SecoManager安全控制器产品介绍说明书
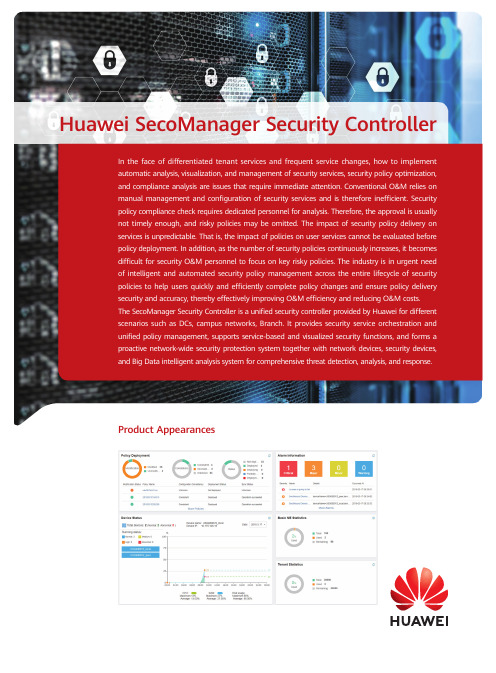
Huawei SecoManager Security ControllerIn the face of differentiated tenant services and frequent service changes, how to implementautomatic analysis, visualization, and management of security services, security policy optimization,and compliance analysis are issues that require immediate attention. Conventional O&M relies onmanual management and configuration of security services and is therefore inefficient. Securitypolicy compliance check requires dedicated personnel for analysis. Therefore, the approval is usuallynot timely enough, and risky policies may be omitted. The impact of security policy delivery onservices is unpredictable. That is, the impact of policies on user services cannot be evaluated beforepolicy deployment. In addition, as the number of security policies continuously increases, it becomesdifficult for security O&M personnel to focus on key risky policies. The industry is in urgent needof intelligent and automated security policy management across the entire lifecycle of securitypolicies to help users quickly and efficiently complete policy changes and ensure policy deliverysecurity and accuracy, thereby effectively improving O&M efficiency and reducing O&M costs.The SecoManager Security Controller is a unified security controller provided by Huawei for differentscenarios such as DCs, campus networks, Branch. It provides security service orchestration andunified policy management, supports service-based and visualized security functions, and forms aproactive network-wide security protection system together with network devices, security devices,and Big Data intelligent analysis system for comprehensive threat detection, analysis, and response.Product AppearancesProduct HighlightsMulti-dimensional and automatic policy orchestration, security service deployment within minutes• Application mutual access mapping and application-based policy management: Policymanagement transitions from the IP address-based perspective to the application mutual access relationship-based perspective. Mutual-access relationships of applications on the network are abstracted with applications at the core to visualize your application services so that you can gain full visibility into the services, effectively reducing the number of security policies. The model-based application policy model aims to reduce your configuration workload and simplify network-wide policy management.• Policy management based on service partitions: Policy management transitions from thesecurity zone-based perspective to the service partition-based perspective. Conventional network zones are divided into security zones, such as the Trust, Untrust, DMZ, and Local zones. In a scenario with a large number of security devices and a large network scale, factors of security zone, device, policy, service rollout, and service change are intertwined, making it difficult to visualize services and to effectively guide the design of security policies. However, if security policies are managed, controlled, and maintained from the perspective of service partitions, users need to pay attention only to service partitions and security services but not the mapping among security zones, devices, and services, which effectively reduces the complexity of security policy design.Service partition-based FW1untrusttrustDMZ XXX FW2untrust trustDMZ XXX FW3untrust trust DMZ XXX InternetGuest partition R&D partition Data storage partitionExternal service partition Internal service partition• Management scope of devices and policies defined by protected network segments to facilitate policy orchestration: A protected network segment is a basic model of security service orchestration and can be considered as a range of user network segments protected by a firewall.It can be configured manually or through network topology learning. The SecoManager Security Controller detects the mapping between a user service IP address and a firewall. During automatic policy orchestration, the SecoManager Security Controller automatically finds the firewall that carries a policy based on the source and destination addresses of the policy.• Automatic security service deployment: Diversified security services bring security assurance for data center operations. Technologies such as protected network segment, automatic policy orchestration, and automatic traffic diversion based on service function chains (SFCs) enable differentiated tenant security policies. Policies can be automatically tiered, split, and combined so that you can gain visibility into policies.Intelligent policy O&M to reduce O&M costs by 80%• Policy compliance check: Security policy compliance check needs to be confirmed by the security approval owner. The average number of policies to be approved per day ranges from several to hundreds. Because the tool does not support all rules, the policies need to be manually analyzed one by one, resulting in a heavy approval workload and requiring a dedicated owner to spend hours in doing so. The SecoManager Security Controller supports defining whitelists, risk rules, and hybrid rules for compliance check. After a policy is submitted to the SecoManager Security Controller, the SecoManager Security Controller checks the policy based on the defined check rules and reports the check result and security level to the security approval owner in a timely manner.In this way, low-risk policies can be automatically approved, and the security approval owner needs to pay attention only to non-compliant policy items, improving the approval efficiency and avoiding the issues that the approval is not timely and that a risky policy is omitted.• Policy simulation: Based on the learning result of service mutual access relationships, the policies to be deployed are compared, and their deployment is simulated to assess the impact of the deployment, effectively reducing the risks brought by policy deployment to services.• Redundant policy deletion: After a policy is deployed, redundancy analysis and hit analysis are performed for policies on the entire network, and the policy tuning algorithm is used, deleting redundant policies and helping you focus on policies closely relevant to services.Network collaboration and security association for closed-loop threat handling within minutes • Collaboration with network for threat handling: In a conventional data center, application deployment often takes a long time. The application service team relies on the network team to deploy the network; the network team needs to understand the requirements of the application service team to deploy a network that is suitable for the application service team. The SecoManager Security Controller learns mappings between service policies and security policies based on the network topology, and collaborates with the data center SDN management and control system (IMaster NCE-Fabric) or campus SDN management and control system to divert tenant traffic to corresponding security devices based on SFCs on demand. The SecoManager Security Controller automatically synchronizes information about the tenants, VPCs, network topology (including logical routers, logical switches, logical firewalls, and subnets), EPGs, and SFCs from the SDN management and control system and combines the learned application service mutual access relationships to automatically orchestrate and deliver security policies, implementing security-network synergy.• Collaboration with security: Advanced persistent threats (APTs) threaten national infrastructure of the finance, energy, government, and other sectors. Attackers exploit 0-day vulnerabilities, use advanced evasion techniques, combine multiple attack means such as worm and ransomware, and may remain latent for a long period of time before they actually initiate attacks. The Big Data security product HiSec Insight can effectively identify unknown threats based on network behavior analysis and correlation analysis technologies. The threat handling method, namely isolation or blocking, is determined based on the threat severity. For north-south threats, the SecoManager Security Controller delivers quintuple blocking policies to security devices. For east-west threats, isolation requests are delivered to the network SDN management and control system to control switches or routers to isolate threatened hosts.Product Deployment• Independent deployment: The SecoManager Security Controller is deployed on a server or VM as independent software.• Integrated deployment: The SecoManager Security Controller and SDN management and control system are deployed on the same physical server and same VM.Database• Collaboration with the SDN management and control system to detect network topology changes and implement tenant-based automatic security service deployment.• North-south threat blocking, east-west threat isolation, and refined SDN network security control through SFC-based traffic diversion.• Interworking with the cloud platform to automatically convert service policies to security policies. Product SpecificationsOrdering InformationNote: This product ordering list is for reference only. For product subscription, please consult Huawei representatives. GENERAL DISCLAIMERThe information in this document may contain predictive statement including, without limitation, statements regarding the future financial and operating results, future product portfolios, new technologies, etc. There are a number of factors that could cause actual results and developments to differ materially from those expressed or implied in the predictive statements. Therefore, such information is provided for reference purpose only and constitutes neither an offer nor an acceptance. Huawei may change the information at any time without notice.Copyright © 2020 HUAWEI TECHNOLOGIES CO., LTD. All Rights Reserved.。
精益生产词汇

精益生产专业词汇解释A3 Report ||A3报告A-B Control ||A-B控制Act||行动Andon ||信号灯Apparent Efficiency||表面效率Automatic Line Stop ||自动停止生产线Batch and Queue ||批量生产Batch and Queue||批量与队列breakthrough kaizen||突破性改善Buffer Stock ||缓冲库存Capital Linearity ||线性化的设备投资Capital Linearity||投资线性化Cell ||生产单元Chaku-Chaku ||一步接一步Change Agent ||实施改变的领导者Changeover ||换模Check||检查Chief Engineer ||总工程师Continuous Flow||连续流Cross-dock||交叉货仓Cycle Time ||周期时间Demand Amplification||需求扩大Design-In ||共同设计Do||实施Downtime ||停工期Effective Machine Cycle Time||有效机器周期时间Efficiency ||效率EPEx||生产批次频率Error-Proofing||预防差错Every Product Every Interval ||EPEx ||生产批次频率Fill-Up System ||填补系统Finished Goods||成品First In, First Out ||FIFO ||先进先出Five Whys ||五个“为什么”Fixed-Position Stop System ||固定工位来停止生产Fixed-Position Stop System||固定位置停止系统Flow Production ||流水线生产Four Ms ||四MGemba||现场Greenfield ||新建工厂Heijunka ||均衡化Heijunka Box||生产均衡柜Heijunka||均衡化Inspection||检查Inventory ||库存Inventory Turns ||库存周转率Jidoka ||自动化Jishuken||自主研修JIT||及时生产job breakdown||任务细分书job element||工作要点书Just-In-Time||及时生产Kaikaku ||突破性改善Kaizen ||改善Kaizen Workshop ||改善研习会Kaizen||改善Kanban ||看板Labor Linearity||人力线性化Lean Enterprise ||精益企业Lean Logistics ||精益物流Lean Production ||精益生产Local Efficiency||局部效率Machine Cycle Time||机器周期时间Mass Production||大规模制造Material Flow||材料流Material Flow||物料流Mixed Supermarket and Sequential Pull System||库存超市与顺序拉动混合系统Monuments||大型装备Muda||浪费Multi-Process Handling||多工序操作Non Value-Creating ||非增值Non Value-Creating Time||非增值时间One-Piece Flow||单件流。
低频活动漂浮潜水船声探测系统(LFATS)说明书

LOW-FREQUENCY ACTIVE TOWED SONAR (LFATS)LFATS is a full-feature, long-range,low-frequency variable depth sonarDeveloped for active sonar operation against modern dieselelectric submarines, LFATS has demonstrated consistent detection performance in shallow and deep water. LFATS also provides a passive mode and includes a full set of passive tools and features.COMPACT SIZELFATS is a small, lightweight, air-transportable, ruggedized system designed specifically for easy installation on small vessels. CONFIGURABLELFATS can operate in a stand-alone configuration or be easily integrated into the ship’s combat system.TACTICAL BISTATIC AND MULTISTATIC CAPABILITYA robust infrastructure permits interoperability with the HELRAS helicopter dipping sonar and all key sonobuoys.HIGHLY MANEUVERABLEOwn-ship noise reduction processing algorithms, coupled with compact twin line receivers, enable short-scope towing for efficient maneuvering, fast deployment and unencumbered operation in shallow water.COMPACT WINCH AND HANDLING SYSTEMAn ultrastable structure assures safe, reliable operation in heavy seas and permits manual or console-controlled deployment, retrieval and depth-keeping. FULL 360° COVERAGEA dual parallel array configuration and advanced signal processing achieve instantaneous, unambiguous left/right target discrimination.SPACE-SAVING TRANSMITTERTOW-BODY CONFIGURATIONInnovative technology achievesomnidirectional, large aperture acousticperformance in a compact, sleek tow-body assembly.REVERBERATION SUPRESSIONThe unique transmitter design enablesforward, aft, port and starboarddirectional transmission. This capabilitydiverts energy concentration away fromshorelines and landmasses, minimizingreverb and optimizing target detection.SONAR PERFORMANCE PREDICTIONA key ingredient to mission planning,LFATS computes and displays systemdetection capability based on modeled ormeasured environmental data.Key Features>Wide-area search>Target detection, localization andclassification>T racking and attack>Embedded trainingSonar Processing>Active processing: State-of-the-art signal processing offers acomprehensive range of single- andmulti-pulse, FM and CW processingfor detection and tracking. Targetdetection, localization andclassification>P assive processing: LFATS featuresfull 100-to-2,000 Hz continuouswideband coverage. Broadband,DEMON and narrowband analyzers,torpedo alert and extendedtracking functions constitute asuite of passive tools to track andanalyze targets.>Playback mode: Playback isseamlessly integrated intopassive and active operation,enabling postanalysis of pre-recorded mission data and is a keycomponent to operator training.>Built-in test: Power-up, continuousbackground and operator-initiatedtest modes combine to boostsystem availability and accelerateoperational readiness.UNIQUE EXTENSION/RETRACTIONMECHANISM TRANSFORMS COMPACTTOW-BODY CONFIGURATION TO ALARGE-APERTURE MULTIDIRECTIONALTRANSMITTERDISPLAYS AND OPERATOR INTERFACES>State-of-the-art workstation-based operator machineinterface: Trackball, point-and-click control, pull-down menu function and parameter selection allows easy access to key information. >Displays: A strategic balance of multifunction displays,built on a modern OpenGL framework, offer flexible search, classification and geographic formats. Ground-stabilized, high-resolution color monitors capture details in the real-time processed sonar data. > B uilt-in operator aids: To simplify operation, LFATS provides recommended mode/parameter settings, automated range-of-day estimation and data history recall. >COTS hardware: LFATS incorporates a modular, expandable open architecture to accommodate future technology.L3Harrissellsht_LFATS© 2022 L3Harris Technologies, Inc. | 09/2022NON-EXPORT CONTROLLED - These item(s)/data have been reviewed in accordance with the InternationalTraffic in Arms Regulations (ITAR), 22 CFR part 120.33, and the Export Administration Regulations (EAR), 15 CFR 734(3)(b)(3), and may be released without export restrictions.L3Harris Technologies is an agile global aerospace and defense technology innovator, delivering end-to-endsolutions that meet customers’ mission-critical needs. The company provides advanced defense and commercial technologies across air, land, sea, space and cyber domains.t 818 367 0111 | f 818 364 2491 *******************WINCH AND HANDLINGSYSTEMSHIP ELECTRONICSTOWED SUBSYSTEMSONAR OPERATORCONSOLETRANSMIT POWERAMPLIFIER 1025 W. NASA Boulevard Melbourne, FL 32919SPECIFICATIONSOperating Modes Active, passive, test, playback, multi-staticSource Level 219 dB Omnidirectional, 222 dB Sector Steered Projector Elements 16 in 4 stavesTransmission Omnidirectional or by sector Operating Depth 15-to-300 m Survival Speed 30 knotsSize Winch & Handling Subsystem:180 in. x 138 in. x 84 in.(4.5 m x 3.5 m x 2.2 m)Sonar Operator Console:60 in. x 26 in. x 68 in.(1.52 m x 0.66 m x 1.73 m)Transmit Power Amplifier:42 in. x 28 in. x 68 in.(1.07 m x 0.71 m x 1.73 m)Weight Winch & Handling: 3,954 kg (8,717 lb.)Towed Subsystem: 678 kg (1,495 lb.)Ship Electronics: 928 kg (2,045 lb.)Platforms Frigates, corvettes, small patrol boats Receive ArrayConfiguration: Twin-lineNumber of channels: 48 per lineLength: 26.5 m (86.9 ft.)Array directivity: >18 dB @ 1,380 HzLFATS PROCESSINGActiveActive Band 1,200-to-1,00 HzProcessing CW, FM, wavetrain, multi-pulse matched filtering Pulse Lengths Range-dependent, .039 to 10 sec. max.FM Bandwidth 50, 100 and 300 HzTracking 20 auto and operator-initiated Displays PPI, bearing range, Doppler range, FM A-scan, geographic overlayRange Scale5, 10, 20, 40, and 80 kyd PassivePassive Band Continuous 100-to-2,000 HzProcessing Broadband, narrowband, ALI, DEMON and tracking Displays BTR, BFI, NALI, DEMON and LOFAR Tracking 20 auto and operator-initiatedCommonOwn-ship noise reduction, doppler nullification, directional audio。
prometheus deployment指标

prometheus deployment指标英文版Prometheus Deployment MetricsIn the world of monitoring and observing the performance of IT infrastructure, Prometheus stands out as a popular open-source monitoring and alerting toolkit. It is widely used for collecting and storing metrics from various sources, enabling real-time monitoring and analysis. Prometheus's deployment metrics are crucial for understanding the health, stability, and efficiency of the deployed applications or services.1. Deployment Metrics OverviewDeployment metrics provide insights into the deployment process, including the success or failure of deployments, the duration of deployments, resource utilization during deployments, and more. These metrics are crucial for understanding the impact of deployments on the overall system performance.2. Key Metrics for Prometheus DeploymentDeployment Duration: Measures the time taken for a deployment to complete. This metric helps identify bottlenecks and optimize the deployment process.Deployment Success Rate: Indicates the percentage of successful deployments compared to the total number of deployments. A low success rate might indicate issues with the deployment pipeline or the target environment.Resource Utilization: Monitors the CPU, memory, and disk usage during deployments. High resource utilization might indicate performance issues or insufficient resources.Error Rates: Tracks the number of errors encountered during deployments. This metric helps identify common deployment issues and improve deployment reliability.Rollback Rate: Measures the frequency of rollbacks due to deployment failures. A high rollback rate might suggest a need for more robust deployment strategies or better testing procedures.3. Benefits of Monitoring Deployment MetricsImproved Visibility: Monitoring deployment metrics provides a clear picture of the deployment process, enabling quick identification of issues and bottlenecks.Enhanced Reliability: By tracking error rates and rollback rates, teams can improve the reliability of their deployment processes.Optimized Performance: Understanding resource utilization during deployments helps optimize the deployment process, ensuring efficient resource allocation.4. ConclusionPrometheus deployment metrics are essential for monitoring and improving the deployment process. By tracking key metrics like deployment duration, success rate, resource utilization, error rates, and rollback rate, teams can ensure reliable, efficient, and optimized deployments. This, in turn, leads to improved system performance and a better user experience.中文版Prometheus部署指标在监控和观察IT基础设施性能的领域中,Prometheus是一个流行的开源监控和告警工具集。
Silk Central 测试管理软件说明书
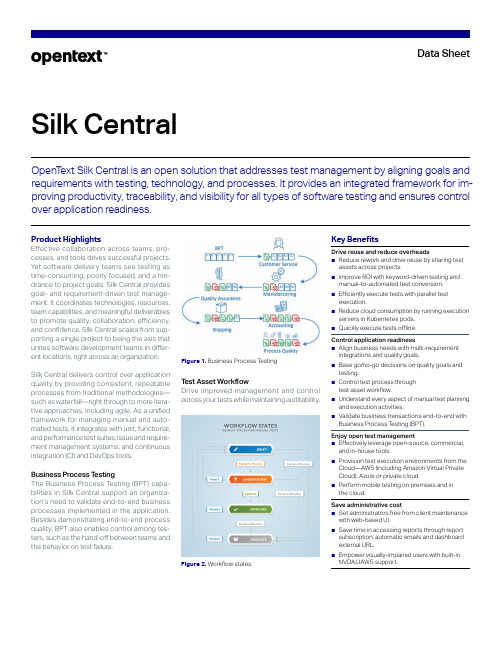
Silk CentralOpenT ext Silk Central is an open solution that addresses test management by aligning goals and requirements with testing, technology, and processes. It provides an integrated framework for im-proving productivity, traceability, and visibility for all types of software testing and ensures control over application readiness.Product HighlightsEffective collaboration across teams, pro-cesses, and tools drives successful projects.Yet software delivery teams see testing astime-consuming, poorly focused, and a hin-drance to project goals. Silk Central providesgoal- and requirement-driven test manage-ment. It coordinates technologies, resources,team capabilities, and meaningful deliverablesto promote quality, collaboration, efficiency,and confidence. Silk Central scales from sup-porting a single project to being the axis thatunites software development teams in differ-ent locations, right across an organization. Silk Central delivers control over application quality by providing consistent, repeatable processes from traditional methodologies—such as waterfall—right through to more itera-tive approaches, including agile. As a unified framework for managing manual and auto-mated tests, it integrates with unit, functional, and performance test suites; issue and require-ment management systems; and continuous integration (CI) and DevOps tools. Business Process T estingThe Business Process Testing (BPT) capa-bilities in Silk Central support an organiza-tion’s need to validate end-to-end business processes implemented in the application. Besides demonstrating end-to-end process quality, BPT also enables control among tes-ters, such as the hand-off between teams and the behavior on test failure.Figure 1. Business Process T estingT est Asset WorkflowDrive improved management and controlacross your tests while maintaining auditability.Figure 2. Workflow statesData SheetData Sheet Silk CentralT ransition tests through a review process from Draft, Under Review, to Approved state with full audit control at each stage, and use dedi-cated role permissions to control the process. Redundant tests can be marked as Obsolete at any stage of the workflow, ready for final review before deletion.Collaboration Using Microsoft T eamsThe integration of Silk Central with Microsoft T eams provides a means of team collaboration for manual testers working together on a proj-ect. A set of predefined actions trigger mes-sages to be sent to Microsoft T eams. These messages deliver the crucial information and links to jump to the relevant items in Silk Central or to perform the next steps.Client and Project StructureSilk Central supports your diverse needs, and the scales of deployment, by using clients (dis-tinct units within a Silk Central instance) to sup-port a multi-tenancy structure. This enables organizations to separate projects by clients while maintaining security and control, with additional ability to manage license allocation, e ither within a single database or across mul-tiple database instances.Key FeaturesRequirement ManagementMANAGE REQUIREMENTS FROMMULTIPLE SOURCESSilk Central enables you to unite requirements, regardless of source, into a single project. Achieve a centralized end-to-end view in one location to enhance collaboration and control across your project.TEST AGILE REQUIREMENTSSilk Central offers strong integrations with leading agile planning and tracking tools such as Atlassian Jira Agile. Silk Central manual e xecution planning supports agile develop-ment through progress reporting, burndown charts, planning, and personal dashboards. Optimized to test both agile and traditional re-quirements, Silk Central accelerates test ex-ecution and increases collaboration on qualityassurance activities.MITIGATE RISK USING QUALITY GOALSSilk Central helps testers prioritize, execute,and demonstrate how their efforts respondto risk-based and requirement-driven test-ing. Silk Central reports illustrate how test-ing has responded to these defined qualitygoals, ultimately enabling the critical go/no-go decision.T est Design and Asset ManagementKEYWORD-DRIVEN TESTINGKeyword-driven testing closely couples SilkCen t ral management with Selenium or Silk T estautomation capabilities:■Involve different professional groups in thetest automation process by separatingtest design and implementation.■Achieve maintenance benefits by reusingtest code or keywords, and enjoy the easyabstraction of low-level automation andhigh-level business scenarios throughmulti-level keyword sequences.■Enable a seamless transition from manualto automated testing by basing keywordtests on current manual test steps.■Get recommended keywords based on theautomatic analysis of existing keyword-driven tests when creating a new test.SHARE TEST ASSETS ACROSS PROJECTSDrive improved reuse and lower maintenanceoverheads by sharing tests across projects.Defining a central test repository and enablingprojects to reference tests in it improves pro-cess and practice within your organization.REUSABILITY AND MAINTAINABILITYOF ASSETSSilk Central efficiently maintains and re-uses test assets. Mandatory Attributes andMandatory Properties help standardize datausage to ensure they are always used in as-set creation. Use the Global List attributesto centrally maintain a set of items and usethem in multiple projects. This enables datastandardization and increases reusability andmaintainability across requirements, tests, andexecution plans. Utilize Linked Fields for man-agement of related fields to reduce the likeli-hood of wrong input and User List attributes toautomatically populate tests or execution plansto project users.T est Planning and ExecutionADVANCED MANUAL EXECUTION PLANNINGSilk Central increases efficiency and productiv-ity by making it easy to identify, plan, and sched-ule manual tests. It allows users to decide:■What to test through quality goals andfilters■When to test by planning test cycleswithin specified timeframes■Where to test by choosing which systemsor configurations to use■Who to test by allocating based onresource and time capacityPARALLEL TEST EXECUTIONSOrganizations need efficient test execution.The parallel testing capabilities within SilkCentral execute automated tests across ev-ery execution server (physical or virtual) at thesame time—reducing overall test time anddriving project efficiency. Silk Central providesusers with the flexibility to decide what to ex-ecute in parallel and what not to.KUBERNETES PLUGINReduce resource consumption and cost bymaking Kubernetes pods available for test ex-ecution as virtual execution servers.MOBILE TESTING■Execute mobile device testing withUFT Digital Lab and Silk T est Workbenchintegration, including automated functionaltests and manual tests.■Use Silk Central when manually testing mobile applications. It mirrors the mobile device on your desktop for convenient interaction with remote test devices.■Enjoy the flexible scheduling control of manual and automated tests as if any remote iOS or Android device were connected locally. T est teams can also select mobile test devices using multiple filtering options, including device type, platform, application, or device name.TESTING FROM EVERY ANGLEIntegration with many testing tools means Silk Central offers coverage of every angle of your application through unit, functional, and perfor-mance testing, whether manual or automated. ■Unit T est: JUnit, NUnit, UFT Developer■Functional T est: UFT One, Silk T est■Performance T est: Silk Performer, LoadRunner Professional■Regression T est: UFT One, Silk T est■Any T est: The ProcessExecutor test type can be used to execute any script from command line.CODE AND CONFIGURATION COVERAGESilk Central helps identify functionality gaps in current test definitions by providing code cov-erage analysis for manual and automated tests for .NET or Java apps.Configuration testing ensures test scripts exe-cuted against multiple configurations need no duplication, providing script reuse and report-ing on coverage of test environments.EXECUTION SNAPSHOTExporting the ‘Document View’ of the Execution Planning unit to Microsoft Excel creates a snapshot of execution status and progress for management, analytics, and reporting. Filters, sorting, grouping and order settings of the col-umns in DocumentView are also applied to the exported data.T racking and ReportingTESTBOOK: INSIGHT INTO MANUAL TESTSThe T estbook delivers real-time updates onall activities during manual testing. It simplifiescollaboration among testers and test manag-ers by displaying who did what and when.SIDE-BY-SIDE RESULTS COMPARISONFOR AUTOMATED TESTSUse side-by-side result analysis for fast in-sight into the status of automated test runs.Compare runs using visual reports showingthe execution status across every individualconfiguration.TEST RESULT CONSOLIDATIONImprove result analysis by extending test ex-ecution tooling eco-systems:■Consume results for automated teststhat are executed outside of Silk Centralexecution servers.■Collect all artifacts—such as requirements,tests, and results—in a single repositoryfor holistic reporting and decision-making.REPORTING AND ANAL YTICSUse the reports to view a full audit status ofmanual test results and associated defects.Y ou can also trace issues raised, associated re-sult files, and progress status in a format view-able online or exported to a PDF. Use video andscreen capture for manual and automated testactivities to reproduce issues and compile evi-dence to support compliance and audit needs.As well as rich metrics and analytics avail-able through default reports, Silk CentralFigure 3. User defined dashboardaccommodates custom reporting needs. Itsupports Microsoft Word and BIRT for ad-vanced reporting and can export data to PDFor Microsoft Excel.BUILT-IN ISSUE TRACKINGUse the built-in issue tracking capabilities toraise, track, and manage issues against testassets and a defined workflow relevant to yourorganization.UsabilityADVANCED MANUAL TEST INTERFACEThis web-based interface requires no installa-tion and needs little or no training. Users canexecute tests and capture evidence to supporttest execution with screenshots, videos, au-dios, result files, code coverage, and defects.FACILITATE ACCESSIBILITY NEEDSBy supporting keyboard navigation and fa-cilitating audible feedback through a screenreader, Silk Central is accessible for blind orvisually impaired users. It supports both NVDAand JAWS.SIMPLIFY USER MAINTENANCE WITHLDAP OR ACTIVE DIRECTORY (AD)Automatically create and authenticate users ondemand. Eliminate the need to manually cre-ate accounts for users who are interested orinvolved in test activities with Silk Central.Supported IntegrationsFigure 4. Silk Central integrations landscapeINTEGRATIONS VIA OPENTEXT CONNECTThe OpenT ext Connect portfolio of integrations provides extensive integration capabilities. Its Silk Central T est Manager Connector simpli-fies integration setup, optimizes require m ent synchronization performance, and enables better visibility into test asset relationships and traceability between tests and defects. INTEGRATIONS VIA SILK CENTRAL APISilk Central offers SOAP-based Web Services for the integration of third-party applications, as well as a REST API for managing results of external execution plan runs.OPENTEXT SOFTWARE INTEGRATIONS■Silk Performer■LoadRunner Professional■Silk T est■UFT One■UFT Developer■StarT eam■AccuRev■Silk T estPartner■Atlas■Deployment Automation■Release Control■Solutions Business Manager ■UFT Mobile■OpenT ext Connect■Jenkins, Hudson■Microsoft TFS■SeleniumTHIRD-PARTY SOFTWARE INTEGRATIONS■IBM DOORS, DOORS Next Generation■Bugzilla■Atlassian Jira and Jira Agile■JUnit and NUnit■Subversion■Git■T eam Foundation Server■Microsoft Office Word and Excel■Microsoft T eams■Amazon and Azure Cloud execution■Kubernetes■Apache Commons Virtual File System (VFS)■Microsoft Visual Studio/Visual Studio T estAgent■Plug-in API for additional integrations Please consult your OpenT ext account repre-sentative for supported versions and additional integrations.System RequirementsOperating System Support■W indows Server 2016, 2019Additional for Mobile Device T esting■A ndroid 5.x, 6.x, 7.x, 8.x, 9.x and 10.x■i OS 10.x,11.x, 12.x and 13.xAdditional for Execution Server■W indows 8.1 (32/64bit), Windows 10 (32/64bit)■U buntu, Red Hat Enterprise Linux, Debian, SUSE Linux Web Server Support■I IS 8, 10 (32/64Bit)■S tandalone web server (T omcat)Web Browser Support■I nternet Explorer 11 or later (no compatibility mode), Mozilla Firefox, Google Chrome,Microsoft EdgeDatabase Support■M icrosoft SQL Server 2016 SP2, 2017, 2019■Oracle 19cPlease refer to Installation and System Con fi guration Help in Silk Central documentation for fur-ther details.。
EXFO 2000 系列以太网测试仪 中文说明书

S P E C S H E ETKEY FEATURES AND BENEFITSAccelerate Ethernet service activation with bidirectional EtherSAM (Y .156) and RFC 2544 test suites, multistream traffi c generation, Through mode and bit-error-rate (BER) testing Experience unprecedented confi guration simplicity with hybrid touchscreen/keypad navigation and data entry Increase technician autonomy and productivity with intelligent discovery of remote EXFO Ethernet testers, as well as in-service testing via dual-port Through mode Eliminate errors in data interpretation with revolutionary new GUI on 7-inch TFT screen, historical event logger, visual gauges and 3D-icon depictions of pass/fail outcomesSimplify reporting with integrated Wi-Fi and Bluetooth connectivity capabilitiesIntegrated applications to test VoIP services, and additional IP test utilities including VLAN scan and LAN discovery via EXpert VoIP and EXpert IP test toolsSupport for packet capture and analysis, wireless troubleshooting and TCP throughput testingExtend fi eld testing operations with compact, lightweight platform equipped with long-duration battery packFTB-860 NetBlazer Series Ethernet TestersPOWERFUL, FAST, INTUITIVE ETHERNET TESTINGeld technicians comprehensive, yet simple test suites to quickly and easily turn up, validate and troubleshoot Ethernet services, with full EtherSAM capabilities, from 10 Mbit/s to 10 Gbit/s.EXFO FTB-1 FTB-860G SpecsProvided by THE ULTRA-PORTABLE CHOICE FOR HIGH-SPEED ETHERNET TESTINGThe ongoing deployment of GigE and 10 GigE circuits across access and metro networks demands a testing solution that seamlessly adapts to either operating environment—without sacrificing portability, speed or cost—in order to guarantee the performance and quality of service (QoS) metrics of these services.Leveraging the powerful, intelligent FTB-1 handheld platform, the NetBlazer series streamlines processes and empowers field technicians to seamlessly transition between 10/100/1000/10000 interfaces to rapidly adapt to a variety of networking environments.Powerful and FastThe NetBlazer series is a portfolio of fully integrated 10 Mbit/s to 10 Gbit/s handheld Ethernet testers. Available in three hardware configurations, each FTB-860x offers the industry’s largest TFT screen with unprecedented configuration simplicity via hybrid touchscreen/keypad navigation. Platform connectivity is abundant via Wi-Fi, Bluetooth, Gigabit Ethernet or USB ports, making it accessible in any environment.FTB-860G: 10 M BIT /S TO 10 G BIT/SIf the need is for full Ethernet coverage from 10 Mbit/s up to 10 Gbit/s, › 10 Base-T to 10 gigabit testing› IPv6 testingFTB-860: GIGABIT ETHERNETIf the need is purely for Gigabit Ethernet coverage, then the FTB-860 is › 10 Base-T to 1 gigabit testing› IPv6 testingFTB-860GL: 10 M BIT/S TO 10 G BIT/S LOOPBACK ONLYCombined with the FTB-860G or FTB-860, the FTB-860GL is the most cost-effective solution for GigE and 10 GigE intelligent loopback testing; it supports bidirectional EtherSAM and RFC 2544 testing and offers five › 10 Base-T to 10 gigabit loopback› EtherSAM (bidirectional partner)*› RFC 2544 (bidirectional partner)› Intelligent autodiscovery› IPv6 testing› Ping/traceroute* Contact your EXFO representative to confirm availability.Setting a New GUI Standard: Unprecedented Simplicity in Configuration Setup and NavigationIntelligent Situational Configuration Setup›G uides technicians through complete, accurate testingprocesses(suggestion prompts, help guides, etc.)›R educes navigation by combining associated testingfunctions on a single screen›I ntelligent autodiscovery allows a single technician to performend-to-end testingDedicated Quick-Action Buttons›Remote discovery to fi nd all the other EXFO units›Laser on/off›T est reset to clear the results and statistics while running a test ›Report generation›Save or load test confi gurations›Quick error injectionAssorted Notifications›Clear indication of link status for single or dual ports›Negotiated speed display for single or dual ports›O ptical power status available at all times for single or dual ports›Pass/fail indication at all times for all testsStreamlined Navigation›R emote discovery button available at all times; no reason to leave your current location to scan for a remote unit›T esting status can be maximized to fi ll the entire screen by simply clicking on the alarm status button; whether the unit is in your hand or across the room, test results can be easily determined with a simple glance at the display screen›R FC 2544 configuration is maximized in a single page;no need to navigate through multiple screens to confiindividual subtests›R FC 2544 results and graphs are also maximized in a single page; no need to navigate through multiple screens to viewindividual RFC subtest results FO unitswhile running a testdual portsal portstimes for single mes; no reason toemote unite entire screen by ; whether the unit sults can be easily splay screenn a single page; eens to confi gure ximized in a single e screens to viewRAPID, ACCURATE TEST RESULTS AT YOUR FINGERTIPSKey FeaturesIntelligent Network Discovery ModeUsing any NetBlazer series test set, you can single-handedly scan the network and connect to any available EXFO datacom remote tester. Simply select the unit to be tested and choose whether you want traffic to be looped back via Smart Loopback or Dual Test Set for simultaneous bidirectional EtherSAM and RFC 2544 results. No more need for an additional technician at the far end to relay critical information—the NetBlazer products take care of it all.Smart Loopback FlexibilityThe Smart Loopback functionality has been enhanced to offer five distinct loopback modes. Whether you are looking to pinpoint loopback traffic from a UDP or TCP layer, or all the way down to a completely promiscuous mode (Transparent Loopback mode), NetBlazer has the flexibility to adjust for all unique loopback situations.Global Pass/Fail AnalysisThe NetBlazer series provides real-time pass/fail status via text or icons. Clicking on the pass/fail indicator maximizes this important status to full screen, providing instant, easily understood notification whether the unit is in the technician’s hands or across the room.Remembering the Last IP or MAC AddressesField technicians have enough things to worry about and don’t always have the luxury of time to enter the same IP or MAC address test after test. The NetBlazer series remembers the last 10 MAC, IPv4 and IPv6 addresses as well as J0/J1 traces for 10G WAN, even afterthe unit has been rebooted.Traffic GenerationUnparalleled analog visual gauges combined with user-defined thresholds show instantaneously whether or not the test traffic is in or out of expected ranges.Additionally, bandwidth and frame size can be modified on-the-fly without navigating away to a different page, giving technicians instantaneous reaction on the gauges. Traffic generation brings together over 10 critical stats in a very visual and organizedfashion, ensuring that technicians can quickly and easily interpret the outcome of the test.The analog gauges are lined with Green and Red layers to represent the expected thresholds.Real-time bandwidth and frame-size adjustment.Overall pass/fail assessment.Throughput, jitter and latency with visual pass/fail thresholds,analog gauges and digitalreadouts.Frame loss and out-of-sequence notification.Multistream ConfigurationConfiguring multiple streams with proper COS and QOS bits can be a complex task. NetBlazer makes it simpler, with all streams easily selectable and configurable from one location. With large icons located throughout the stream pages, configuration becomes as simple as a touch of a finger. Technicians can define one configuration profile and apply it to all the background streams simultaneously. From there, it is just a matter of making slight tweaks as needed rather than complete configuration profiles per stream.Through ModeThrough mode testing consists of passing traffic through either of the NetBlazer’s two 100/1000 Base-X ports or the two 10/100/1000 Base-T ports for in-service troubleshooting of live traffic between the carrier/service provider network and the customer network. Through mode allows technicians to access circuits under test without the need for a splitter.Supporting 10 Gigabit EthernetThe 10 G igabit Ethernet interface is available in both 10 G igE LAN and 10 G igE WAN modes via a single SFP+ transceiver. All Ethernet testing applications—from BER testing to the full EtherSAM suite—are available for both IPv4 and IPv6. Unique to the 10 GigE WAN interface is the ability to send and monitor SONET/SDH J0/J1 traces and the path signal label (C2). The WAN interface can also monitor SONET and SDH alarms and errors.E THER SAM: THE NEW STANDARD IN ETHERNET TESTINGUntil now, RFC 2544 has been the most widely used Ethernet testing methodology. However it was designed for network device testing in the lab, not for service testing in the field. ITU-T Y.156sam is the newly introduced draft standard for turning up and troubleshooting carrier Ethernet services. It has a number of advantages over RFC 2544, including validation of critical SLA criteria such as packet jitter and QoS measurements. This methodology is also significantly faster, therefore saving time and resources while optimizing QoS.EXFO’s EtherSAM test suite—based on the draft ITU-T Y.156sam Ethernet service activation methodology—provides comprehensive field testing for mobile backhaul and commercial services.Contrary to other methodologies, EtherSAM supports new multiservice offerings. It can simulate all types of services that will run on the network and simultaneously qualify all key SLA parameters for each of these services. Moreover, it validates the QoS mechanisms provisioned in the network to prioritize the different service types, resulting in better troubleshooting, more accurate validation and much faster deployment. EtherSAM is comprised of two phases, the network configuration test and the service test.Network Configuration TestThe network configuration test consists of sequentially testing each service. It validates that the service is properly provisioned and that all specific KPIs or SLA parameters are met.Service TestOnce the configuration of each individual service is validated, the service test simultaneously validates the quality of all the services over time.EtherSAM Bidirectional ResultsEXFO’s EtherSAM approach proves even more powerful as it executes the complete ITU-T Y.156sam test with bidirectional measurements. Key SLA parameters are measured independently in each test direction, thus providing 100 % first-time-rightservice activation—the highest level of confidence in service testing.EX PERT TEST TOOLSEXpert Test Tools is a series of platform-based software testing tools that enhance the value of the FTB-1 platform, providing additional testing capabilities without the need for additional modules or units.The EXpert VoIP Test Tools generates a voice-over-IP call directly from the test platform to validateperformance during service turn-up and troubleshooting.›Supports a wide range of signaling protocols, including SIP, SCCP, H.248/Megaco and H.323 ›Supports MOS and R-factor quality metrics› Simplifies testing with configurable pass/fail thresholds and RTP metricsThe EXpert IP Test Tools integrates six commonly used datacom test tools into one platform-based application to ensure field technicians are prepared for a wide-range of testing needs. › Rapidly perform debugging sequences with VLAN scan and LAN discovery› Validate end-to-end ping and traceroute› Verify FTP performance and HTTP availabilityTEST TOOLS IPEXpert TEST TOOLS VoIPOPTICAL INTERFACESTwo ports: 100M and GigEAvailable wavelengths (nm)850, 1310 and 1550100 Base-FX100 Base-LX1000 Base-SX1000 Base-LX1000 Base-ZX1000 Base-BX10-D1000 Base-BX10-USFP+ OPTICAL INTERFACES (10G)10G Base-SR/SW10G Base-LR/LW 10G Base-ER/EW Wavelength (nm)85013101550Tx level (dBm)–5 to –1–8 to 0.5–4.7 to 4.0SPECIFICATIONSELECTRICAL INTERFACESTwo ports: 10/100 Base-T half/full duplex, 1000 Base-T full duplexGENERAL SPECIFICATIONSSize (H x W x D)130 mm x 36 mm x 252 mm (5 1/8 in x 1 7/16 in x 9 15/16 in)Weight (with battery) 0.58 kg (1.3 lb)TemperatureTESTINGEtherSAM (Y.156sam)Network configuration and service test as per ITU-T Y.156sam. Tests can be performed using remote loopback orADDITIONAL FEATURESOptical power measurement Supports optical power measurement at all times; displayed in dBm.UPGRADESFTB-8590SFP modules GigE/FC/2FC at 850 nm, MM, <500 mEXFO is certified ISO 9001 and attests to the quality of these products. This device complies with Part 15 of the FCC Rules. Operation is subject to the following two conditions: (1) this device may not cause harmful interference, and (2) this device must accept any interference received, including interference that may cause undesired operation. EXFO has made every effort to ensure that the information contained in this specification sheet is accurate. However, we accept no responsibility for any errors or omissions, and we reserve the right to modify design, characteristics and products at any time without obligation. Units of measurement in this document conform to SI standards and practices. In addition, all of EXFO’s manufactured products are compliant with the European Union’s WEEE directive. For more information, please visit /recycle. Contact EXFO for prices and availability or to obtain the phone number of your local EXFO distributor. For the most recent version of this spec sheet, please go to the EXFO website at /specs .In case of discrepancy, the Web version takes precedence over any printed literature.EXFO Corporate Headquarters > 400 Godin Avenue, Quebec City (Quebec) G1M 2K2 CANADA | Tel.: +1 418 683-0211 | Fax: +1 418 683-2170 |*************Toll-free: +1 800 663-3936 (USA and Canada) | EXFO America 3701 Plano Parkway, Suite 160Plano, TX 75075 USA Tel.: +1 800 663-3936 Fax: +1 972 836-0164 EXFO Asia 151 Chin Swee Road, #03-29 Manhattan House SINGAPORE 169876Tel.: +65 6333 8241 Fax: +65 6333 8242EXFO China 36 North, 3rd Ring Road East, Dongcheng District Beijing 100013 P. R. CHINATel.: + 86 10 5825 7755 Fax: +86 10 5825 7722Room 1207, Tower C, Global Trade Center EXFO Europe Omega Enterprise Park, Electron Way Chandlers Ford, Hampshire S053 4SE ENGLAND Tel.: +44 2380 246810 Fax: +44 2380 246801EXFO NetHawkElektroniikkatie 2 FI-90590 Oulu, FINLAND Tel.: +358 (0)403 010 300 Fax: +358 (0)8 564 5203EXFO Service Assurance270 Billerica RoadChelmsford, MA 01824 USATel.: +1 978 367-5600Fax: +1 978 367-5700FTB-860 NetBlazer Series Ethernet TestersORDERING INFORMATIONSPFTB860Series.1AN© 2010 EXFO Inc. All rights reserved.Printed in Canada 10/09FTB-860G-XX -XX -XXNotesa. Requires purchase of SFP.b. Requires purchase of SFP+.。
单线激光雷达agv的工作原理

单线激光雷达agv的工作原理Laser navigation plays a crucial role in the functionality of single-line AGVs. This technology utilizes a laser sensor mounted on the AGV to scan its surroundings and create a map of the environment. These maps are then used to guide the AGV along its intended path, allowing for precise and autonomous navigation.激光导航在单线AGV的功能中起着至关重要的作用。
该技术利用安装在AGV上的激光传感器扫描周围环境,并创建环境地图。
然后利用这些地图来引导AGV沿着其预定路径行驶,实现精确和自主的导航。
One of the key advantages of laser navigation for single-line AGVs is its ability to accurately detect and avoid obstacles. The laser sensor is capable of detecting objects in its path and adjusting the AGV'sroute accordingly. This allows for safe and efficient operation in dynamic environments, where obstacles may appear unexpectedly.激光导航对于单线AGV的一个关键优势是其能够精确地检测和避开障碍物。
激光传感器能够检测到路径上的物体,并相应调整AGV的行驶路线。