Actix Analyzer LTE 用户手册(2014)
Keysight EXA X-Series Signal Analyzer 数据手册说明书

N9010AK-1CM N9010AK-DVR N9010AK-EA3KeysightEXA X-Series Signal AnalyzerN9010A10 Hz to 3.6, 7.0, 13.6, 26.5, 32, or 44 GHzData SheetThis data sheet is a summary of the specifications and conditions for EXA signal analyzers. For the complete specifications guide, visit: /find/exa_specifications Balance the Challenges Whether you’re focused on time-to-market, time-to-volume, or cost of test, your choice of economy class signal analyzer should help you save both time and money. That’s the idea that drives the Keysight EXA signal analyzer—and it’s the fastest way to maximize throughputon the production line. From measurement speed to code compatibility, it makes every millisecond count and helps reduce your overall cost of test.Table of ContentsDefinitions and Conditions (3)Frequency and Time Specifications (4)Amplitude Accuracy and Range Specifications (6)Dynamic Range Specifications (9)PowerSuite Measurement Specifications (16)General Specifications (17)Inputs and Outputs (18)I/Q Analyzer (20)Related Literature (21)Get More InformationThis EXA signal analyzer data sheet is a summary of thespecifications and conditions for N9010A EXA signal analyzers, which are available in the EXA Signal Analyzer Specification Guide (N9010-90025).For ordering information, refer to the EXA Signal Analyzer Configuration Guide (5989-6531EN).Definitions and ConditionsSpecifications describe the performance of parameters covered by the product warranty and apply to the full temperature range of 0 to 55 °C 1, unless otherwise noted.95th percentile values indicate the breadth of the population (approx. 2 σ) of perfor-mance tolerances expected to be met in 95 percent of the cases with a 95 percent confidence, for any ambient temperature in the range of 20 to 30 °C. In addition to the statistical observations of a sample of instruments, these values include the effects of the uncertainties of external calibration references. These values are not warranted. These values are updated occasionally if a significant change in the statistically observed behavior of production instruments is observed.Typical describes additional product performance information that is not covered by the product warranty. It is performance beyond specifications that 80 percent of the units exhibit with a 95 percent confidence level over the temperature range 20 to 30 °C. Typical performance does not include measurement uncertainty. Nominal values indicate expected performance, or describe product performance that is useful in the application of the product, but are not covered by the product warranty.The analyzer will meet its specifications when: –It is within its calibration cycle–Under auto couple control, except when Auto Sweep Time Rules = Accy –Signal frequencies < 10 MHz, with DC coupling applied–The analyzer has been stored at an ambient temperature within the allowed operating range for at least two hours before being turned on; if it had previously been stored at a temperature range inside the allowed storage range, but outside the allowed operating range –The analyzer has been turned on at least 30 minutes with Auto Align set to normal, or, if Auto Align is set to off or partial, alignments must have been run recently enough to prevent an Alert message; if the Alert condition is changed from Time and Temperature to one of the disabled duration choices, the analyzer may fail to meet specifications without informing the user For the complete specifications guide, visit:/find/exa_specifications1. For earlier instruments (Serial number prefix < MY/SG/US5052), the full temperature ranges from 5 to 50 °C.Frequency and Time SpecificationsRange0 Hz (zero span), 10 Hz to maximum frequency of instrument Resolution 2 HzAccuracy Swept FFT ± (0.25 % x span + horizontal resolution)± (0.10 % x span + horizontal resolution)1. When used with external frequency reference 1 pulse-per-second (PPS), such as the J7203A atomic frequency reference (AFR), the reference track-ing accuracy needs to be taken into account for calculation of the overall frequency accuracy. Refer to the EXA signal analyzer specifications guide (part number: N9010-90025) for more details.rate6 ms (167/s) 5 ms (200/s)Remote measurement and LAN transferrateMarker peak search 5 ms 1.5 msCenter frequency tune and transfer (RF)22 ms20 msCenter frequency tune and transfer (μW)49 ms47 msMeasurement/mode switching75 ms39 ms1. Analysis bandwidth is the instantaneous bandwidth available around a center frequency over which the input signal can be digitized for furtheranalysis or processing in the time, frequency, or modulation domain.2. Sweep points = 101.Amplitude Accuracy and Range Specifications0.1 to 1 dB/division in 0.1 dB steps1 to 20 dB/division in 1 dB steps (10 display divisions) Linear scale10 divisionsScale units dBm, dBmV, dBμV, dBmA, dBμA, V, W, A(Option 532, 544) 3.5 to 8.4 GHz± 0.67 dB nominal8.4 to 26.5 GHz± 0.80 dB nominal26.4 to 44 GHz± 0.80 dB nominal1. DC coupling required to meet specifications below 50 MHz. With AC coupling, specifications apply at frequencies of 50 MHz and higher. Statisticalobservations at 10 MHz with AC coupling show that most instruments meet the DC-coupled specifications, however, a small percentage of instruments are expected to have errors exceeding 0.5 dB at 10 MHz at the temperature extreme. The effect at 20 to 50 MHz is negligible but notwarranted.Option P03100 kHz to 3.6 GHzOption P07100 kHz to 7 GHzOption P13100 kHz to 13.6 GHzOption P26100 kHz to 26.5 GHzOption P32100 kHz to 32 GHzOption P44100 kHz to 44 GHzGain100 kHz to 3.6 GHz+20 dB nominal3.6 to 7.0 GHz+35 dB nominal> 7 GHz+40 dB nominalNoise figure100 kHz to 3.6 GHz8 to 12 dB nominal (proportional to frequency)3.6 to 8.4 GHz9 dB nominal8.4 to 13.6 GHz10 dB nominal> 13.6 GHz DANL + 176.24 dB nominalDynamic Range Specifications(Option 503, 507, 513, 526)10 MHz to 2.1 GHz–148 dBm–150 dBm2.1 to3.6 GHz–147 dBm–149 dBm3.6 to 7.0 GHz–147 dBm–149 dBm7.0 to 13.6 GHz–143 dBm–147 dBm13.6 to 17.1 GHz–137 dBm–142 dBm17.1 to 22 GHz–137 dBm–142 dBm22 to 26.5 GHz–134 dBm–140 dBmPreamp on, RF/MW (Option 503, 507, 513, 526)10 MHz to 2.1 GHz–161 dBm –163 dBm2.1 to3.6 GHz–160 dBm–162 dBm3.6 to 7.0 GHz–160 dBm–162 dBm 7.0 to 13.6 GHz– 160 dBm–163 dBm 13.5 to 17.1 GHz–157 dBm–160 dBm 17.0 to 20.0 GHz–155 dBm–159 dBm 20.0 to 26.5 GHz–150 dBm–156 dBmMillimeter-wave (Option 532, 544)9 kHz to 1 MHz ––130 dBm 1 MHz to 1.2 GHz–152 dBm–155 dBm1.2 to2.1 GHz–151 dBm–154 dBm2.1 to3.6 GHz–149 dBm–152 dBm3.5 to4.2 GHz –144 dBm–147 dBm4.2 to 8.4 GHz–145 dBm–150 dBm 8.3 to 13.6 GHz–147 dBm–150 dBm 13.5 to 20 GHz –145 dBm–148 dBm 20 to 26.5 GHz –142 dBm–145 dBm 26.4 to 34 GHz –140 dBm–144 dBm 34.4 to 44 GHz –135 dBm–140 dBmMid-Band 0 (1.8 GHz)–157 dBm–169 dBmMid-Band 1 (5.9 GHz)–152 dBm–166 dBmMid-Band 2 (10.95 GHz)–154 dBm–165 dBmMid-Band 3 (15.3 GHz)–153 dBm–164 dBmMid-Band 4 (21.75 GHz)–148 dBm–164 dBmMid-Band 5 (30.4 GHz)–145 dBm–160 dBmMid-Band 6 (42.7 GHz)–142 dBm–154 dBm1. When Option B40, DP2, or MPB is installed some aspects of the analyzer performance change. Please refer to the EXA specifications guide for moredetails.Spurious responsesResidual responses (input terminated and 0 dB attenuation)200 kHz to 8.4 GHz (swept) –100 dBm Zero span or FFT or other –100 dBm nominalFirst RF order(f ≥ 10 MHz from carrier)–10 dBm–80 dBc + 20log(N 1) Including IF feedthrough, LO harmonic mixingresponsesHigher RF order(f ≥ 10 MHz from carrier)–40 dBm–80 dBc + 20log(N 1) Including higher order mixer responsesCarrier frequency > 26.5 GHzFirst RF order(f ≥ 10 MHz from carrier)–30 dBm–90 dBc nominalHigher RF order(f ≥ 10 MHz from carrier)–30 dBm–90 dBc nominal 1. N is the LO multiplication factor.(Option 503, 507, 513, 526)100 to 400 MHz+13 dBm+17 dBm 400 MHz to 3.6 GHz+14 dBm+18 dBm 3.6 to 13.6 GHz+14 dBm+18 dBm 13.6 to 26.5 GHz+12 dBm+16 dBmPreamp on, RF/MW (Option 503, 507, 513, 526)30 MHz to 3.6 GHz (two –45 dBm tones at preamp)3.6 to 26.5 GHz (two –50 dBm tones at preamp)0 dBm nominal–18 dBm nominalMillimeter-wave (Option 532, 544)10 to 100 MHz+12 dBm+17 dBm100 MHz to 3.95 GHz+15 dBm+19 dBm3.95 to 8.4 GHz+15 dBm+18 dBm8.3 to 13.6 GHz +15 dBm+18 dBm13.5 to 17.1 GHz+11 dBm+17 dBm17.0 to 26.5 GHz +10 dBm+17 dBm (nominal) 26.5 to 44 GHz –+13 dBm (nominal)Preamp on, millimeter-wave (Option 532, 544)30 MHz to 3.6 GHz (two –45 dBm tones at preamp) 0 dBm (nominal) 3.6 to 26.5 GHz (two –50 dBm tones at preamp)–18 dBm (nominal)Nominal dynamic range for Options 503, 507, 513 and 526Figure 1. Nominal dynamic range – Band 0, for second and third order distortion, 9 kHz to 3.6 GHzFigure 2. Nominal dynamic range – Bands 1 to 4, for second and third order distortion,3.6 GHz to 26.5 GHzPhase noise 1Offset Specification Typical RF/MW(Option 503, 507, 513, 526)Noise sidebands(20 to 30 °C, CF = 1 GHz)100 Hz –84 dBc/Hz –88 dBc/Hz 1 kHz ––98 dBc/Hz nominal 10 kHz –103 dBc/Hz –105 dBc/Hz 100 kHz –115 dBc/Hz –117 dBc/Hz 1 MHz –135 dBc/Hz –137 dBc/Hz 10 MHz––148 dBc/Hz nominal1. Apply for all the RF/MW instruments with Serial number prefix ≥ MY/SG/US5340. Those instruments ship standard with N9010A-EP3 as theidentifier. For nominal phase noise values with the RF/MW EXA at other center frequencies refer to Figure 3. For earlier instruments refer to the EXA specifications guide.Figure 3. Nominal phase noise at different center frequencies for RF/MW EXA (Option 503, 507, 513, or 526) with SN prefix >/= MY/SG/US5340 that ships standard with N9010A-EP3.Nominal phase noise at different center frequencies for RF/μW EXA with RBW selectivity curves, optimized phase noise versus offset frequencyFigure 4. Nominal phase noise at different center frequencies for millimeter-wave EXA (Option 532 or 544)Phase noise 1Offset Specification TypicalMillimeter-wave 100 Hz –84 dBc/Hz –88 dBc/Hz(Option 532, 544) 1 kHz ––101 dBc/Hz nominal Noise sidebands10 kHz –103 dBc/Hz –106 dBc/Hz (20 to 30 °C, CF = 1 GHz)100 kHz –115 dBc/Hz –116 dBc/Hz 1 MHz –135 dBc/Hz –137 dBc/Hz10 MHz––149 dBc/Hz nominal1. For nominal phase noise values with the millimeter-wave EXA (Option 532 or 544), refer to Figure 4.Nominal phase noise at different center frequencieswith RBW selectivity curves, optimized phase noise versus offset frequencyS S B p h a s e n o i s e (d B c /H z )Freq (kHz)Option MPB, microwave preselector bypass 1Frequency range N9010A-507 3.6 to 7 GHz N9010A-513 3.6 to 13.6 GHz N9010A-526 3.6 to 26.5 GHz N9010A-532 3.6 to 32 GHz N9010A-5443.6 to 44 GHz1. When Option MPB is installed and enabled, some aspects of the analyzer performance changes. Please refer to the EXA specification guide for more details.PowerSuite Measurement SpecificationsRelative dynamic range (30 kHz RBW) Absolute sensitivityRelative accuracy 74.0 dB81.0 dB typical–94.7 dBm–100.7 dBm typical ± 0.11 dB3GPP W-CDMA (2.515 MHz offset)Relative dynamic range (30 kHz RBW) Absolute sensitivityRelative accuracy 76.5 dB83.9 dB typical–94.7 dBm–100.7 dBm typical ± 0.12 dBGeneral SpecificationsThe EXA signal analyzer is supplied with a standard 3-year warrantyCalibration cycleThe recommended calibration cycle is two years; calibration services are available through Keysight service centersInputs and OutputsConnectorOutput amplitude Frequency BNC female, 50 Ω nominal≥ 0 dBm nominal10 MHz ± (10 MHz x frequency reference accuracy)Ext Ref InConnectorInput amplitude range Input frequencyFrequency lock range BNC female, 50 Ω nominal–5 to 10 dBm nominal10 MHz nominal± 5 x 10⁻⁶ of specified external reference input frequencyTrigger 1 and 2 inputs ConnectorImpedanceTrigger level range BNC female> 10 kΩ nominal –5 to 5 VTrigger 1 and 2 outputs ConnectorImpedanceLevel BNC female 50 Ω nominal 5 V TTL nominalMonitor output Connector FormatResolution VGA compatible, 15-pin mini D-SUBXGA (60 Hz vertical sync rates, non-interlaced) analog RGB 1024 x 768RangeResolution 10 to 75 MHz (user selectable) 0.5 MHzConversion gain–1 to +4 dB (nominal) plus RF frequency response BandwidthOutput at 70 MHz centerLow band or high band with preselector bypassed 1100 MHz (nominal)Preselected band Depends on RF center frequencyLower output frequencies Subject to foldingResidual output signals≤ –88 dBm (nominal)1. Option MPB installed and enabled.I/Q AnalyzerFrequencyFrequency spanStandard10 Hz to 10 MHzOption B25 (standard)10 Hz to 25 MHz10 Hz to 40 MHz0.02 ≤ f < 3.6≤ 25n/a0.6°0.14°≥ 3.6≤ 25off 1 1.9° 0.4° ≥ 3.6 (Option ≤ 526)≤ 25on 4.5° 1.2°1. Option MPB is installed and enabled.20Length (IQ sample pairs)536 MSa268 MSaLength (time units)Samples/(span x 1.28) (nominal) Sample rateAt ADC200 MSa/sIQ pairs Span x 1.28 (nominal)ADC resolution12 bits1. Option MPB is installed and enabled.Related LiteraturePublication title Publication numberEXA X-Series Signal Analyzer N9010A – Brochure5989-6527ENN9010A EXA X-Series Signal Analyzer – Configuration Guide5989-6531ENFor more information or literature resources please visit the web:Product page: /find/N9010AX-Series measurement applications: /find/X-Series_AppsX-Series signal analyzers: /find/X-Series21myKeysight/find/mykeysightA personalized view into the information most relevant to you.LAN eXtensions for Instruments puts the power of Ethernet and the Web inside your test systems. Keysight is a founding member of the LXI consortium.Three-Year Warranty/find/ThreeYearWarrantyKeysight’s commitment to superior product quality and lower total costof ownership. The only test and measurement company with three-yearwarranty standard on all instruments, worldwide.Keysight Assurance Plans/find/AssurancePlansUp to five years of protection and no budgetary surprises to ensure yourinstruments are operating to specification so you can rely on accuratemeasurements./qualityKeysight Technologies, Inc.DEKRA Certified ISO 9001:2008Quality Management SystemKeysight Channel Partners/find/channelpartnersGet the best of both worlds: Keysight’s measurement expertise and productbreadth, combined with channel partner convenience.cdma2000® is a registered certification mark of the Telecommunications IndustryAssociation. Used under license./find/exaFor more information on KeysightTechnologies’ products, applications orservices, please contact your local Keysightoffice. The complete list is available at:/find/contactusAmericasCanada(877) 894 4414Brazil55 11 3351 7010Mexico001 800 254 2440United States(800) 829 4444Asia PacificAustralia 1 800 629 485China800 810 0189Hong Kong800 938 693India 1 800 112 929Japan0120 (421) 345Korea080 769 0800Malaysia 1 800 888 848Singapore180****8100Taiwan0800 047 866Other AP Countries(65) 6375 8100Europe & Middle EastAustria0800 001122Belgium0800 58580Finland0800 523252France0805 980333Germany***********Ireland1800 832700Israel 1 809 343051Italy800 599100Luxembourg+32 800 58580Netherlands0800 0233200Russia8800 5009286Spain0800 000154Sweden0200 882255Switzerland0800 805353Opt. 1 (DE)Opt. 2 (FR)Opt. 3 (IT)United Kingdom0800 0260637For other unlisted countries:/find/contactus(BP-07-10-14)22 | Keysight | N9010A EXA X-Series Signal Analyzer - Data SheetThis information is subject to change without notice.© Keysight Technologies, 2013 – 2014Published in USA, August 29, 20145989-6529ENN9010AK-1CM N9010AK-DVR N9010AK-EA3。
Actix教程
© Copyright Actix, Inc. 2001
除此,还支持下面的CDMA 1X数据格式: Qualcomm CAIT Grayson Invex 3G Agilent Viper 1x Motorola SMAP 1x Samsung SysCAM 1x Nortel SBS 1x
© Copyright Actix, Inc. 2001
Main Menu
Workspace
Status Bar
© Copyright Actix, Inc. 2001
文件组成
在使用Analyzer时,一些指定目录位置小程序可以帮助我 时 在使用 们更好的使用软件来进行分析。 们更好的使用软件来进行分析。 Data Logfiles Analyzer Workspace files Reports Custom Attributes
© Copyright Actix, Inc. 2001
版本4支持的数据格式 版本 支持的数据格式
Version 4.1支持下面的CAMA数据格式: Agilent Handset and Scanner data Grayson Handset and Scanner data Comarco Handset and Scanner data Qualcomm MDM Handset data and Retriever Nortel SBS Lucent RFT Motorola SMAP Samsung SysCAM Safco Walkabout (.sd5) IS95-B (CDMA)
除了上面提到的硬件的要求外,Analyzer在Windows Virtual Memory Paging 大小在1000和1500MB之间时状态最佳。设置这些参数的方法在不 同的操作系统中不尽相同。关于这些参数的特殊指导请咨询你的OS。
ActixAnalyzerTraining(Axtix使用指南)
Other views: Display Form
预定义的多种参数显示窗口
Other views: Screen Layout
预定义的多种窗口布局
Other views: State Form
可以多种灵活方式自定义显示窗口
进入设计模式
Merge files
多个log文件的合并,不分设备、时间、厂家
多个参数直接拖放
Other views: Message Brower
无需一一分析信令,Message Brower显示所有事件
Other views: Signaling
层三信令窗口,支持查找、过滤
Other views: Filtering
• 多种基于任意参数的过滤条件 • 过滤作用于任意显示、分析等 • 创建新Filter在Analysis Manager中
同样可以在Statistics Explorer显示
Example: how to Analysis Manager for network interference investigation
目的:基于通过手机配合扫频仪收集 的路测数据,查看扫频仪扫到的当前 服务小区BCCH的场强,以及其上、 下邻频的场强,判断是否有邻频干扰。
Analysis Manager:
Analysis Manager是Actix Analyzer区别与其他后台处理的一大优势
Analysis Manager: Filter
如何使用Filter自定义过滤
Analysis Manager: Binned Query
如何通过Binned Query自定义参数
0
EcIo PDF
EcIo CDF
100.0% 90.0% 80.0% 70.0% 60.0% 50.0% 40.0% 30.0% 20.0% 10.0% 0.0%
Analyzer使用指导书
资料编码产品名称Actix使用对象内部工程师产品版本编写部门CDMA网络规划部资料版本V1.0Analyzer使用指导书V1.0拟制:日期:审核:日期:审核:日期:批准:日期:华为技术有限公司版权所有侵权必究修订记录目录第1章概述 (4)1.1 主要功能 (4)1.2 Analyzer主要优点 (4)1.3 支持的数据格式 (4)1.4 系统配置要求 (5)第2章使用Analyzer (7)2.1 启动Analyzer (7)2.2 设置Analyzer (7)2.2.1 导入地图 (7)2.2.2 导入基站数据 (10)2.2.3 数据平均(更改数据采样频率) (17)2.3 导入测试数据和分析 (18)2.4 功能介绍 (25)2.4.1 重放功能 (25)2.4.2 StateForms 功能 (26)2.4.3 通过消息浏览器查看数据 (27)2.4.4 创建报告 (28)2.4.5 反向链路数据分析 (31)第3章 Analyzer的定性分析 (32)3.1 查询功能 (32)3.2 FER的查询及过滤 (33)3.3 音质差的查询及过滤 (34)3.4 Binned查询分析:识别导频污染 (35)3.5 事件查询—掉话窗口3.6 显示事件查询 (41)3.7 CDMA StateTip:决定Serving PNs (42)第4章复杂网络分析 (43)4.1 对多载频网络进行统计 (43)4.2 CDMA网络参数优化 (45)4.2.1 使用CDMA工具包做Search Window分析 (46)4.2.2 使用CDMA工具包做Neighbor List分析 (48)第5章帮助文件 (51)关键词:1XEV-DO Map Chart Table摘要:Actix公司的Analyzer是一个针对无线网络优化的后处理工具。
它可以对以下仪器采集的无线网络数据进行分析:路测采集工具,包括Qualcomm MDM,Agilent E64xx and E74 系列扫描仪,Grayson Surveyor,Comarco baseLINE,及XK 系列CDMA网络电话/扫描仪。
54100A_56100A_ds[1]
![54100A_56100A_ds[1]](https://img.taocdn.com/s3/m/690a040ef78a6529647d53f3.png)
For economic measurement of SWR, loss/gain,relative group delay and distance-to-fault54100A/56100AScalar Network Analyzers1 MHz to 110 GHzTechnical Data Sheet•ANRITSU Corporation5-10-27, Minamiazabu, Minato-ku, Tokyo 106, Japan Telephone +81-3-3446-1111Telex J34372Fax +81-3-3442-0235Overseas Subsidiaries•USAANRITSU Company1155 E. Collins Blvd. Richardson,TX 75081, U.S.A.Telephone +1-800-ANRITSU Fax: +1-972-671-1877•CanadaANRITSU Instruments Ltd4-205 Matheson Blvd. East, Mississauga Ontario, L4Z 3E3, Canada Telephone +1-905-890-7799Fax: +1-905-890-2290•BrazilANRITSU Electronica Ltda.Praia de Botafogo 440, Sala 2401CEP 22250-040, Rio de Janeiro, RJ, Brasil Telephone +55-21-527-6922Fax: +55-21-537-1456•UKANRITSU Ltd200 Capability Green, Luton, Bedfordshire LU1 3LU, United Kingdom Telephone +44-1582-433200Fax: +44-1582-731303•GermanyANRITSU GmbHGrafenberger Allee 54-56, D-40237Düsseldorf 1, GermanyTelephone +49-211-968550Fax:+49- 211-9685555•FranceANRITSU SA9, Avenue du Québec, ZA de Courtaboeuf 91951 Les Ulis Cedex, France Telephone +33-1-60-92-15-50Fax: +33-1-64-46-10-65•ItalyANRITSU SpAVia Elio Vittorini, 129, 00144 Roma, Italy Telephone +39-6-509-9711Fax: +39-6-502-2425Fax: +968-791697•SwedenANRITSU ABBotvid Center 145 84 Stockholm, Sweden Telephone +46-853470700Fax: +46-853470730Fax: +91-11-685-2275•SingaporeANRITSU Pte Ltd6, New Industrial Rd., #06-01/02, Hoe Huat Industrial Building, Singapore 536199Telephone +65-282-2400Fax: +65-282-2533•Hong KongANRITSU Company LtdSuite 812, 8/F , Chinachem Golden Plaza, 77 Mody RoadTsimshatsui East, Kowloon, Hong Kong, China Telephone +852-2301-4980Fax: +852-2301-3545•KoreaANRITSU Corporation LtdRoom No. 901, Daeo Bldg., 26-5, Yeoido-Dong,Young Deung Po-Ku, Seoul, Korea Telephone +82-2-782-7151 to 7156Fax: +82-2-782-4590Specifications are subject to change without notice.15000-00010 rev A(TKO09/00)Distance-To-FaultThe most common failure in a microwave radio link is the transmission line, the waveguide and/or coaxial cables which connect radio equipment to the antennas. With the 54100A Series optional Distance-To-Fault (DTF) Software you can install and maintain tower equipment with confidence.Anritsu’s precision calibration components and low source harmonics provide industry leading return loss (or SWR) accuracy. With 0.1% distance accuracy, you’re sure to identify degraded components or moisture quickly –before the problem causes a failure. Automatic anti-aliasing software and windowing filters ensure the peaks on the DTF display are really there, not erroneous fault indications caused by re-reflections.With most elliptical waveguide components meeting 30 dB return loss performance, it’s absolutely critical that the precision load used for calibration is of the highest quality to achieve repeatable, accurate measurements. Using poor quality 50 W loads for DTF calibration will cause abnormally high test data variationsSpecificationsThe optional Distance-To-Fault software displays impedance discontinuities versus distance based on a swept frequencymeasurement of transmission line mismatch.The software is available by ordering Option 7with 54100A Series Network Analyzers.Measurements:Distance-To-Fault (meters or feet), Return loss or SWR of fault.Frequency Sampling:256, 512, or 1024 frequency points.Window Functions:Hamming, 2-term, –42 dB sidelobes;Blackman-Harris, 3-term, –67 dB sidelobes.Anti-aliasing:Filtering of post detected data rejects indications of false faults caused by signal re-reflections during high reflection fault conditions or out of band sweep on antenna systems.Distance Accuracy:<0.1% of range or 2 mm dependent upon knowledge of the propagation velocity for the device under test and the frequency sweep range.Dynamic Range:>80 dB, depending upon calibration component return loss and operating frequency range.Return Loss Amplitude Accuracy:Effective Directivity is dependent upon the return loss of the precision termination used during calibration.Distance Range: 1 to 5000 meters depending on measurement frequency range and hardware configuration.Distance Resolution (of one fault):0.4% of total distance (256 frequency measurement points), 0.2% of total distance (512 frequency54100A Series optional softwareIntroduction to Anritsu Scalar AnalyzersAnritsu offer a comprehensive range of scalar analyzers for economic network measurements to 110GHz.The 56100A scalar analyzer used inconjunction with a 68C series synthesizer offers the very best RF performance in a scalar measurement system. The 68C seriessynthesizer and 56100A analyzer communicate over a private GPIB link to form an integrated scalar measurement system.The 56100A/68C scalar measurement systems offers 10MHz to 50GHz frequency coverage with –40dBc harmonics, up to+17dBm levelled power and fully synthesized sweeps. This combination is ideal where the best possible frequency accuracy and dynamic range are required.Mixers and other frequency conversiondevices can also be characterised by using two synthesizers in the system to generate frequency sweeps with a fixed offset.The 54100A series integrated scalar network analyzers have built in crystal referencedsources to provide an economical and compact solution. They are ideal for production of devices such as filters and amplifiers from 1MHz to 50GHz. Optional software adds; distance to fault measurements for field testing of waveguides, cables and antennas, relative group delay software for economic filtercharacterisation and precision return loss that adds up to 20dB directivity improvement to SWR measurements.For scalar network measurements to 110GHz both 54100A and 56100A are complementedby the millimeter wave reflectometers.measurement points), 0.1% of total distance (1024 frequency measurement points).Transmission Lines Supported:•Coaxial Cable •Waveguide•Waveguide with Coaxial Cable InputTransmission line loss and velocity factor are corrected by the software. Waveguide dispersion is corrected based on the cutoff frequency, fc.For waveguide with coaxial cable input, a special operating mode is utilized toautomatically compensate for the length of non-dispersive coaxial cable in front of the waveguide transmission line.Distance-To-Fault Measurement Accessories:Anritsu Distance-To-Fault test systems utilize standard diode detectors and measurement accessories.POWER DIVIDERSThese signal dividers are symmetrical, three-resistor tee designs that are used with theDistance-To-Fault option and other applicationsDistance-To-Fault mode simplifies problemidentification. Superior accuracy, sensitivity and precision components ensure that comparison measurements clearly indicate performance degradation. Sitetechnicians easily locate small problems before more serious failures result.The 56100A Scalar Network Analyzer operates with Anritsu’s 68C and 69B series synthesizers. The separate source maximizes system performance and flexibility.The 54100A Series Scalar Network Analyzers offer highly integrated and economic network measurementsduring maintenance test intervals. Instead of saving time, technicians may find themselves chasing non-existent problems.3 dB ATTENUATORSPRECISION TERMINATIONSNon-Ratio Operation, Coaxialrequiring two inputs to be combined into a single output.Maximum Input Power:+30 dBmTerminations are required for calibration and are occasionally used for terminating the output of the coaxial cable under test.Further information on Anritsu scalaranalyzers, or other Anritsu products, can be found by contacting one of the offices listed on the back cover. For a full list of salesoffices around the world, visit our web site at Relative Group DelayOptional relative group delay software identifies signal distortion caused by bandpass devices such as filters, receivers, power amplifiers, and up/down converters. Group delay is a key cause of high Bit Error Rate (BER). Group delay is important for 1) CDMA and spread spectrum communications 2) phase radars 3)high capacity satellite and terrestrial microwave links 4) PAL and HDTV television components and other RF systems sensitive to phase distortion.Group Delay results from deviation in the rate of change of phase response versus change in frequency, df/dw. It indicates that different frequencies travel at different speeds through an RF device. RF systems which depend upon phase coded information suffer degradation when group delay is excessive. The growth in wireless communicationsplaces a heavy demand on available frequency spectrum. More efficient communications standards have digital phase modulation withhigh bits-per-hertz specifications and high bandpass filter rolloff rates. Each of these conditions make the communications more susceptible to group delay induced bit error rate problems.The 54100A saves time and expense by measuring group delay with the same,inexpensive network analyzer as is used for other tests.Calibration requires only an RF path normalization with a standard RF detector.Relative group delay specifications assume measurement of bandpass devices. Frequency sweep must include at minimum 20 dBr of transmission rolloff from mid-band response.For best results, set the frequency sweep to cover more than 20 dBr rolloff is suggested.Relative Group Delay Accuracy:Typically < 1ns, < 5.0% of peak-to-valley range with noise averaged. Assumes the bandlimiting device within the DUT meets minimum phase shift design. Devices such as SAWfilters, microwave phase equalizers, and branchline couplers will have additional uncertainty.Calibration: A transmission path normalization is required.54100A Series softwarePrecision Return LossPrecision Return Loss (PRL) is a technique which uses vector signal addition principles to extend the directivity of scalar network analyzer (SNA) measurements. The 15 to 20 dB directivity improvement allows accurateverification and calibration of very high return loss devices such as terminations, attenuators,and adapters – components which are common to almost every RF test bench.Test bench components are susceptible to a variety of problems including:1) Repeated excess torque 2) Drops to the floor 3) Accumulation of dirtAdditionally, since adapters and attenuators are not always labeled for frequency range, they are occasionally used at frequency ranges beyond their specification.PRL finds these problems quickly. The technique utilizes the same network analyzer which is used for the production process: test operators need only share an Airline and an Offset SWR Autotester.PRL AccuracyWhen testing single port RF devices such as terminations, the principle uncertainty terms aremeasurement directivity and channel accuracy. The directivity of a PRL measurement is limited by the return loss of the precision airline. Channel accuracy includes noise effects, logarithmic deviation, open/short cal uncertainty, linearity, and instrumentation stability. Additional second order uncertainty terms such as test port match and source match are typically negligible.Measurement Uncertainty (dB) = Channel Accuracy + Directivity Uncertainty Measurement Uncertainty (dB) = - 0.5 - 20 log (1 + 10- Ed/20)where, Ed = Airline Return Loss (dB) - Measured Return Loss (dB)When measuring two port devices such as adapters and attenuators, an additional term (load match) is required to account for the return loss of the precision termination which is attached to port two of the device.Measurement Uncertainty (dB) = - 0.5 - 20 log (1 + 10- Ed/20) -20 log (1 + 10- Et/20)where, Et = Termination’s Return Loss (dB) - Measured Return Loss (dB)With the implementation of ISO-9002, microwave testspecialists must perform verification of common test stand components such as adapters and terminations on a daily or weekly basis rather than at annual calibration cycles.(Left) A technician tunes a precision termination in the Precision Return Loss TUNING mode.−20−40−600.011020304050D i r e c t i v i t y S i g n a l F r o m R e f e r e n c e , d BFrequency, GHzN WSMAKVK AirlineWSMA AirlineN AirlineBy utilizing the traceable performance of a PrecisionAirline, the Precision Return Loss technique overcomes the directivity limitations of standard SWR Autotesters (or bridges), allowing accurate calibration of very low return loss devices.1Terminations are needed for adapter verification tests and other two port device testing.The 54100A utilizes transmission magnitude data to calculate relative group delay using a Hilbert transform software technique. No modulation is utilized. No aperture settings are necessary and frequency converter ALC loops are not disturbed during testing. The technique is applicable to devices with minimum phase transfer functions.Component Connections for Precision Return Loss ModeFor ISO-9000 based manufacturing, the accuracy of production tests must be known.The PRL measurement technique helps toensure test process compliance by verifying theproper performance of test setup components.The use of NIST traceable Precision Airlines allow accurate calibration of those ponents For High Return Loss Device TestingStandard SWR autotesters are internally terminated to a precision 50 ohm match. The Offset SWR autotester replaces this 50 ohm termination with a 15 dB or 20 dB offsettermination. This produces a readily measureable reference vector.During measurement, the S 11reflection vector of a high return loss will interfere with the reference - creating a ripple pattern on the display proportional to the DUT’s return loss.The ripple pattern is automatically converted to a return loss display trace by the precision return loss mode’s software.LegendV-type SWR Autotester K-type SWR Autotester WSMA-type SWR Autotester N-type SWR AutotesterK-type Offset SWR Autotester & K Airline K-type Offset SWR Autotester & WSMA Airline GPC-7 Offset SWR Autotester & N AirlinePRL ACCESSORY CONFIGURATION CHART AIRLINE SPECIFICATIONSrecommend use of a three resistor power divider. Except for the 1091-29, the powerdivider connection to the source output requires a male-male adapter or an RF extension cable with male connectors.(I) 3 dB Attenuators, (J) DUT Adapters, (K) TerminationsThese components are used during coaxial Distance-To-Fault applications. Waveguide DTF applications may require a coaxial to waveguide adapter.(A) SWR AutotestersFor optimum accuracy, the SWR Autotester test port must mate to the DUT's input connector. If you must use an adapter at the SWR Autotester test port, use a precision low SWR adapter to minimize degradation of directivity.(B) DetectorsOne detector is required for transmission or DTF measurements in non-ratio configurations. Ratio measurements (monitors source output power)require a second detector.(C) Power SplitterTwo resistor power splitters are used for ratio measurements and external leveling.(D) Splitter AdapterAdapter mates the power splitter output to the SWR Autotester input for Ratio and/or externally leveled measurements.(F) Source CableIn manufacturing applications, using the source cable from the source output to the powersplitter input (or, in Non-Ratio applications to theSWR Autotester input) helps minimize long term wear of the SWR Autotester ’s test portconnector. The cable mates directly to power splitter ’s input. Connection directly to SWR Autotesters requires a male-male adapter for WSMA, K, and V type SWR Autotesters.(G) Source AdapterThis adapter mates the source output directly to the SWR Autotester input.(H) Power DividerDistance-To-Fault testing procedures54100A/56100A Series Network Analyzer Configuration Chart1 V to K interconnections require male (source) to female power splitter adapters. 2Also requires a source adapter. 3See page 12 to select appropriate test port heads.Connection Diagramsmaximum values of successive sweeps or the combination of the two. Ideal for acquiring data on drift or gain variation against temperature.Cursor Functions:Automatic cursor search updates the bandwidth, minimum, or maximum levels of the displayed trace, “X ” dB above or below the min/max point, or a selectedbandwidth. This function can be set to repeat continuously.Compression Test Automation:Determines the gain compression point over the operating frequency range of an amplifier by successively incrementing the source power and measuring the amount of compression until a preset “X ” dB limit is exceeded.GPIBInterface:IEEE-488.2 compliant interface with integrated GPIB Plotter Control is standard on all 54100A instruments. All front panel controls are GPIB-controllable except power on/off. Front panel configurable for instrument control or for control of GPIB plotter.Printer/PlotterPlotter:The GPIB interface is compatible with HPGL plotters. Display traces, markers, cursor,and graticule information can be plotted.Printer:Parallel printer interface is compatible with the Cannon BJ85 and most Epson FX-compatible printers.Internal Print and Plot Buffer: A new test can be conducted while previously taken test data are being printed or plotted from theinternal printer buffer. Portable printers may be purchased locally or through Anritsu. When purchased separately, a Centronics-to-MeasurementsThe 54100A Series Network Analyzer include models and measurement components from 1 MHz to 110 GHz.Measurement Modes:Transmission (dB),Return Loss (dB), Precision Return Loss (dB),SWR (linear SWR), Power (dBm), optional Distance-To-Fault (feet or meters) and Relative Group Delay (ns),AnalyzerDynamic Range:-55 dBm to +16 dBm,Autozeroing implements AC detection on a single cycle per sweep basis using Anritsu 560Series or 5400 Series Detectors and SWR Autotesters. DC detection is used during the sweep to improve accuracy and avoid disturbing automatic leveling controls in the device under test. Auto-zeroing can be disabled.Inputs:Three. Two standard inputs, A and B,with an optional third reference channel, R (Option 5). Anritsu 560 Series and 5400 Series Detectors and Autotesters are designed tooperate with the 54100A Network Analyzer. For millimeter wave applications, the 5400 Series Multiplier/Reflectometers provide integrated reference and return loss detection.Channels:Two channels are used to select and simultaneously display any two inputs from A, B, or R. The inputs can also be displayed as ratios A/R or B/R.Display Resolution:Horizontal:51, 101, 201, or 401 points.Vertical:0.025 dB, 0.0025 nsGraticule:Ten vertical divisions. Horizontal axis automatically scales in frequency increments of 1, 2, 5. Graticule On/Off button turns allgraticule lines off. Tick marks remain on axis to indicate graticule position.Vertical Scaling:Resolution:0.1 dB(m) to 10 dB(m) per division.Independent control for each channel 0.1 to 100ns per division.Offset range:-99.9 dB to +99.9 dB, -99.9 to +99.9 ns.Autoscale:Automatically selects offset and resolution to provide optimum display of test data.External VGA Monitor Output:Rear panel connection is provided to drive a VGA color display. Trace colors are menu selectable.Cursor:The numerical amplitude of the test data and frequency are displayed for bothchannels. Display range -99.9 to +99.9 dB or ns.Relative Cursor:Displays the amplitude and frequency differences between the Cursor and Relative Cursor for both channels.Cursor Functions:Automatic cursor searches for trace Maximum, Minimum, dB Level, dBBandwidth, Next Marker, and Active Marker may be performed.Centronics Printer Interface Cable will be needed for operation with the 54100A.I/O ConnectionsHorizontal Sweep Ramp Output:0 to +10 V nominal.GPIB:Connects 54100A to controller or plotter.Rear panel GPIB connector.Parallel Printer (Centronics):Connects 54100A to printer. Rear panel.VGA Output:Connects 54100A to external VGA color display (not supplied). Rear panel 15pin “D ” connector.External Leveling:Option 6 adds external leveling capability. Levels output power at remote test position. (Rear panel BNC female connector).GeneralSelf Test:Performs a self test every time power is applied or when SELF TEST push button is pressed. If an error is detected, a diagnostic code appears, identifying the cause and location of the error.Temperature Range:Operating:0°C to +50°C Storage:-40°C to +70°CElectromagnetic Compatiblity:Complies with European Community requirements for CE markingPower:115V +10%/-20%, 230V +10%/-20%,48-440 Hz, 300 VA maximumDimensions:177 H x 426 W x 476 D mm + 51mm for feet (7 H x 16.75 W x 18.75 D in. + 2.0in. for feet)Weight:Nominally 18 kg (39 lb.), 54147ADisplay Data Correction:System frequency response errors are removed frommeasurements with a through-line transmission calibration and an open-short reflectioncalibration. Calibration data is stored at 0.002dB resolution over the selected frequency range.interpolation is used to maintain calibration as frequency sweep range is decreased.Smoothing:Filtering, adjustable in five levels,to reduce noise and interference on low-level traces. Channels may be independently set.Averaging:2, 4, 8, 16, 32, 64, 128, or 256successive traces may be averaged together to remove unwanted noise. Channels may be independently set.Limit Lines:Two limit lines, either single value or multi-level segmented, for each plex lines may be made from up to 10individually-editable segments.Trace Mask: A swept measurement can be stored to a graticule Trace Mask for visual comparison to later measurements.Save/Recall:Thirteen sets of front-panel set-ups and thirteen sets of trace memory can be stored in non-volatile instrument memory. Stored set-ups may be previewed on the CRT or printed prior to selection. Non-volatile memory can be erased for security purposes.3.5 Inch DOS Disk Drive:Instrumentconfigurations and trace data can be stored on a MS-DOS ®compatible 3.5 inch, 1.44 MB floppy disk.Trace Data can be stored in a standardized ASCII format which easily reads into common PC spread sheets and word processing software.SourceFrequency Range: 1 MHz to 50GHz internal (see millimeterwave reflectometer for 110GHz coverage).Start-Stop:Sweeps from start frequency to stop frequency.Center-Width:Sweeps from center - (width/2)to center + (width/2)Alternate Sweep:Sweeps alternately between frequency ranges set differently for Channel 1and Channel 2.CW:Provides single frequency output (both channels turned off).Frequency Resolution:RF Models (54107A, 54109A, 54111A):±10 kHz Microwave Models:±100 kHzStart Frequency Accuracy:RF Models (54107A, 54109A, 54111A):±100 kHz Microwave Models to 20 GHz:±200 kHz Microwave Models, 20 to 40 GHz:±400 kHz Microwave Models, 40 to 50 GHz:±800 kHz Sweep Time, Single Band:Typically less than 70 ms for single channel with 101 pointhorizontal resolution, depending on frequency,Measurement System Options:Option 1Rack Mounting with Slides Option 270 dB RF Step AttenuatorOption 2A 70 dB, 20 GHz Step Attenuator Option 2B 70 dB, 26.5 GHz Step Attenuator Option 2C 70 dB, 40 GHz Step Attenuator Option 2D 70 dB, 50 GHz Step Attenuator Option 475 ohm source output.(Available to 3.0 GHz)Option 5 Add Reference Channel Option 6Add External LevelingOption 7Internal Distance-To-Fault Software Option 8Relative Group Delay Software Option 12Add Front Panel CoverOption 13Add Front Mounted Handles Option 16+15 V DC Supply for MillimeterWave Source Modules (Available with ≤20 GHz Models only)Option 25Maintenance ManualOption 26Extra Operation and GPIBProgramming ManualOption 33Ink-Jet PrinterTransit Case:760-183 Transit Case:Hard shell case with custom foam inserts and carrying handle for maximum protection of the 54100A.averaging, and smoothing settings. Trace update time is typically 130 ms with similar system settings.Residual FM:1 MHz to 20 GHz < 10 kHz Peak 20 GHz to 40 GHz < 20 kHz Peak 40 GHz to 50 GHz < 40 kHz PeakMeasured in 30 Hz to 15 kHz post-detection BW.Output Power:Maximum guaranteed leveled output power is model dependent. Typical unleveled output power exceeds the specified leveled output power. Operation with unleveled output power degrades rated specifications and is not recommended.Reverse Power Protection:Up to 1 Watt.Power Level Accuracy:±1 dB, leveled. ±3.0dB for models above 20 GHz, and ±4.0 dB for 50 GHz models. Add ±0.2 dB for Option 4-75Ωoutput.Power Level Accuracy, Attenuator:Optional 70 dB Step Attenuator (10 dB steps). Leveled power accuracy degrades by ±1.5 dB formodels below 20 GHz and ±1.9 dB for 20 GHz models.Power Level Control, Internally Leveled:Front panel control adjusts power over a 10 dB range (up to 20 dB in some models) or from -70.0dBm to maximum leveled power when Option 2, 2A, 2B, 2C or 2D 70 dB Step Attenuator is installed.Power Level Control, Externally Leveled (Option 6):Front panel control adjusts power range determined by external leveling detector output. Flatness determined by leveling detector and coupler characteristics.Leveling (With External Detector):Levels output power at DUT input positions other than near the 54100A source output. A levelingdetector tracks the RF power level by providing a positive or negative polarity detected signal of 30 to 200 mV to a rear panel BNC connector.Leveled Power Variation:1.0MHz to 1.0 GHz ±0.3 dB ±1.0 dB, Opt 21.0MHz to 2.0 GHz ±0.4 dB ±1.1 dB, Opt 21.0MHz to 3.0 GHz ±0.6 dB ±1.3 dB, Opt 210.0 MHz to 20 GHz ±0.8 dB ±1.0 dB, Opt 2A 10.0 MHz to 26.5 GHz ±1.0dB ±2.5 dB, Opt 2B 10.0 MHz to 32 GHz ±2.0 dB ±2.0 dB, Opt 2C 10.0 MHz to 40 GHz ±2.0 dB ±2.0 dB, Opt 2C 10.0 MHz to 50 GHz ±3.0 dB ±3.0 dB, Opt 2DAdd ±0.2 for 75 ΩsourcesMarkers:The numerical amplitude of the test data and frequency are displayed. Markers remain fixed at the set frequency, independent of displayed sweep frequency range.Application FunctionsApplication functions speed and ease the task of characterizing antennas, filters, amplifiers, and other microwave devices.Min/Max Hold:Save the minimum and12WSMA, or K Connector®test ports, all with high directivity. The 560-98C50A Convertible SWR Autotester tests devices with SMA, 3.5 mm or K Connectors.GPIBInterface:IEEE-488 interface is standard. All front-panel controls are GPIB controllable except power on/off and CRT intensity.Pass-through commands allow control of the -microwave signal source through the 56100A GPIB port.Data Transfer:The 56100A does not require an external controller; nevertheless, it is capable of providing high speed data transfer of test data and normalization data to an external GPIB controller.Printer/PlotterPlotter:The GPIB interface is compatible with HPGL plotters. Display traces, markers, cursor, and graticule information can be plotted. Printer:Parallel printer interface is compatible with the Canon BJ85 and most EpsonFX-compatible printers.Internal Print and Plot Buffer: A new test can be conducted while previously taken test data are printed or plotted from the internal printer buffer.Portable printers may be purchased locally or through Anritsu. When purchased separately, a Centronics-to-Centronics Printer Interface Cable will be needed for operation with the 56100A.I/O ConnectionsHorizontal Sweep Ramp Input:0 to +10V nominal, +12V maximumSequential Sync Input:+3.5V to +10V blanks trace during synthesizer retrace or bandswitching. -3.5V to -10V defines a marker which when in the range of -8V to -10V is an active marker. Rear panel BNC connector.Retrace Blanking Input:+5V blanks traces during retrace.Rear panel BNC connector.Video Marker Input:±1V to ±10V peak input. Rear panel BNC connector.System GPIB:Connects 56100A to GPIB. Rear panel GPIB connector.Dedicated GPIB:Connects 56100A to signal source and plotter. Rear panel GPIB connector. Parallel Printer (Centronics):Connects 56100A to printer.Rear panel.AUX I/O:Connects 56100A to compatible source. Rear panel.GeneralSelf Test:Performs a self test every time power is applied or when SELF TEST pushbutton is pressed. If an error is detected, a diagnostic code appears, identifying the cause and location of the error.Electromagnetic Compatibility and Susceptibility:Compliant with European Community requirements for CE marking.Frequency Accuracy:Same as synthesizer frequency accuracy specification.Inputs:Four inputs, A, B, R1, and R2 accept detected outputs from Anritsu 560 Series Detectors and SWR Autotesters.Dynamic Range:76 dB (-60 dBm to +16 dBm) on all channels, useable to -65 dBm.Data Correction:System residuals, including the average of open and short reflections, are stored during normalization for automatic subtraction from test data.Normalization:During the normalization sequence, each trace is stored with 0.002 dB resolution over any user-selected frequency range. Normalization data are automatically interpolated for ranges less than the original normalized range.Save/Recall:Nine sets of front-panel settings can be stored for later recall. All stored data can be previewed on the CRT or printer output prior to selection. Four of the setups include their own calibration data.DisplayChannels:Two channels are used to select and simultaneously display any two inputs from A, B, R1, or R2. The same inputs can be displayed as ratios of A/R1, A/R2, B/R1, or B/R2. Alternate Sweep:Displays alternate sweeps between the current front-panel setup and any of nine stored setups.Graticule:Ten vertical divisions. Horizontal divisions are setautomatically in frequency increments of a 1, 2, 5 sequence. Graticule On/Off control turns all graticule lines off. Tick marks remain on axis to indicate graticule position.Display Resolution:Horizontal:101, 201, or 401 points over selected frequency range.Vertical:0.005 dBLimit Lines:Two lines, either straight or complex, for each trace. Complex lines may be made from up to 10 segments. Measurement data may be compared with limit lines forPass/Fail testing.Scaling:Resolution:0.1 dB to 10 dB per division in 0.1 dB steps with independent control for each channel.Offset Range:-99 dB to +99 dB in 0.1 dB steps.Autoscale:Automatically selects offset and resolution to provide optimum display of test data. Trace Update Time:Typically less than 100 ms, varying with frequency range and the averaging and smoothing settings. Smoothing:Off, Minimum, and Maximum selections use analog techniques to reduce noise on low-level traces. Trace update time is automatically adjusted for any combination of averaging and smoothing.Averaging:4, 8, 16, 32, 64, 128, or 256 successive traces can be averaged to smooth the trace display.CRT Intensity:Continuously adjustable from off to bright.Markers and CursorMarkers:Displays up to ten numerically identified markers (F1 thru F9) generated by the 68C or 69B Series Synthesizers. When a marker is selected as “Active”, the cursor can be moved directly to the marker. The cursor can also be moved sequentially through markers until the desired marker is reached.Cursor:Continuously variable with the tuning knob. The frequency and amplitude of test data at the cursor on both traces are digitally displayed.Relative Cursor:Displays the frequency and amplitude difference between the main Cursor and the Relative Cursor for both traces. A menu selection reverses the position of the two cursors.Cursor Min/Max:Automatically moves the cursor to the minimum or maximum value of test data on either trace.Cursor “X” dB:Automatically moves cursor on either trace to an amplitude that is equal to the entered value of “X” dB or dBm.Cursor “X” Bandwidth:Automatically displays cursors to the right and left of the cursor at the frequencies where the test data are equal to the entered value of “X” dB. The frequencies of the low and high cursors and the bandwidth between them are displayed.Cursor Next Marker:Moves cursor to next highest frequency marker.Cursor Active Marker:Moves cursor to the frequency of the active marker. SourceInternal software provides system compatibility with the following sources.Anritsu 69A/B Anritsu 68B/CAnritsu 67XXA/B Anritsu 6600A/BHP 8340/8350 seriesSee individual source data sheet for specifications.Superior AccuracyThe 56100A is designed to provide superior accuracy to 110 GHz. When used with a synthesizer’s step sweep mode, all measurement frequencies, including markers and cursors, have synthesizer accuracy. The exceptional return-loss accuracy is attributable to the low synthesizer harmonics and spurious, the high directivity and exceptional test port match of the Anritsu SWR Autotesters. To avoid the use of error-producing adapters, SWR Autotesters are available with GPC-7, Type N,High Performance Scalar MeasurementsThe Anritsu 56100A Scalar Network Analyzer combined with a Anritsu 68C Series or 69B Series Synthesizer, forms a powerful swept frequency measurement system for both production and design applications.Measure insertion loss, insertion gain, or RF power with 76 dB dynamic range over the 10 MHz to over 50 GHz frequency range—the widest frequency range available in coax. Measure device match as return loss in dB or as SWR.Separate detectors can be used on all four inputs for multiple transmission measurements on duplexers or matched amplifiers. Direct detection allows simultaneous RF power measurement at different frequencies for example, at the RF, IF, and LO frequencies of mixers and converters.VersatileTransmission and reflection measurements can be viewed simultaneously. Both traces can be scaled independently in dB, dBm or SWR. Measurement of the ratio of two detector inputs may be applied to either channel for enhancing accuracy or for viewing differences. Built-in calibration allows subtraction of the unwanted transmission frequency response and the average of open/short reflections.A Volt Mode is available for displaying voltage (with Volt Mode Adapter Cable). A 0 to 10 Volt Sweep Ramp Output Mode is also available. These modes, combined with a versatile Trace Memory Mode, allow easy testing of VCOs, PIN diodes, and detectors. MeasurementsMeasurement systems using the 56100A Scalar Network Analyzer include components from 1 MHz to 110 GHz.Function:The 56100A has four detector inputs and two independent channels for measurement and display of detected RF power from Anritsu 560 Series Detectors and SWR Autotesters. Two independent channels display RF power (dBm), Transmission Gain or Loss in (dB), or reflected power. Voltage may be displayed with optional Volt Mode Adapter Cable. Measurement Modes:Measures and displays in dB swept transmission and return loss characteristics. Power is displayed in dBm. Complete measurement parameters for all modes are displayed.Frequency Range:10 MHz to over 50 GHz in coax using Anritsu 560 Series Detectors and SWR Autotesters. Waveguide measurement components to 110 GHz support transmission, reflection, and power measurements.Temperature Range:Operating:0°C to +50°CStorage:-40°C to +70°CPower:100/120/220/240V AC +5%/-10%, 48-63 Hz, 100 VA maximumDimensions:77 H x 426 W x 476 D mm +51 mm for feet(7 H x 16.75 W x 18.75 D in. +2.0 in. for feet)Weight:18 kg (39 Ib.)OptionsTransit Case40010 Transit Case:Hard shell case with custom foam inserts and carrying handle for maximum protection of the 56100A.Option 1Rack Mounting 19 inch rack mountwith slides optionalOption 12Front Panel CoverOption 13Front Mounted HandlesOption 25Maintenance ManualOption 26Extra Operation and GPIBProgramming ManualOption 33Ink-Jet Printer。
Actix-Analyzer无线网络优化指导手册

Actix-Analyzer无线网络优化指导手册2017年1月网络优化中心目录1.介绍 (3)1.1手册目标 (3)1.2关键功能 (3)1.3硬件需求 (3)2.Actix使用说明 (4)2.1安装说明 (4)2.2工参制作 (5)2.3导入/回放数据 (6)2.4常用参数 (7)2.5图例设置 (9)2.6图层导出 (10)2.7邻区窗口显示 (11)2.8信令显示 (13)2.9小数据合并 (14)2.10海量数据处理 (16)2.11 Query功能介绍 (23)3.常见问题案例分析 (29)3.1问题1:天馈接反 (29)3.2问题2:弱覆盖 (31)3.3问题3:质差 (33)1.介绍1.1手册目标学会安装并使用Actix分析软件,熟悉软件界面和功能模块。
●掌握每个参数在Analyzer中的位置和名称。
●了解常见的网络问题以及如何将它们在Analyzer中归类。
●熟练使用Actix-Analyzer软件来分析路测数据,发现网络问题,最终解决网络问题。
1.2关键功能Analyzer包含下列关键的功能:✓支持多厂家,多种技术的路测数据文件格式: Analyzer支持主要前台厂家最新HSPA+和LTE解码;✓详细的网络测量信息:Analyzer支持最新的HSPA+和LTE功能,包括CQI, 帧使用率和调制方式;✓灵活的语音和数据业务KPI: Analyzer强大的定制功能支持从上至下的各级KPI,允许运营商评估不同的语音和数据业务的质量。
✓Layer3 分析:Analyzer提供内置的层三分析功能,支持详细的路测数据层3信令层面分析;✓IP包检视:Analyzer支持全部IP层的解码和数据进程分析,提供IP业务层的全方位检视。
✓性能报表:Analyzer允许用户创建并定制报告,以便用户快速创建分析和验收报告。
1.3硬件需求个人电脑应具备满足以下最小条件:项目要求处理器1+ GHz架构SQL Server 2005 企业版SP2 和.NET 1.1 & 3.5 会随Actix软件自动安装操作系统Windows 7和Windows 2008 Server Service Pack 3 或更新. Windows Server 2003标准版, 企业版, 或者Datacenter editions with Service Pack 1 或更新。
Analyzer使用指导书
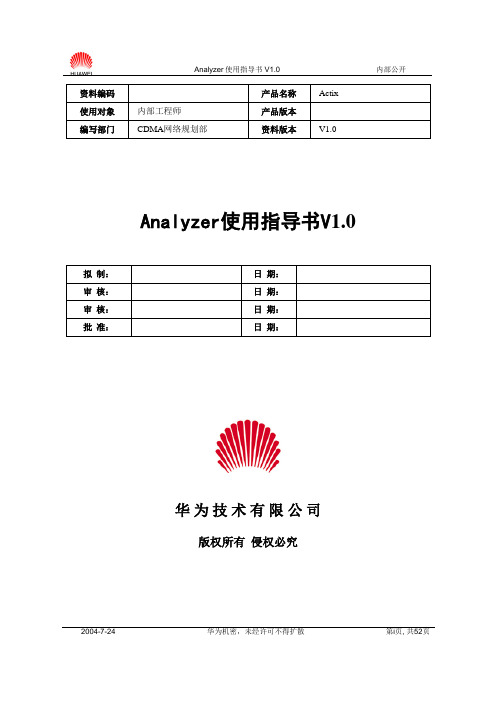
2004-7-24华为机密,未经许可不得扩散第i 页, 共52页资料编码产品名称 Actix 使用对象 内部工程师产品版本 编写部门CDMA 网络规划部 资料版本V1.0Analyzer 使用指导书V 1.0拟 制: 日 期: 审 核: 日 期: 审 核: 日 期: 批 准:日 期:华 为 技 术 有 限 公 司版权所有 侵权必究2004-7-24华为机密,未经许可不得扩散第ii 页, 共52页修订记录目录第1章概述 (4)1.1 主要功能 (4)1.2 Analyzer主要优点 (4)1.3 支持的数据格式 (4)1.4 系统配置要求 (5)第2章使用Analyzer (7)2.1 启动Analyzer (7)2.2 设置Analyzer (7)2.2.1 导入地图 (8)2.2.2 导入基站数据 (10)2.2.3 数据平均(更改数据采样频率) (16)2.3 导入测试数据和分析 (17)2.4 功能介绍 (24)2.4.1 重放功能 (24)2.4.2 StateForms 功能 (25)2.4.3 通过消息浏览器查看数据 (26)2.4.4 创建报告 (27)2.4.5 反向链路数据分析 (30)第3章 Analyzer的定性分析 (31)3.1 查询功能 (31)3.2 FER的查询及过滤 (32)3.3 音质差的查询及过滤 (33)3.4 Binned查询分析:识别导频污染 (34)3.5 事件查询—掉话窗口 (36)3.6 显示事件查询 (41)3.7 CDMA StateTip:决定Serving PNs (41)第4章复杂网络分析 (42)4.1 对多载频网络进行统计 (42)4.2 CDMA网络参数优化 (44)4.2.1 使用CDMA工具包做Search Window分析 (45)4.2.2 使用CDMA工具包做Neighbor List分析 (47)第5章帮助文件 (50)关键词:1XEV-DO Map Chart Table摘要:Actix公司的Analyzer是一个针对无线网络优化的后处理工具。
ActixAnalyzer之WCDMA网络优化(精)

此文档包括如下WCDMA网优相关内容WCDMA常用参数 (2浏览和回放数据 (12小数据合并 (17处理海量数据 (20统计报告 (29如何分析导频污染 (34WCDMA常用参数 WCDMA网络常用网络参数在Actix 软件中在如下图所示的位置。
接收功率RSSI发射功率Tx PowerSIR和Target SIRBLER激活集和监视集中的SC邻集中SC网络信息这些参数可以通过点击右键选择“Add To Favorites”:这样以后再导入更多的测试log,就可以在Favorites页中仅仅看到我们所添加的参数,其他众多无关的参数就不会出现了:浏览和回放数据常用的数据浏览和回放方式如下图所示。
如在地图上显示:如需要修改地图颜色图例,在图例上点右键选择Modify Range:如果要导出成mapinfo 地图:查看信令,在手机名上点右键: 所有窗口都是同步的所有窗口都同步小数据合并在数据分析中,我们经常要将若干个小的路测数据进行合并,然后统一生成地图、报告等。
比如我们导入了3个小的数据:在如下位置进行合并:选择需要合并的手机,比如将WCDMA手机合并一个;再将EVDO手机合并一个:合并后如下:注意,SuperStream仅仅适用于不超过100M~200M的小数据,当数据超过200M 的时候往往会出现众多的无法预知的错误;对于超过200M的数据我们建议使用下边章节介绍的Repository功能。
处理海量数据前边我们介绍的如何回放和浏览数据,操作虽然方便,但是如果处理海量数据就比较消耗内存了,下边我们介绍如何在Analyzer中处理上G、甚至上十G的数据。
我们使用Analyzer中的Repository功能来处理海量数据。
Repository就相当于一个存放数据的仓库,我们对这个数据仓库的使用遵循着三个步骤:创建一个仓库模板(包含了参数的选择和平均方式的选择两个问题;根据这个模板创建一个仓库;向仓库中存放数据。
- 1、下载文档前请自行甄别文档内容的完整性,平台不提供额外的编辑、内容补充、找答案等附加服务。
- 2、"仅部分预览"的文档,不可在线预览部分如存在完整性等问题,可反馈申请退款(可完整预览的文档不适用该条件!)。
- 3、如文档侵犯您的权益,请联系客服反馈,我们会尽快为您处理(人工客服工作时间:9:00-18:30)。
用户手册目标
•了解常见的网络问题以及如何将它们在Analyzer中归类。 •配置Analyzer运行数据。 •了解预先定义的Analyzer分析报告。 •在Analyzer中学会手动分析(创建自定义的分析方法,query和报表,数据仓库和窗口布局) •使用Analyzer来分析多个不同的log文件中的问题。 •了解Analyzer的异常事件分析门限以及如何修改它们。
硬件需求
个人电脑应具备满足以下最小条件:: 项目 处理器 架构 1+ GHz SQL Server 2005 企业版 SP2 和 .NET 1.1 & 3.5 会随Actix软件 自动安装 操作系统 Windows 7和 Windows 2008 Server Service Pack 3 或更新. Windows Server 2003标准版, 企业版, 或者 Datacenter editions with Service Pack 1 或更新。 Windows Server 2003 Web Edition SP1. Windows Small Business Server 2003 with SP1 or later. Windows Vista with SP1或更新. Actix软件支持 64-bit Windows,但是按照 32-bit 应用程序来处理. 内存 硬盘 其他需求 1+ GB 2 GB Microsoft Internet Explorer 6.0 SP1 或更新. Microsoft Office XP 或更新 (Actix软件需要) 要求
官方微薄: /actix 官方 QQ 技术讨论群: 337112204 4
Analyzer LTE 用户手册
Actix 桌面后处理分析软件概述
ACTIX 桌面后处理分析软件概述 ........................................................................ 5
ANALYZER 是什么? ................................................................................................. 5 关键功能 ......................................................................................................... 5
பைடு நூலகம்
Analyzer LTE 用户手册
目 录
介绍 ......................................................................................................... 3
ACTIX ANALYZER 产品的先决条件 ............................................................................... 3 硬件需求 ............................................................................................................. 3 用户手册目标 ....................................................................................................... 3 帮助文件 ............................................................................................................. 4
Actix Analyzer LTE 用户手册
软件版本 V5
Analyzer LTE User Guide
The content of this manual is provided for information only, is subject to change without notice, and should not be construed as a commitment by Actix. Actix assumes no responsibility or liability for any errors or inaccuracies that appear in this documentation. Copyright © Actix. All rights reserved. All trademarks are hereby acknowledged.
ANALYZER .................................................................................................. 6
用 ANALYZER 能做什么? ........................................................................................... 6 开始 STARTING UP ................................................................................................. 7 浏览工作区 EXPLORING WORKSPACE ............................................................................ 9 查看数据 VIEWING DATA ........................................................................................ 13 在图表中显示参数 Displaying on chart ................................................................ 13 在地图上显示参数 Displaying on Map ................................................................. 17 在表格中显示参数 Displaying in a Table .............................................................. 19 LTE 分析功能介绍 PERFORMING LTE ANALYSIS ............................................................. 21 Stateform .................................................................................................... 21 协议栈浏览器 Protocol Stack Browser ................................................................ 25 自定义 LTE 分析功能 PERFORMING CUSTOMIZED LTE ANALYSIS ......................................... 26 Queries 介绍 ................................................................................................. 26 Binned Query ............................................................................................... 27 Histogram.................................................................................................... 28 Crosstab Query ............................................................................................ 29 网络性能报告 REPORTING NETWORK PERFORMANCE ........................................................ 32 创建定制单一文件报告 ...................................................................................... 32 创建定制多文件报告 ......................................................................................... 35 超级流 Superstream ....................................................................................... 39 数据仓库 Repository ....................................................................................... 41 保存工作 SAVING YOUR WORK ................................................................................. 48 保存窗口布局 ................................................................................................. 48