Formation of the NiCrOxMgO and NiMgO Catalysts for Carbon Dioxide Reforming of Methane
食品中铁、锰元素检测方法探讨

食品科技食品中铁、锰元素检测方法探讨史秋梅(临沂市河东区疾病预防控制中心,山东临沂 276034)摘 要:铁元素和锰元素是人体必需的微量元素,在多种生理机能中发挥着关键作用。
然而,过度摄入可能会对人体产生不利的影响,因此食品中铁元素和锰元素的分析检测显得尤为重要。
本文介绍了食品中铁元素和锰元素分析的必要性,并针对食品中铁、锰元素的检测分析方法,如原子吸收光谱法、高效液相色谱法、电感耦合等离子体原子发射光谱法、电感耦合等离子体质谱法以及X射线荧光光谱法等进行了概述,以期保障食品中铁、锰元素含量的安全性和合规性,从而更好地服务于食品分析领域。
关键词:铁元素;锰元素;分析方法;应用;食品安全Exploration of Detection Methods for Iron and ManganeseElements in FoodSHI Qiumei(Hedong District Center for Disease Control and Prevention, Linyi 276034, China) Abstract: Iron and manganese are essential trace elements for the human body and play crucial roles in various physiological functions. However, excessive intake may have adverse effects on the human body, so the analysis and detection of iron and manganese elements in food is particularly important. This article introduces the necessity of analyzing iron and manganese elements in food, and provides an overview of detection and analysis methods for iron and manganese elements in food, such as atomic absorption spectroscopy, high-performance liquid chromatography, ionization coupled plasma atomic emission spectroscopy, ionization coupled plasma mass spectrometry, and X-ray fluorescence spectroscopy, in order to ensure the safety and compliance of iron and manganese content in food, so as to better serve the field of food analysis.Keywords: iron; manganese; analytical methods; applications; food safety铁和锰是食品中的两种微量元素,对维持身体健康具有重要意义[1]。
The Science of Colloids and Interfaces

The Science of Colloids and Interfaces IntroductionColloids and interfaces are very important in our daily lives, but we usually don't even think about them. Every time we drink a glass of milk, apply lotion to our skin, or even breathe, we are encountering colloids and interfaces. In this article, we will take a closer look at the science of colloids and interfaces, and explore some of their fascinating properties and applications.What are Colloids and Interfaces?Colloids are particles that are too small to see with the naked eye, but are also too large to behave like molecules. They are typically between 1 and 1000 nanometers in diameter, and can exist in a variety of states, such as liquids, gels, or solids. Some common examples of colloids include milk, paint, and blood.Interfaces, on the other hand, are the boundaries between two different phases of matter, such as between a liquid and a gas, or between a solid and a liquid. They are typically very thin and can have unique properties that are different from either of the phases they separate.Together, colloids and interfaces play a crucial role in many natural and manufactured systems. For example, they are involved in the formation of clouds, the stability of emulsions, and the function of biological membranes.Properties of Colloids and InterfacesOne of the most important properties of colloids and interfaces is their surface area. Since they are made up of small particles or thin boundaries, they have a very high surface area per unit of volume. This gives them unique properties, such as the ability to adsorb (or stick to) certain chemicals or ions.Colloids and interfaces can also exhibit unique mechanical and rheological (flow) properties. For example, some colloids can become more viscous (thick) or less viscous(thin) depending on the amount of stress applied to them. This property is known as shear-thickening or shear-thinning, respectively, and has important implications for a variety of applications, such as the design of protective clothing or sports equipment.Applications of Colloids and InterfacesDue to their unique properties, colloids and interfaces are used in a wide range of applications, from food and personal care products to energy and advanced materials. Some examples include:1. Food and Beverages: Colloids and interfaces play a crucial role in many of our favorite foods and drinks, such as ice cream, beer, and chocolate. They help to stabilize emulsions, create foams, and improve texture and mouthfeel.2. Personal Care Products: Many personal care products, such as lotions, shampoos, and makeup, contain colloids and interfaces. These ingredients help to improve the feel and spreadability of the products, as well as stabilize emulsions and suspensions.3. Energy: Colloids and interfaces are critical for many energy-related applications, such as batteries, fuel cells, and solar cells. They can help to improve the performance and efficiency of these devices, as well as reduce their cost.4. Advanced Materials: Colloids and interfaces are also used in the development of advanced materials with novel properties and functions, such as self-healing materials, superhydrophobic surfaces, and flexible electronic devices.ConclusionIn conclusion, the science of colloids and interfaces is a fascinating and important field that underpins many natural and engineered systems. The unique properties of colloids and interfaces make them applicable in a wide range of fields, from food and personal care products to energy and advanced materials. By understanding and harnessing these properties, we can develop new and innovative products and technologies that improve our quality of life.。
galacto-oligosaccharides and other prebiotics

R E V I E W A RT I C L EBacterial metabolism and health-related effects of galacto-oligosaccharides and other prebioticsG.T.Macfarlane,H.Steed and S.MacfarlaneDundee University Gut Group,Ninewells Hospital Medical School,Dundee,UKIntroductionThere is still a widespread belief that while food intake may regulate certain metabolic activities associated with intestinal micro-organisms,changing diet has little effect on the overall composition and structure of microbial communities in the human gut(Macfarlane and Macfar-lane2003).However,the introduction of prebiotics into the diet in recent years has raised a serious challenge to this concept,and it is increasingly being recognized that the species composition of the microbiota,as well as many of its physiological traits,can be modified by rela-tively small changes in food consumption.The original definition of a prebiotic was put forward by Gibson and Roberfroid(1995)as‘a nondigestible food ingredient that beneficially affects the host by selectively stimulating the growth and⁄or activity of one or a limited number of bacteria in the colon and thus improves health’.This has recently been amended to‘A prebiotic is a selectively fermented ingredient that allows specific changes,both in the composition and⁄or activity in the gastrointestinal microbiota that confers benefits upon host well-being and health.’In practice,the beneficial bacteria that serve as targets for prebiotics have been almost exclusively bifidobacteria and lactobacilli(Gibson et al.1999;Bouhnik et al.2004).Unlike the situation with probiotics,where allochthonous micro-organisms are being introduced to the gut,and have to compete against established colonic communities,an advantage of using prebiotics to modify gut function is that the target bacteria are already commensal to the large intestine.As a consequence,prebiotics are arguably a more practical and efficient way to manipulate the gut microflora than probi-otics.However,the other side of the coin is that if for any reason,such as disease,ageing,antibiotic or drug therapy,the appropriate health-promoting species are notKeywordsbifidobacteria,fermentation,fructo-oligosaccharides,galacto-oligosaccharides,gut bacteria,gut health,immunomodulation, prebiotics.CorrespondenceG.T.Macfarlane,Dundee University Gut Group,Ninewells Hospital Medical School, Dundee DD19SY,UK.E-mail:g.t.macfarlane@2007⁄0649:received23April2007,revised 18June2007and accepted19June2007doi:10.1111/j.1365-2672.2007.03520.x SummaryMost studies involving prebiotic oligosaccharides have been carried out using inulin and its fructo-oligosaccharide(FOS)derivatives,together with various forms of galacto-oligosaccharides(GOS).Although many intestinal bacteria are able to grow on these carbohydrates,most investigations have demonstrated that the growth of bifidobacteria,and to a lesser degree lactobacilli,is particu-larly favoured.Because of their safety,stability,organoleptic properties,resis-tance to digestion in the upper bowel and fermentability in the colon,as well as their abilities to promote the growth of beneficial bacteria in the gut,these prebiotics are being increasingly incorporated into the Western diet.Inulin-derived oligosaccharides and GOS are mildly laxative,but can result inflatu-lence and osmotic diarrhoea if taken in large amounts.However,their effects on large bowel habit are relatively minor.Although the literature dealing with the health significance of prebiotics is not as extensive as that concerning pro-biotics,considerable evidence has accrued showing that consumption of GOS and FOS can have significant health benefits,particularly in relation to their putative anti-cancer properties,influence on mineral absorption,lipid metabo-lism,and anti-inflammatory and other immune effects such as atopic disease. In many instances,prebiotics seem to be more effective when used as part of a synbiotic combination.Journal of Applied Microbiology ISSN1364-5072present in the bowel,the prebiotic is unlikely to be effective.Potential prebiotic oligosaccharides can be classified according to their chemical constituents and degree of polymerization(d.p.),and include manno-oligosaccha-rides(Zentek et al.2002),pectic-oligosaccharides(Olano-Martin et al.2003),soybean-oligosaccharides(Saito et al. 1992),isomalto-oligosaccharides(Morgan et al.1992), xylo-oligosaccharides(Campbell et al.1997)and lactulose (Tuohy et al.2002).However,as reviewed recently(Mac-farlane et al.2006),the vast majority of studies on pre-biotics have focused on inulin,fructo-oligosaccharides (FOS)and galacto-oligosaccharides⁄transgalactosylated-oligosaccharides(GOS⁄TOS).This latter group of carbo-hydrates in particular,has a history of safe commercial use, and are not classified under the category of novel foods. FOS and GOS are not sensitive to gastric acid and do not serve as substrates for hydrolytic enzymes in the upper digestive tract.Japan was a pioneer in adding short-chain FOS to commercially available foodstuffs,and ‘Neosugar’can be found in more than500food products (Guarner2005).GOS are stable at high temperatures in acidic environments and the calorific value of these oligo-saccharides is only1Æ7kcal g)1,which makes them of particular interest to the food and drink industry,for both their prebiotic properties,and their use as sweeten-ers,especially in confectionary,acidic beverages and fer-mented milks(Watanuki et al.1996).The calorific energy value of FOS is similarly low,at1Æ5kcal g)1(Roberfroid 2005).The consumption of8g of oligofructose per day in20healthy subjects has been shown to promote satiety and reduce food intake(Cani et al.2006).Numerous health claims have been made on behalf of prebiotics from investigations undertaken in vivo and in vitro.Much of this work has been carried out with FOS alone,or in combination with inulin,FOS and GOS in combination, and to a lesser extent,with GOS alone(Table1).More-over,a number of studies have been carried out using synbiotics,which are combinations of a probiotic and prebiotic.The rationale here is that the prebiotic stimu-lates growth of the probiotic in the gut,giving the organ-ism a competitive advantage over indigenous species. While most research interest has focused on the ferment-ability and bifidogenicity of oligosaccharide prebiotics, in vitro studies have shown that a number of these substances mimic eurkaryotic cell surface receptors that virulent bacteria adhere to as part of the pathogenicity process.For example,GOS was shown to inhibit attach-ment of EPEC(enteropathogenic Escherichia coli)to HEp-2 and Caco-2cells,and to be more effective than either inulin or FOS(Shoaf et al.2006).Moreover,TOS was found to enhance the protective abilities of Bifidobacterium breve in mice infected with Salmonella enterica serovar Typhimurium(Asahara et al.2001).In addition to the anti-adherent effects of some oligosaccharides,short-chain chito-oligosaccharides have been reported to have specific anti-bacterial properties(Sekiguchi et al.1994).If mani-fested in vivo in humans,these qualities could in principle enable prebiotic oligosaccharides to be protective in the small intestine,as well as in the colon;however,it is unclear at the moment whether sufficient amounts could be delivered to have any significant therapeutic effects. Galacto-oligosaccharidesGOS in human milkOne of the earliest sources of GOS was human milk, which contains approx.7%carbohydrates,90%of which is lactose,and a variety of oligosaccharides based on lac-tose(ESPGAN Committee on Nutrition.1977;Miller et al.1994).Milk contains a greater proportion of neutral (1%)compared to acidic(0Æ1%)oligosaccharides(Thurl et al.1996;Boehm et al.2005).Oligosaccharides are the third largest component of human milk(Newburg1997), and high levels are found in the colostrum where these substances constitute up to24%of total colostrum carbo-hydrates.Concentrations of these substances in breast milk steadily decrease to between19%and15%in the first2months after birth(Miller et al.1994).Oligosac-charides in breast milk can reach concentrations as high as8–12g l)1(Kunz and Rudloff1996;Kunz et al.2000), which is100times greater than in cow’s milk.The princi-pal sugar components of oligosaccharides in human milk are sialic acid,N-acetylglucosamine,l-fucose,d-glucose and d-galactose.This results in a complex mix of over 130different oligosaccharides,because of the great variety of different sugar combinations that are possible(Brand-Miller and McVeagh1999).The type of oligosaccharides produced is influenced by the mother’s Lewis blood group.Human milk contains a large amount of galactose with the backbone structure based on lactose(galactose–glucose)plus a further external galactose residue.This leads to the formation of three galactosyl-lactoses,3¢,4¢and6¢-galactosyl-lactose(Boehm et al.2005).6¢-Galacto-syllactose is found in amounts ranging between2Æ0–3Æ9mg l)1(Yamashita and Kobata1974),and the total concentration of GOS in human milk is approx.1g l)1 (Angus et al.2005).At the beginning of the last century,it was thought that there were factors in human milk that could promote the growth of certain types of intestinal bacteria(Moro 1900).Bifidogenic nucleotides have been detected in human milk(Gil and Rueda2000),and many studies using conventional culture and molecular techniques for bacterial identification have shown that breast-fed infantsGalacto-oligosaccharide prebiotics G.T.Macfarlane et al.have an intestinal microbiota that is dominated by bifido-bacteria,which differs from that of infants fed on cow’s milk.These microbiotas are characterized by slightly lower counts of bifidobacteria,with greater numbers of more potentially harmful organisms such as clostridia and enterococci(Harmsen et al.2000;Macfarlane et al.2004). Higher levels of ammonia,amines and phenols and other potentially harmful substances have also been found in babies fed powdered milk products(Heavey et al.2003). The preponderance of bifidobacteria in breast-fed babies is thought to result from their abilities to utilize oligosac-charides in breast milk,including GOS(Harmsen et al. 2000;Newburg2000),which infants cannot digest in the upper gut(Engfer et al.2000).While it would be difficultTable1Microbiological changes reported in human feeding studies with galacto-oligosaccharides(GOS)Substrate Type of study Delivery Effect on microbiota ReferenceGOS Placebo controlled studyinvolving12subjects 10g prebiotic fed daily for8weeksFaecal excretion ofbifidobacteria andlactobacilli increasedIto et al.(1990)GOS Feeding study with12subjects 2Æ5g prebiotic given per dayfor3weeksIncreased bifidobacteria infaeces,reductions innumbers of clostridia andbacteroidesIto et al.(1993)Transgalactosylated-oligosaccharides (TOS)Feeding study with8volunteersSubjects given10g TOS for3weeksSignificant increases in faecalbifidobacteria,enterobacteria unaffectedBouhnik et al.(1997)TOS Parallel study involving40healthy subjects 7Æ5or15g prebiotic fed perday for3weeksNo effects on bifidobacteria.Lactobacilli increased in15g day)1group,noeffects on clostridia,smallreductions in enterobacteriaAlles et al.(1999a)GOS⁄fructo-oligosaccharide (FOS)Placebo-controlled studywith90term infantsInfant formula supplementedwith either4or8g l–1lowmolecular weight GOS andhigh molecular weight FOSfor28daysSignificantly increasedlactobacilli andbifidobacteria in the twoGOS feeding groups.Bifidogenic effects weredose-dependent.Moro et al.(2002)GOS Placebo-controlled studyinvolving30subjects Volunteers given8Æ1g GOSsyrup,8Æ1g GOS plus3·1010Bifidobacteriumlactis Bb-12,or3·1010Bif.lactis without GOS for3weeksLittle change in faecalbifidobacteria seen withGOS alone.GOS plus Bif.lactis and ctis on itsown resulted in faecalexcretion of the organism,and reduced numbersof Bif.longumMalinen et al.(2002)GOS⁄FOS (9:1ratio)Double-blinded,randomized-controlled trial(DBRCT)involving20infants aged28–90daysInfant formula supplementedwith0Æ8g100ml–1GOS⁄FOS for6weeksIncreased total bifidobacteriacounts in stools.ReducedBif.adolescentis comparedto standard infant formulacontrols.Bifidobacteriaspecies composition inprebiotic infants similar tothat found in breast-fedbabies,with Bif.infantis,Bif.breve and Bif.longumpredominatingHaarman and Knol(2005)GOS⁄FOS (9:1ratio)Feeding study involving42preterm infants,15placebos,and a referencegroup given fortifiedmothers milkFormula food supplementedwith10g l–1prebioticmixtureBifidobacteria numbersgreatly increased frominitially low levels,comparedto un-supplemented controls.No significant effects onbacteroides,clostridia,enterobacteria or yeastsBoehm et al.(2005)G.T.Macfarlane et al.Galacto-oligosaccharide prebioticsto completely replicate all of the constituents of human milk to fortify infant formulas,the incorporation of man-ufactured prebiotics such as GOS can be a useful addition to formula feeds to replicate some of the functional attri-butes associated with breast milk,particularly its bifido-genic effects.However,the ability of GOS to resemble glycoconjugate structures on cell surface receptors used by pathogens for adherence in the gut may also protect babies from infection in early life(Kunz and Rudloff 1996;Newburg1997).Based on the analysis of human milk and the high concentration of galactose,a mixture of10%long-chain FOS(inulin)and90%GOS has been developed to simulate human milk for use in infant for-mulas(Boehm et al.2002;Weaver2003).When this mix-ture was fed to term and preterm infants,it resulted in an increase in intestinal bifidobacteria and lactobacilli, with a gut microbiota and faecal fermentation product composition more resembling that of breast-fed infants (Haarman and Knol2005;Moro and Arslanoglu2005). Similar results have been obtained in several other studies involving young children using the same prebiotic combi-nation(see later).Production and structure of GOSGalacto-oligosaccharides is principally formed by enzymic treatment of lactose by b-galactosidase to produce several oligomers of different chain lengths(Prenosil et al.1987). They usually have a d.p.between2and10with a termi-nal glucose.GOS can be produced from lactose in cow’s milk,but the main raw material for its production for commercial products is usually whey-derived lactose (Yanahira et al.1995).This is formed in large amounts as a by-product of the dairy industry,and as cheese produc-tion increases there is a need for more efficient and prac-tical methods of reducing this waste.One way this could be performed is by the production of GOS.GOS is pro-duced by b-galactosidases that have transgalactosylation activities(Fig.1),which results in the formation of4¢-or 6¢-galactosylactose,longer oligosaccharides,transgalac-tosylated disaccharides and nonreducing oligosaccharides (Angus et al.2005).For GOS production,b-galactosidases from various fungi,yeasts and bacteria are usually immo-bilized on microparticle carriers such as ion exchange res-ins,chitosan,cellulose and agarose beads,orfibrous supports such as cotton cloths,which leads to the forma-tion of different GOS products(Table2).They usually contain24–55%oligosaccharides,and smaller amounts of lactose,glucose and galactose.The enzymes and condi-tions used determine the various glycosidic linkages in thefinal products.b(1,2),b(1,3)and b(1,4)linkages and branched glucose residues occur,while(1,4)and(1,6) linkages are present in the galactan fragment.This vari-ability in glycosidic linkages may be one of the reasons why GOS possess increased resistance to acid digestion (Tomomatsu1994).The amount of GOS produced from lactose has also been shown to depend on the initial con-centrations of lactose present in the reaction mixture,and not on the concentration of b-galactosidase.The resulting products can then be purified by activated carbon,filtered and concentrated before being added to foodstuffs.One way of increasing the specificity of GOS prod-ucts may be by using b-GOS synthesized by bifidobac-teria in the manufacture of the product,as this could preferentially increase numbers of the specific organisms used to produce the substrate.Rabiu et al.(2001)dem-onstrated that the oligosaccharide profiles offive bifido-bacterial species(Bif.angulatum,Bif.infantis,Bif. pseudolongum,Bif.angulatum,Bif.bifidum)differed from the commercial GOS product oligomate55.With the exception of Bif.adolescentis,all of the organisms displayed increased growth rates on GOS prepared by their own b-galactosidase,compared to the commercial product.Properties of GOSGalacto-oligosaccharides preparations are usually trans-parent and more viscous than high-fructose corn syrups. They show good moisture retention and have a high solu-bility.GOS preparations only have about one third of the sweetness of sucrose(Oku1996)and in vitro studies with oral bacteria have shown these substances to have a lowGalacto-oligosaccharide prebiotics G.T.Macfarlane et al.potential for the development of dental caries(Hartemink et al.1997).Because of their stability,GOS can be incor-porated into a wide variety of foods,where they have a pleasant taste,and can increase the texture and mouth-feel of foods,as well as acting as bulking agents.Because of this,GOS and FOS are currently used in a wide range of commercial commodities,including infant formulas, dairy products,sauces,soups,breakfast cereals,beverages, snack bars,ice creams,bakery products,animal feeds,and as sugar replacements(Yang and Silva1995).Physiological effects of prebioticsTo function most effectively,prebiotics need to be resis-tant to digestive processes in the stomach and small bowel,and to come into contact with bacteria growing in the large intestine.Breath hydrogen excretion generally increases following ingestion of prebiotics,indicating that these substances are fermented by gut micro-organisms, but these measurements do not provide information on how much substrate actually escapes digestion in theTable2Studies using various micro-organisms for the production of galacto-oligosaccharides(GOS)from lactoseMicro-organism System Yield Outcome of study ReferenceAspergillus oryzae Enzyme immobilized oncotton cloth membrane in aplugflow reactor GOS production of27%(w⁄w)of initial lactose at50%lactose conversion.70%of GOS producedtrisaccharidesCotton cloth did not affectthe characteristics of theb-galactosidase.Thermalstability of the enzymeincrease25-fold afterimmobilization.Yield severaltimes higher than previouslyreportedAlbayrak andYang(2002)Talaromyces thermophilus b-galactosidase on insolublecarrier Eupergit CMaximum yield34%with80%lactose conversionImmobilization increased thethermostability of theenzymeNakkharat andHaltrich(2006)Lactobacillus reuteri Not stated38%GOS produced atapprox.80%lactoseconversion.Majority ofproducts disaccharidesother than lactoseNo major products with b1–4linkages formedSplechtna et al.(2006)Bacillus stearothermophilus Comparison of enzymeembedded in sodiumalginate,chitosan or gelatinMaximum yield of GOS31Æ2%in stirred reactorwith60%lactoseconcentration.In thepacked bead continuousreactor,the yield was17Æ4–31Æ5%Gelatin proved the bestcarrier for immobilization asdemonstrated by increasedyields.Only20%of the originalyield of the packed bedreactor was lost after140hof reaction timeChenet al.(2001)Escherichia coli GOS produced undercontrollable waterconcentration in reversemicelles Maximum29Æ7%productionof GOS(w⁄w)allolactoseand14%production ofother oligosaccharidesIncreasing the molar ratio ofwater to surfactant.W o,decreased production ofGOSChenet al.(2003)Sterigmatomyces elviae Toluene treated restingbacterial cells used in batchculture or in a newfermentation system withcell growth after theenzymatic reaction todecrease inhibitory glucose37%yield in toluene treatedcells.Increased yield to64%because of newfermentation methodMajor structure found4¢-galactosy-lactose.Yeast high capacity for GOSproduction but lowgalactose production.b-galactosidase had highlevels of transgalactolysationactivity but low levels oflactose-hydrolysis.Highoptimal temperature ofproduction,80°COnishiet al.(1995)Aspergillus candidus Immobilized recombinantb-galactosidase in acontinuous packed-bedreactorMaximum yield32%GOSover20daysRecombinant b-galactosidasehas potential for GOSproductionZhenget al.(2006)G.T.Macfarlane et al.Galacto-oligosaccharide prebioticsupper gut.This is highlighted by the study of Bouhnik et al.(1997),where eight volunteers taking10g TOS per day apparently showed reduced breath H2excretion.In another investigation involving40subjects,feeding up to 15g of TOS per day had no significant effects on faecal pH,short-chain fatty acid(SCFA)excretion,faecal bile acid profiles,or concentrations of putrefactive metabo-lites;however,faecal nitrogen was increased by8Æ5%,and breath hydrogen by130%(Alles et al.1999a).Together with SCFA,H2and CO2are major products of fermentation in the gut,and excess H2formation,and osmotic diarrhoea caused by high levels of SCFA produc-tion,provide a barrier to the unfettered use of prebiotics. Undesirable symptoms caused by fermentation gases have often been reported in human feeding studies involving prebiotics(Hartemink and Rombouts1997;Pedersen et al.1997).Stone-Dorshow and Levitt(1987)gave12 volunteers15g of FOS per day for12days.Eructation, abdominal pain,bloating andflatulence were all signifi-cantly more severe in the FOS group compared to con-trols,while there was no adaptation over the study period.After12days,breath H2measurements following a10-g challenge of prebiotic indicated that there was no difference between the FOS and control groups.Other investigations with FOS in humans,involving doses of5 and20g day–1,have indicated that breath H2increased with substrate challenge,with mildflatulence and bor-borygmi occurring generally,although some individuals reported greater discomfort(Kawaguchi et al.1993;Luo et al.1996).Other evidence suggests that feeding10g FOS per day can be well tolerated,but that the consump-tion of14g can lead to the development of gastrointesti-nal symptoms(Gibson et al.1995;Nadeau1999).With respect to GOS,evidence obtained so far from European studies indicates that GOS is safe to add to infant feeds(Moro et al.2006),and a recent report by the EU Sci-entific Committee on Food has approved the addition of up to0Æ8g100ml)1of a prebiotic mixture comprising 90%GOS and10%FOS in infant formula feeds(Scientific Committee on Food(SCF)2003).Most of the studies with GOS to date have used a recommended dosage of8to 15g day–1,because,like FOS,the consumption of higher levels can lead to abdominal discomfort,cramping,flatu-lence and diarrhoea(Deguchi1997;Teuri et al.1998; Saavedra and Tschernia2002).The recommended dose to detect a bifidogenic effect is thought to be at least10g of GOS per day,but studies in Japan have shown that in healthy adults and the elderly,doses as low as2Æ5g of6¢-GOS can elicit a bifidogenic effect(Ito et al.1993; Ishikawa et al.1995;Teuri and Korpela1998).In one recent study,the safety of a commercial GOS syrup(Vivinal;Barculo Domo,Zwolle,Netherlands) containing45%GOS was determined by orally feeding the prebiotic to rats for90days.FOS supplemented with lactose and glucose and reverse osmosis-deionized (RODI)water were used as controls.Although significant reductions were found in food consumption(7–13%)in animals fed the GOS syrup,and in the FOS group,com-pared to the RODI controls,no toxological manifestations were observed(Anthony et al.2006).These data indicate that the choice of prebiotic substances to use in food products should be made with the ultimate aim of maxi-mizing potential health benefits,and minimizing unwanted side effects.Fermentation reactions in the large intestine Quantitatively,and in terms of their significance in host physiology,SCFA,particularly acetate,propionate and butyrate,are the major end products of microbial fer-mentation processes in the large gut.These metabolites are formed predominantly from polysaccharide,oligosac-charide,protein,peptide and glycoprotein precursors (Macfarlane and Macfarlane2002).Polysaccharides are the most important SCFA progenitors,and many differ-ent types of bacterial hydrolytic enzymes are synthesized by the microbiota to digest these substances and facilitate uptake of their component sugars.In quantitative terms, resistant starches and plant cell wall polysaccharides(cel-luloses and noncellulosic polysaccharides such as arabino-galactans,xylans,pectins,gums and mucilages)are the principal fermentation substrates in the large bowel (Cummings and Englyst1987).Many nutritional,microbiological and host physiologi-cal factors affect fermentation reactions in the large intes-tine,particularly colonic transit time.Other host-related factors that influence metabolic reactions in the microbi-ota and the types of SCFA that are formed in the gut, include ageing,neuroendocrine system activity,stress, pancreatic and other secretions in the digestive tract, mucus production,disease,drugs and antibiotic therapy. From a microbiological viewpoint,the chemical composi-tion,physical form and amount of substrate available also significantly affects the end products of fermentation, which are further dependent on the types and numbers of different bacterial populations in the gut,as well as com-petitive and cooperative interactions between different groups of bacteria in the microbiota.Short-chain fatty acid production is one of the most important physiological processes mediated by colonic micro-organisms.The vast majority of these metabolites are absorbed from the gut,enabling the host to salvage energy from food not digested in the upper bowel.SCFA affect colonic epithelial cell transport processes,energy transduction in colonocytes,growth and cellular differen-tiation,hepatic control of lipid and carbohydrate metabo-Galacto-oligosaccharide prebiotics G.T.Macfarlane et al.lism,and provide energy to muscle,kidney,heart and brain(Cummings1995).Because>95%of SCFA are absorbed from the gut, measurements of these metabolites in stools does not really tell us very much about the fermentability of differ-ent carbohydrates.However,in vitro studies,particularly those involving faecal microbiotas,are useful models for studying fermentation processes.At concentrations of 10g l)1,FOS and GOS were shown to increase acetate and butyrate formation in pH controlled fermenters,with transient accumulation of lactate and succinate(Hopkins and Macfarlane2003).Acetate and lactate formation are consistent with bifidobacterial and lactobacillus metabo-lism,but not butyrate production.However,the butyrige-nicity of FOS has been reported by other workers (Topping and Clifton2001),and recent work by Belen-guer et al.(2006)has shown how butyrate-producing spe-cies such as Anaerostipes caccae and Eubacterium halli can cross-feed on lactate produced by Bif.adolescentis growing on FOS,while a nonlactate utilizing,butyrate-forming Roseburia sp.could assimilate carbohydrate fragments formed when the Bifidobacterium hydrolysed complex polymeric substrates.Indeed,it is important to realize that while prebiotics are often used to stimulate the growth of beneficial bacteria in the gut,they are not entirely specific for these target species,and other organ-isms have been shown to be able to ferment these carbo-hydrates.For example clostridia can utilize FOS(Duncan et al.2003),whereas bacteroides and clostridia have been reported to ferment GOS(Ohtsuka et al.1989). Biological significance of bifidobacteria and lactobacilli in the digestive tractLactobacilli do not occur in great numbers in the human large intestine under normal circumstances;however,sig-nificant bifidobacterial communities are usually present in the colon,although their community sizes and species composition can vary greatly in different human popula-tion groups(Finegold et al.1983).Evidence suggests that Bif.adolescentis and Bif.longum predominate in most adults,whereas Bif.breve and Bif.infantis are the main species colonizing the infant gut(Mitsuoka1984;Scard-ovi1986).Bifidobacteria,together with some lactobacillus species play an important role in the eco-physiology of the colonic microbiota.These organisms have been linked to increased resistance to infection and diarrhoeal disease (Yamazaki et al.1985;Gorbach et al.1987;Tojo et al. 1987;Saavedra et al.1994),stimulation of immune sys-tem activity(Sekine et al.1985;Kirjavainen et al.2002), as well as protection against cancer(Reddy and Rivenson 1993;Sekine et al.1994).Some bifidobacteria and many lactobacillus species manifest strong anti-mutagenic and anti-tumour properties,and in animal models,have pro-phylactic and therapeutic benefits(Hosono et al.1997). This may be related,in part,to immune enhancement effects resulting from the chemical composition and structure of their cell wall components.Bifidobacteria are also known to excrete a range of water soluble vitamins,though these processes generally appear to be species and strain dependent(Deguchi et al. 1985).Thus,some strains of Bif.bifidum and Bif.infantis produce large quantities of folate,nicotinic acid and thia-mine,while Bif.longum and Bif.breve only form small amounts of these substances.These vitamins do not seem to be made at all by Bif.adolescentis.Pyridoxine and vita-min B12are also produced,but not excreted by Bif.breve, Bif.longum,Bif.bifidum,Bif.adolescentis and Bif.infantis. Bacteria growing in the large bowel play an important role in colonization resistance.This can be defined as the mechanisms through which the colonic microbiota pro-tects itself against incursion by invading micro-organisms, thereby playing an important role in the maintenance of paratively little is known in detail about this phenomenon,but it is likely that many different spe-cies,including lactobacilli and bifidobacteria(Lievin et al. 2000)are involved.In vitro fermentation studies with mixed cultures of faecal bacteria growing on inulin and GOS(oligomate55)have demonstrated that the oligosac-charides,especially GOS,inhibited growth and toxin pro-duction by Clostridium difficile(Hopkins and Macfarlane 2003).However,while the GOS preparation,in particular, was shown to be bifidogenic,stimulating growth of Bif. adolescentis,Bif.angulatum and Bif.bifidum,these organ-isms were not responsible for suppressing the pathogen, indicating that other species in the microbiota were pro-tective.In contrast,recent studies have shown that Bif.breve was more effective in protecting mice infected with Esc-herichia coli O157H7,than strains of Bif.bifidum and Bif.catenulatum(Asahara et al.2004).Some lactobacillus and bifidobacterial species form substances that are antag-onistic to other organisms,such as organic acids,hydro-gen peroxide,diacetyl and bacteriocins.Bacteriocin secretion is growth-associated in some species,and is dependent on carbon availability(Lejeune et al.1998). Some of these small proteins and peptides are highly spe-cies-specific.In one study,of13bifidobacterial isolates tested for bacteriocin formation,only one strain formed a protease-sensitive inhibitory substance,with broad spec-trum activity against other bifidobacteria,streptococci, lactobacilli and clostridia,but not Gram-negative organ-isms such as proteus,klebsiella,E.coli or pseudomonas (Meghrous et al.1990).Gibson and Wang(1994) reported that eight different bifidobacterial species pro-duced similar antagonistic substances that were inhibitoryG.T.Macfarlane et al.Galacto-oligosaccharide prebiotics。
纳米氧化镧负载碳上用于催化

1. INTRODUCTION During the past decades, oxygen reduction reaction (ORR) has always been considered as one of the most important electrochemical reactions because of its wide applications in advanced energy storage and conversion devices, such as fuel cells and metal-air batteries.1,2 However, because of the sluggish kinetics of ORR, there is great need for developing efficient electrocatalysts to promote the ORR process. Carbonsupported platinum (Pt/C) is currently thought as the most active electrocatalyst for the ORR process in both alkaline and acidic environments, which has been developed and utilized in various fuel cells and metal-air batteries, but the high cost and limited availability of Pt hinder its further application.3−5 Therefore, it is still a key challenge to develop an ORR catalyst
In Situ Synthesis of Self-Assembled Three-Dimensional Graphene–Magnetic Palladium

■
Among them, bimetal (especially noble-metal-doped graphene) nanohybrids draw more attention, because they possess higher catalytic activity18 and some special properties.19 Now, 3D graphene-based bimetallic nanohybrids have an increasingly important role in the field of science for maximizing the accessibility to the supporter surface and metallic catalytic activity. Therefore, the simple and efficient preparation strategy for the novel 3D graphene-based bimetallic nanohybrids is highly desirable. However, the reported methods for the preparation of 3D graphene structures are still limited, and most are compositions of graphene and substances,20 such as carbon nanotubes21 or polymer frameworks.22 In addition, the reported preparation methods of 3D graphene-metal materials are complicated, especially for bimetallic anchored nanohybrids.18,19 Those processes are almost step-by-step, which is time-consuming and complicated to perform. Meanwhile, some are achieved by using a large number of reducing agents (such as NaHSO3, Na2S, vitamin,
Carbon Nanotube-Quenched Fluorescent Oligonucleotides
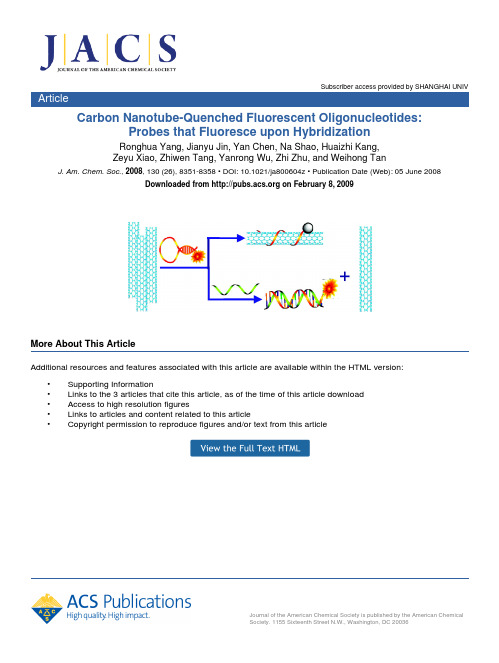
Subscriber access provided by SHANGHAI UNIVJournal of the American Chemical Society is published by the American ChemicalSociety. 1155 Sixteenth Street N.W., Washington, DC 20036ArticleCarbon Nanotube-Quenched Fluorescent Oligonucleotides:Probes that Fluoresce upon HybridizationRonghua Yang, Jianyu Jin, Yan Chen, Na Shao, Huaizhi Kang,Zeyu Xiao, Zhiwen Tang, Yanrong Wu, Zhi Zhu, and Weihong TanJ. Am. Chem. Soc., 2008, 130 (26), 8351-8358 • DOI: 10.1021/ja800604z • Publication Date (Web): 05 June 2008Downloaded from on February 8, 2009More About This ArticleAdditional resources and features associated with this article are available within the HTML version:•Supporting Information•Links to the 3 articles that cite this article, as of the time of this article download•Access to high resolution figures•Links to articles and content related to this article•Copyright permission to reproduce figures and/or text from this articleCarbon Nanotube-Quenched Fluorescent Oligonucleotides:Probes that Fluoresce upon HybridizationRonghua Yang,*,†,‡Jianyu Jin,†Yan Chen,‡Na Shao,†Huaizhi Kang,‡Zeyu Xiao,‡Zhiwen Tang,‡Yanrong Wu,‡Zhi Zhu,‡and Weihong Tan*,‡Beijing National Laboratory for Molecular Sciences,College of Chemistry and MolecularEngineering,Peking Uni V ersity,Beijing100871,China,and Center for Research at theBio/Nano Interface,Department of Chemistry and Department of Physiology and Functional Genomics,Shands Cancer Center,UF Genetics Institute,McKnight Brain Institute,Uni V ersity of Florida,Gaines V ille,Florida32611-7200Received January24,2008;E-mail:yangrh@;tan@chem.ufl.eduAbstract:We report an effective,novel self-assembled single-wall carbon nanotube(SWNT)complex with an oligonucleotide and demonstrate its feasibility in recognizing and detecting specific DNA sequences in a single step in a homogeneous solution.The key component of this complex is the hairpin-structured fluorescent oligonucleotide that allows the SWNT to function as both a“nanoscaffold”for the oligonucleotide and a“nanoquencher”of thefluorophore.Given this functionality,this carbon nanotube complex represents a new class of universalfluorescence quenchers that are substantially different from organic quenchers and should therefore have many applications in molecular engineering and biosensor development. Competitive binding of a DNA target and SWNTs with the oligonucleotide results influorescence signal increments relative to thefluorescence without a target as well as in markedfluorescence quenching.In contrast to the common loop-and-stem configuration of molecular beacons(MBs),this novelfluorescent oligonucleotide needs only one labeledfluorophore,yet the emission can be measured with little or no background interference.This property greatly improves the signal-to-background ratio compared with those for conventional MBs,while the DNA-binding specificity is still maintained by the MB.To test the interaction mechanisms of thefluorescent oligonucleotide with SWNTs and target DNA,thermodynamic analysis and fluorescence anisotropy measurements,respectively,were applied.Our results show that MB/SWNT probes can be an excellent platform for nucleic acid studies and molecular sensing.IntroductionThe continuous development offluorogenic probes for molecular interaction studies and ultrasensitive bioanalysis is critically important to medical diagnosis,disease prevention, and drug discovery.This explains the attention given to such well-known DNA hybridization probes as Taqman,1protease probes,2and molecular beacons(MBs).3,4In general,an MB is a dual-labeled oligonucleotide probe with a hairpin-shaped structure in which the5′and3′ends are self-complementary, bringing afluorophore and a quencher into close proximity and resulting influorescence quenching of thefluorophore.3Binding of this probe to a complementary nucleic acid target creates a relatively rigid probe-target hybrid,causing disruption of the hairpin stem and thereby restoring thefluorescence of the fluorophore.The unique thermodynamics and specificity of MBs5–7in comparison with linear DNA probes have led to their widespread use in quantitative PCR,8–11protein-DNA interac-tion studies,12–14and visualization of RNA expression in living cells.15–18*Corresponding author.Phone:(352)846-2410(W.T.).†Peking University.‡University of Florida.(1)Holland,P.M.;Abramson,R.D.;Watson,R.;Gelfand,D.H.Proc.Natl.Acad.Sci.U.S.A.1991,88,7276–7280.(2)Matayoshi,E.D.;Wang,G.T.;Krafft,G.A.;Erickson,J.Science1990,247,954–958.(3)Tyagi,S.;Kramer,F.R.Nat.Biotechnol.1996,14,303–308.(4)(a)Yang,C.J.;Medley,C.D.;Tan,W.H.Curr.Pharm.Biotechnol.2005,6,445–452.(b)Marras,S.A.E.Methods Mol.Biol.2006,335, 3–16.(5)Bonnet,G.;Tyagi,S.;Libchaber,A.;Kramer,F.R.Proc.Natl.Acad.Sci.U.S.A.1999,96,6171–6176.(6)Tsourkas,A.;Behlke,M.A.;Rose,S.D.;Bao,G.Nucleic Acids Res.2003,31,1319–1330.(7)Bonnet,G.;Krichevsky,O.;Libchaber,A.Proc.Natl.Acad.Sci.U.S.A.1998,95,8602–8606.(8)Fang,Y.;Wu,W.-H.;Pepper,J.L.;Larsen,J.L.;Marras,S.A.E;Nelson,E.A.;Epperson,W.B.;Christopher-Hennings,J.J.Clin.Microbiol.2002,40,287–291.(9)Poddar,S.K.Mol.Cell.Probes2002,14,25–32.(10)Roy,S.;Kabir,M.;Mondal,D.;Ali,I.K.;Petri,W.A.,Jr.;Haque,R.J.Clin.Microbiol.2005,43,2168–2172.(11)Feldman,S.H.;Bowman,b Anim.(NY)2007,36(9),43–50.(12)Li,J.W.J.;Fang,X.H.;Schuster,S.M.;Tan,W.H.Angew.Chem.,Int.Ed.2000,39,1049–1052.(13)Li,J.W.J.;Fang,X.H.;Tan,mun.2002,292,31–40.(14)Orru,G.;Ferrando,M.L.;Meloni,M.;Liciardi,M.;Savini,G.;DeSantis,P.J.Virol.Methods2006,137,34–42.(15)Fang,X.H.;Mi,Y.M.;Li,J.W.J.;Beck,T.;Schuster,S.;Tan,W.H.Cell Biochem.Biophys.2002,37,71–81.(16)Bratu,D.P.;Cha,B.J.;Mhlanga,M.M.;Kramer,F.R.;Tyagi,S.Proc.Natl.Acad.Sci.U.S.A.2003,100,13308–13313.(17)Mhlanga,M.M.;Vargas,D.Y.;Fung,C.W.;Kramer,F.R.;Tyagi,S.Nucleic Acids Res.2005,33,1902–1912.Published on Web06/05/200810.1021/ja800604z CCC:$40.75 2008American Chemical Society J.AM.CHEM.SOC.2008,130,8351–835898351While MBs have been employed in a broad spectrum of applications,they have also demonstrated significantflaws.For instance,in principle,thefluorophore should be quenched completely by the quencher in the stem-closed form.In reality, however,the residualfluorescence usually varies,which greatly limits detection sensitivity.In addition,MBs are prone to false-positive signals as a result of endogenous nuclease degradation and nonspecific binding by DNA-or RNA-binding proteins. Finally,synthesizing an MB is a complicated task.Specifically, the quality of the synthesis and purification of the probe affect the increment offluorescence intensity upon hybridization for a given target.Efforts to solve these problems have included the following strategies:introducing novel signaling schemes,19–22 exploring nanocomposites,23–25synthesizing the probe molecules with nuclease-resistant backbones or locked nucleic-acid bases,26–29and making better quenchers using rational molecular design coupled with sophisticated synthesis.30–33In general, however,effective solutions to the problems enumerated above are limited,and this has driven the search for new methods and materials.These new types of analytical tools for life science and biotechnology have been created by combining the highly specific recognition ability of biomolecules with the unique structural character of inorganic nanomaterials such as nanoc-rystals,nanotubes,and nanowires.34,35In particulary,carbon nanotubes are molecular wires that have become the leading building blocks for nanomaterials and have shown great potential in electronics,optics,mechanics,and biosensing.36–39The interactions of single-wall carbon nanotubes(SWNTs)with biological molecules have been intensively studied in recent years.SWNTs that are covalently or noncovalently attached by nucleic acids40–42or proteins44–46have been shown to be effective for interaction studies40separation of nanotubes,41and in applications as biosensors42–44and drug transporters.45 Single-stranded DNA(ssDNA)has recently been demon-strated to interact noncovalently with SWNTs.40,41The ssDNA molecules form stable complexes with individual SWNTs, wrapping around them by means ofπ-stacking interactions between the nucleotide bases and the SWNT sidewalls.Double-stranded DNA(dsDNA)has also been proposed to interact with SWNTs,47but its affinity is significantly weaker than that of ssDNA.This difference in the binding interactions of carbon nanotubes with ssDNA and dsDNA has provided the basis for their use in molecular recognition and detection of DNA.48–55 Most of these applications have been prompted by changes in electrochemical properties common to SWNTs,48–53but a few are based on absorption and near-infraredfluorescence of the carbon nanotubes.54,55Recently,and more relevant to the purpose of this study, scattered examples of noncovalent interactions between SWNTs and organicfluorophores orfluorophore-labeled biomolecules have been reported.38,56,57Photophysical studies have found that SWNTs can act collectively as quenchers for thefluorophores.57(18)Santangelo,P.;Nitin,N.;Laconte,L.;Woolums,A.;Bao,G.J.Virol.2006,80,682–688.(19)Chen,L.H.;McBranch,D.W.;Wang,H.L.;Helgeson,R.;Wudl,F.;Whitten,D.G.Proc.Natl.Acad.Sci.U.S.A.1999,96,12287–12292.(20)Tyagi,S.;Marras,S.A.E.;Kramer,F.R.Nat.Biotechnol.2000,18,1191–1196.(21)Du,H.;Disney,M.D.;Miller,B.L.;Krauss,T.D.J.Am.Chem.Soc.2003,125,4012–4013.(22)Stoermer,R.L.;Cederquist,K.B.;McFarland,S.K.;Sha,M.Y.;Penn,S.G.;Keating,C.D.J.Am.Chem.Soc.2006,128,16892–16930.(23)Dubertret,B.;Calame,M.;Libchaber,A.J.Nat.Biotechnol.2001,19,365–370.(24)Seferos,D.S.;Giljohann,D.A.;Hill,H.D.;Prigodich,A.E.;Mirkin,C.A.J.Am.Chem.Soc.2007,129,15477–15479.(25)Maxwell,D.J.;Taylor,J.R.;Nie,S.M.J.Am.Chem.Soc.2002,124,9606–9612.(26)Braasch,D.A.;Corey,D.R.Chem.Biol.2001,8,1–7.(27)Tsourkas,A.;Behlke,M.;Bao,G.Nucleic Acids Res.2002,30,5168–5174.(28)Kuhn,H.;Demidov,V.V.;Coull,J.M.;Fiandaca,M.J.;Gildea,B.D.;Frank-Kamenetskii,M.D.J.Am.Chem.Soc.2002,124,1097–1103.(29)Wang,L.;Yang,C.J.;Medley,C.D.;Benner,S.A.;Tan,W.H.J.Am.Chem.Soc.2005,127,15664–15665.(30)Xia,W.;Whitten,D.;McBranch,D.U.S.Patent2005030579,2005.(31)Cook,R.M.;Lyttle,M.;Dick,D.U.S.Patent2001-US15082,2001.(32)May,J.P.;Brown,L.J.;Rudloff,I.;Brown,mun.2003,8,970–971.(33)Yang,C.J.;Lin,H.;Tan,W.H.J.Am.Chem.Soc.2005,127,12772–12773.(34)LaVan,D.A.;Lynn,D.M.;Langer,R.Nat.Re V.Drug Disco V ery2002,1,77–84.(35)Niemeyer,C.M.Angew.Chem,Int.Ed.2001,40,4128–4158.(36)Dresselhaus,M.S.;Dresselhaus,G.;Eklund,P. C.Science ofFullerenes and Carbon Nanotubes;Academic Press:San Diego,1996;pp1-985.(37)Tasis,D.;Tagmatarchis,N.;Bianco,A.;Prato,M.Chem.Re V.2006,106,1105–1136.(38)Britz,D.A.;Khlobystov,A.N.Chem.Soc.Re V.2006,35,637–659.(39)Valca´rcel,M.;Ca´rdenas,S.;Simonet,B.M.Anal.Chem.2007,79,4788–4797.(40)Zhang,M.;Jagota,A.;Semke,E.D.;Bruce,A.;Diner,B.A.;Mclean,R.S.;Lustig,S.R.;Richardson,R.E.;Tassi,N.G.Nat.Mater.2003, 2,338–342.(41)Wang,S.;Humphreys,E.S.;Chung,S.-Y.;Delduco,D.F.;Lustig,S.R.;Wang,H.;Parker,K.N.;Rizzo,N.W.;Subramoney,S.;Chiang, Y.-M.;Jagota,A.Nat.Mater.2003,2,196–199.(42)Tang,X.W.;Bansaruntip,S.;Nakayama,N.;Yenilmez,E.;Chang,Y.I.;Wang,Q.Nano Lett.2006,6,1632–1636.(43)Chen,R.J.;Bangsaruntip,S.;Drouvalakis,K.A.;Kam,N.W.S.;Shim,M.;Li,M.Y.;Kim,W.;Utz,P.J.;Dai,H.J.Proc.Natl.Acad.Sci.U.S.A.2003,100,4984–4989.(44)So,H.M.;Won,K.;Kim,Y.H.;Kim,B.K.;Ryu,B.H.;Na,P.S.;Kim,H.;Lee,J.O.J.Am.Chem.Soc.2005,127,11906–11907.(45)Shim,M.;Shi Kam,N.W.;Dai,H.J.J.Am.Chem.Soc.2005,127,6021–6026.(46)Pantarotto,D.;Partidos,C.D.;Hoebeke,J.;Brown,F.;Kramer,E.;Briand,J.P.;Muller,S.;Prato,M.;Bianco,A.Chem.Biol.2003,10, 961–966.(47)Franchini,M.;Veneri,D.Ann.Hematol.2005,84,347–352.(48)Li,J.;Ng,H.T.;Cassell,A.;Fan,W.;Chen,H.;Ye,Q.;Koehne,J.;Han,J.;Meyyappan,M.Nano Lett.2003,3,597–602.(49)Davis,J.J.;Coleman,K.S.;Azamian,B.R.;Bagshaw,C.B.;Green,M.L.H.Chem.s Eur.J.2003,9,3732–3739.(50)Wang,J.;Liu,G.;Jan,M.R.J.Am.Chem.Soc.2004,126,3010–3011.(51)So,H.M.;Won,K.;Kim,Y.H.;Kim,B.K.;Ryu,B.H.;Na,P.S.;Kim,H.;Lee,J.O.J.Am.Chem.Soc.2005,127,11906–11907.(52)Staii,C.,Jr.Nano Lett.2005,5,1774–1778.(53)Hahm,J.;Lieber,C.Nano Lett.2004,4,51–54.(54)Star,A.;Tu,E.;Niemann,J.;Gabriel,J.P.;Joiner,C.S.;Valcke,C.Proc.Natl.Acad.Sci.U.S.A.2006,104,921–926.(55)Jeng,E.S.;Moll,A.E.;Roy,A.C.;Gastala,J.B.;Strano,M.S.Nano Lett.2006,6,371–375.(56)(a)Li,H.P.;Zhou,B.;Lin,Y.;Gu,L.R.;Wang,W.;Fernando,K.A.S.;Kumar,S.;Allard,L.;Sun,Y.P.J.Am.Chem.Soc.2004, 126,1014–1015.(b)Nakayama-Ratchford,N.;Bangsaruntip,S.;Sun, X.M.;Welsher,K.;Di,H.J.J.Am.Chem.Soc.2007,129,2448–2449.(c)Boul,P.J.;Cho,D.G.;Rahman,G.M.A.;Marquez,M.;Ou,P.Z.;Kadish,K.M.;Guldi,D.M.;Jonathan,L.;Sessler,J.L.J.Am.Chem.Soc.2007,129,5683–5687.(57)(a)Lu,Q.;Freedman,K.O.;Rao,R.;Lee,J.;Larcom,L.L.;Rao,A.M.;Ke,P.C.J.Appl.Phys.2004,96,6772–6775.(b)Jeng,E.S.;Moll,A.E.;Roy,A.C.;Gastala,J.B.;Strano,M.S.Nano Lett.2006, 6,371–375.(c)Kim,N.W.S.;O′Connell,M.;Wisdom,J.A.;Dai,H.J.Proc.Natl.Acad.Sci.U.S.A.2005,102,11600–11605.(e)Lin,S.J.;Keskar,G.;Wu,Y.N.;Wang,X.;Mount,A.S.;Klaine,S.J.;Moore,J.M.;Rao,A.M.;Ke,P.C.Appl.Phys.Lett.2006,89, 143118.8352J.AM.CHEM.SOC.9VOL.130,NO.26,2008A R T I C L E S Yang et al.Both energy-transfer and electron-transfer processes are con-sidered to be major deactivation pathways for excitedfluoro-phores on nanotube surfaces.While these results provide strong evidence that such quenching approaches might provide a basis forfluorescence sensing,we are unaware of any studies which have examined SWNTs from the perspective offluorescence restoration.37,39In this work,therefore,we explored the use of a self-assembled quenched complex offluorescent ssDNA and SWNTs as an efficient MB that canfluorescently detect single-nucleotide variations in DNA in homogeneous solution.The key features of this design are as follows.First,as noted above, ssDNA molecules wrap around individual SWNTs by means ofπ-stacking interactions between the nucleotide bases and the SWNT sidewalls.Next,because the SWNTs act as both a “nanoscaffold”for the ssDNA and a“nanoquencher”of the fluorophore,only one end of the ssDNA must be labeled with afluorophore.Under these conditions,the ssDNA molecules self-organize on the surface of the carbon nanotubes,completely quenching thefluorophore.Finally,in the presence of a target, competitive binding of the target and the carbon nanotubes with the ssDNA suppresses thefluorescence quenching,allowing fluorescence-signal enhancement that is large relative to that without a target.This combination of properties results in fluorescence enhancement that is sensitive and specific to the perfectly complementary ssDNA.Furthermore,our novel design, which is based on a simple,cost-effective synthesis,was shown to have a large signal-to-background ratio,high thermostability, and exceptional DNA-binding selectivity.Therefore,from the standpoints of design and engineering,production,and overall function,self-assembled ssDNA-SWNT complexes such as the one studied here can easily replace conventional MBs. Experimental SectionGeneral Procedures.All of the DNA synthesis reagents were purchased from Glen Research.All of the DNA sequences were synthesized using an ABI3400DNA/RNA synthesizer.Fluorescein CPG was used for the synthesis offluorescent oligonucleotides. Fluorescence measurements were performed using a Hitachi F-4500fluorescence spectrofluorometer.Fluorescence anisotropy measure-ments were conducted using a Fluorolog-3model FL3-22spec-trofluorometer(HORIBA Jobin Yvon,Edison,NJ)with a200µL quartz cuvette.Transmission electron microscopy(TEM)was performed using a transmission microscope(Hitachi H-700). Samples for TEM analysis were prepared by pipetting5-25µL of the colloidal solutions onto standard holey carbon-coated copper grids.The grids were dried in air for>12h before they were loaded into the vacuum chamber of the electron microscope.The TEM samples were not subjected to heavy-metal staining or other treatments.Choice of Probe and Target DNA.In this work,a hairpin-structured(HP)oligonucleotide containing a19-base loop and a 6-mer stem was chosen as the recognition element(Table1).The MB1was designed by attachingfluorescein(FAM)and4-(4′-(dimethylamino)phenylazo)benzoic acid(Dabcyl)58to the3′and 5′ends,respectively,of the ssDNA strand.To examine the effect of SWNTs on thefluorescence quenching,the ssDNA was labeled only with FAM at the3′end in the HP probe2.The target ssDNA molecules4and5were19bases long;4was perfectly comple-mentary(pc)to the bases in the loop,while5contained a single-base mismatch(sm)with the loop.Probe3,a linear(LN)oligonucleotide labeled with FAM at the 3′end,was also designed in order to examine the effect of the hairpin structure onfluorescence quenching and target-binding selectivity.As shown in Table1,this oligonucleotide was31bases long,and the19bases in the middle of the strand were identical to the19bases in the loop of the HP probes.However,it did not have the complementary stem-forming bases on either end and thus could not form a hairpin structure.Fluorescence-Quenching and Hybridization Assays.The working solution containing thefluorescent oligonucleotide was obtained by dilution of the stock solution to a concentration of50 nM using phosphate-buffered saline(137mM NaCl,2.5mM Mg2+, 10mM Na2HPO4,and2.0mM KH2PO4,pH7.4).The as-grown SWNTs,purchased from Carbon Nanotechnologies,Inc.,were sonicated in DMF for5h to give a homogeneous black solution. An aliquot of the SWNT suspension[<3%(v/v)]was added to a phosphate buffer containing thefluorescent oligonucleotide and allowed to incubate for5-10min.A6-fold molar excess of complementary target4was then added to the nanotube-conjugate mixture.After this mixture was allowed to hybridize for∼3h at room temperature,the upper70%of the clear solution was received. The pellet,which contained impurities,aggregates,and undispersed SWNTs,was removed by ultracentrifugation,and the supernatant was collected.The control solution without target was obtained by addition of the same volume of water to the nanotube complex solution.The solubilized SWNTs by the ssDNA strands were mostly individual tubes and small bundles as revealed by transmission electron microscopy.59In order to compare the molecular recogni-tion ability of the nanotube-quenched complex with that of the conventional MB,similar titrations were done with the MB which had Dabcyl as the quencher.Kinetics and Thermal Profiles.To study the kinetics and time dependence of thefluorescence quenching of thefluorescent oligonucleotides by the carbon nanotubes,fluorescence spectra of solutions containing2and SWNTs in the absence or presence of4 were acquired at time intervals of20min,and their peak intensities at520nm were plotted as a function of time.For thermodynamic and temperature-dependent studies,thefluorescence of solutions containing2and SWNTs in the presence or absence of4was measured as a function of temperature.Results and DiscussionFluorescence Quenching and Hybridization Assay.Earlier studies have shown that afluorophore bound to the surface of carbon nanotubes is in fact quenched by them.38,56Therefore, when afluorophore is covalently linked to a biomolecule,the strong binding affinity of the biomolecule for carbon nanotubes is expected to offer a better means of producing highly efficient quenching of thefluorophore.57To confirm thesefindings to our satisfaction,we tested three different nucleic-acid detection methods,based on(i)the conventional MB1,(ii)the self-assembled carbon-nanotube complex of2(2-SWNT),and(iii) the self-assembled carbon-nanotube complex of3(3-SWNT). We obtained enhancements of thefluorescence emission of1-3 generated by the target DNA in the absence and the presence of SWNTs and evaluated the results in terms of the signal-to-(58)Marras,S.A.E.;Kramer,F.R.;Tyagi,S.Nucleic Acids Res.2002,30,e122.(59)See the Supporting Information.Table1.Designs of Probes and Target Oligonucleotidestype sequenceFAM-labeled MB(1)a5′-Dabcyl-CCTAGCTCTAAATCACTATGGTCGCGCTAGG-FAM-3′FAM-labeled HP(2)b5′-CCTAGCTCTAAATCACTATGGTCGCGCTAGG-FAM-3′FAM-labeled LN(3)c5′-CCTAGCTCTAAATCACTATGGTCGCCGATCC-FAM-3′pc-ssDNA(4)d5′-GCGACCATAGTGATTTAGA-3′sm-ssDNA(5)e5′-GCGACCATA C TGATTTAGA-3′a Molecular beacon.b Hairpin-structured probe.c Linear probe.d Per-fectly complementary target.e Single-base-mismatched target.J.AM.CHEM.SOC.9VOL.130,NO.26,20088353 Carbon Nanotube-Quenched Fluorescent Oligonucleotides A R T I C L E Sbackground ratio (S/B),defined as S/B )(F hybrid -F buffer )/(F probe -F buffer ),where F probe ,F buffer ,and F hybrid are the fluorescence intensities of the probe without target,the plain buffer solution,and the probe -target hybrid,respectively.In the absence of a target,the background fluorescence signals of 1-3in the phosphate buffer were first studied (Figure 1A).As expected,the background fluorescence observed from 1was weakest as a result of the formation of hairpin structure,which brings the fluorophore and the quencher into close proximity.For the other fluorescent oligonucleotides,the background fluorescence from 2was weaker than that from the ssDNA 3,perhaps as a result of quenching of the FAM fluorescence by the nearby guanine bases in 2.60,61The dotted lines in Figure 1A show the fluorescence emission spectra of 1-3in the presence of SWNTs.Upon excitation at the maximal absorption wavelength of FAM,all of the self-assembled nanotube complexes exhibited decreases in fluorescence intensity relative to that observed for the free fluorescent oligonucleotides under the same conditions.Interestingly,we noted that further fluorescence quenching by the SWNTs was observed even for the MB 1,indicating that the FAM fluorescence in the hairpin structure was not completely quenched by Dabcyl.In a recent study of noncovalent interactions of SWNTs with fluorescein derivatives,56b 67%quenching by SWNTs was observed.However,in our experiment,more than 98%quenching was observed for concentrations of 2ranging from 50to 200nM.The phenomena observed here provide evidence for tight binding of ssDNA on SWNTs.Specifically,the present nanotube-quenching approaches were found to be highly efficient in probing biomolecular interactions.Figure 1B shows the fluorescence emission spectra of free 1-3and their self-assembled SWNT complexes in the presence of the pc-ssDNA target petitive hybridization of 4and SWNTs with the fluorescent oligonucleotide suppresses fluo-rescence quenching of FAM,whose fluorescence was enhanced in comparison with that in the absence of target.There was a rather large variation in S/B in these assays because of the different background signals of the probes.The experimental results are summarized in Figure 2.In the absence of carbon nanotubes,the fluorescence intensity of 1was increased by addition of 4,but for the other fluorescent oligonucleotides,such enhancements of fluorescence intensity were not obvious.The S/Bs generated by the 6-fold excess of 4were 5.6,1.4,and 1.1for 1,2,and 3,respectively.The stronger background fluores-cences from 2and 3led to smaller S/Bs compared with the results of the MB assay.In contrast,the presence of SWNTs greatly reduced the background signals for all of the fluorescent oligonucleotides and thus led to large S/Bs.For example,the S/Bs for 1-3generated by the 6-fold excess of 4in the presence of SWNTs were 13.7,15.4,and 16.2,respectively,which is a significant improvement compared to the S/Bs in the absence of SWNTs.This comparison clearly demonstrates that the carbon nanotubes greatly improved the S/Bs and,consequently,the analytical sensitivities of the fluorogenic molecular probes.Figure 3shows the typical fluorescence emission response of 2-SWNT to increasing concentrations of 4.A dramatic increase in the FAM fluorescence intensity was observed as the DNA concentration increased from 15.0to 750nM.The detection limit (taken to be 3times the standard deviation in the blank solution)was 4.0nM,which is 8-fold lower than that of 1.Moreover,we observed that reducing the concentration of the DNA probe resulted in a lower detection limit.These results(60)Kurata,S.;Kanagawa,T.;Yamada,K.;Torimura,M.;Yokomaku,T.;Kamagata,Y.;Kurane,R.Nucleic Acids Res.2001,29,e34.(61)Dohno,C.;Saito,I.ChemBioChem 2005,6,1075–1081.Figure 1.Changes in the fluorescence emissions of 1-3in the phosphatebuffer caused by carbon nanotubes and/or the pc-ssDNA target 4.(A)Fluorescence emission spectra of solutions of 1,2,and 3in the absence (solid lines)and presence (dotted lines)of SWNTs.(B)Fluorescence emission spectra of solutions 1,2,and 3containing a 6-fold excess of 4in the absence (solid lines)and the presence (dotted lines)of SWNTs.The concentrations of 1-3were 50nM,and the excitation wavelength was 480nm.Figure parisons of the signal-to-background ratio (S/B)of thefluorescent oligonucleotides generated by a 6-fold excess of the pc-ssDNA target 4in the absence (gray bars)and presence (black bars)of SWNTs.The concentrations of 1-3were 50nM,and the excitation and emission wavelengths were 480and 520nm,respectively.Figure 3.Fluorescence emission spectra of 2-SWNT (50nM,λex )480nm)in the presence of different concentrations of 4.Inset:the fluorescence intensity ratio F /F 0(where F 0and F are the fluorescence intensities of 2-SWNT in the absence and presence,respectively,of 4)plotted against the logarithm of the concentration of 4.8354J.AM.CHEM.SOC.9VOL.130,NO.26,2008A R T I C L E S Yang et al.suggest that the proposed approach is potentially appropriate for quantification of nucleic acid content in physiological fields.Several reported MB sequences were synthesized without quencher.This significantly improved the S/B compared to values reported for the regular MBs,demonstrating that the present approach provides a universal fluorescent probe for bioanalysis.The quenching efficiencies of self-assembled nanotube complexes and gold nanoparticles were also compared.Because of their exceptional quenching capabilities,gold nanoparticles have been successfully used to construct fluorescent probes.23–25In the classic work of Dubertret’s group,for example,single-base-mismatch detection and efficient quenching (up to 99.96%under favorable conditions)were achieved by replacement of Dabcyl with 1.4-nm gold clusters (nanogold)in the MB.23However,their nanogold clusters are too small to develop surface plasmon resonances,and the gold -DNA linkage is unstable under the temperature cycling conditions of PCR.Moreover,the tedious processes involved in preparation of the nanoparticles and covalent labeling of the DNA with the nanoparticles hinder the application of gold clusters as a common approach for bioanalysis.While the present self-assembled SWNT complex has high quenching efficiency and single-base-mismatch detection ability equal to gold nanoparticles (see below),our design offers additional advantages,including simplicity of preparation and manipulation as well as greater stability.DNA Detection Specificity.A significant advantage of MBs stems from the high degree of specificity with which they can recognize target sequences.3,23Notwithstanding this performance,the self-assembled nanotube complex shows the same ability to discriminate between the perfect target and the mismatched one,thus outperforming MBs.This assess-ment is based on the basic competition between unimolecular hairpin formation and bimolecular probe -target hybridiza-tion.Our results showed that addition of a low concentration of a noncomplementary DNA had little effect on the fluorescence of either 1or 2-SWNT,confirming the high specificity of the hairpin structure.However,a high concen-tration of the noncomplementary DNA results in a large background signal for 2-SWNT due to competitive binding of the DNA and 2with the carbon nanotubes.The pc-ssDNA target 4and the sm-ssDNA target 5were then used to compare the DNA detection specificities of 1and 2-SWNT.Figure 4displays fluorescence emission spectra of 1(50nm)in the presence of 4or 5(100nm).Both targets increased the fluorescence emission of 1,and the fluorescence enhance-ment by the sm target 5was 82%of that by the pc target 4.For 2-SWNT (Figure 4inset),the enhancement by 5was only 64%of that by 4.These results reveal that the ability of 2-SWNT to detect a single-base mismatch is slightly greater than that of 1.To illustrate the DNA binding specificity more clearly,we introduced a selectivity coefficient,R ,defined as R )(S/B)i ·j /(S/B)i ·j ′,where (S/B)i ·j is the S/B value for the DNA probe i in the presence of DNA target j and (S/B)i ·j ′is that for the same DNA probe in the presence of target j ′.The selectivity of each probe for the pc-DNA target 4was used as the standard (R )1).A selectivity coefficient of 0.764of 1for 5over 4was obtained,while the analogous selectivity coefficient of 2-SWNT for 5over 4was R )0.472.These selectivity coefficients show that the sm-recognition ability of a hairpin-DNA probe can be improved using carbon nanotubes.To further characterize the binding specificity of 2-SWNT for 4,the competitive complex was also analyzed in the presence of biologically related substrates.The addition of 4to a mixture containing 2-SWNT and DNA (100nM),protein (bovine serum albumin,1.0µg/mL),and amino acids [histidine,cysteine,glutamic acid,and aspartic acid (each 10µM)]gave fluorescence response curves almost superim-posable on the one obtained exclusively in presence of 4,59although the background signal displayed a small increase in the mixture.These results clearly indicate that 2-SWNT is not sensitive to other targets.The probe containing the linear DNA strand further illustrates the importance of the relationship between carbon nanotubes and selectivity.The selectivity coefficient of 3-SWNT for 5over 4was 0.833,which is slightly smaller than that of MBs;however,it is higher than the coefficient of linear DNA probes that cannot discriminate sm targets.The contrasting results clearly demonstrate that the carbon nanotubes are promising building blocks for DNA binding specificity.To account for this outcome,we reasoned that the oligonucleotide is initially bound to the nanotube and that the target DNA must then compete with the nanotube for the bound oligonucleotide.Under these conditions,only the perfectly complementary DNA,rather than the mismatched DNA,could displace the nanotube from the assembled complex and form the DNA -DNA hybridization product.Kinetics and Thermodynamics.The kinetic and thermody-namic properties of carbon-nanotube binding and subsequent DNA hybridization of the fluorescent oligonucleotides are fundamentally different from those of conventional MBs.Adsorption of ssDNA on the carbon nanotube surface is slow at room temperature.Figure 5shows fluorescence quenching of 2by SWNTs in the phosphate buffer as a function of time.The curve exhibits a rapid reduction of fluorescence intensity in the first hour followed by a slower decrease over the next 2-3h.We believe that the surface effect of the carbon nanotubes and the charge properties of the ssDNA may be the main contributors to the small adsorption rate.In the presence of 4,competitive binding of 4and SWNTs with 2reduces adsorption of 2on the nanotube surface,which hinders fluorescence quenching.However,DNA hybridization in the presence of SWNTs is also slower than free DNA hybridization without carbon nanotubes at room temperature.The best S/B was obtained at 3h,when the DNA -SWNT complexes had reacted with their target DNA (Figure 4inset).Figure 4.Fluorescence spectra in the presence of the pc-ssDNA target 4(red curves),the sm-ssDNA target 5(green curves),and no target (black curves),demonstrating the abilities of 1and 2-SWNT (inset)to distinguish perfectly complementary and single-base-mismatched DNA targets.The concentrations of 1and 2were 50nM,and the target concentrations were 100nM.The excitation wavelength was 480nm.J.AM.CHEM.SOC.9VOL.130,NO.26,20088355Carbon Nanotube-Quenched Fluorescent Oligonucleotides A R T I C L E S。
MolecularThermodynamicsPDF:分子热力学的PDF
Molecular ThermodynamicsBy John SimonMolecular Thermodynamics Details:Molecular Thermodynamics: Donald A. McQuarrie, John D. Simon ...Evolved from McQuarrie and Simon's best-selling textbook, Physical Chemistry: A Molecular Approach, this text focuses in on the thermodynamics portion of the course. Thermodynamics - Wikipedia, the free encyclopediaThermodynamics is a branch of natural science concerned with heat and its relation to energy and work. It defines macroscopic variables (such as temperature, internal energy, entropy, and pressure) that characterize materials and radiation, and explains how they are related and by what laws they ...Molecular Thermodynamics - Johns Hopkins UniversityMolecular Thermodynamics. The explosion in structural data on bio-molecules provides new opportunities to understand their function in terms of their structure. Thermochemistry - Wikipedia, the free encyclopediaThermochemistry is the study of the energy and heat associated with chemical reactions and/or physical transformations. A reaction may release or absorb energy, and a phase change may do the same, such as in melting and boiling. Thermochemistry focuses on these energy changes, particularly on ...Molecular Thermodynamics, Donald A. McQuarrie and John D. SimonMolecular Thermodynamics, by Donald McQuarrie and John Simon, published in 1999 by University Science Books.Statistical Molecular Thermodynamics | CourseraStatistical Molecular Thermodynamics is a free online class taught by Dr. Christopher J. Cramer of University of MinnesotaMolecular Thermodynamics - Donald Allan McQuarrie, John ...Evolved from McQuarrie and Simon's best-selling Physical Chemistry: A Molecular Approach, this text follows a similar path by first covering the principles of quantum mechanics before engaging those ideas in the subsequent development of thermodynamics. Although many of the chapters are similar ...Introduction to Molecular ThermodynamicsIntroduction to Molecular Thermodynamics. by Robert M. Hanson and Susan Green, St. OlafCollege.enquiries:******************.Publisher'swebsiteforthisbookMolecular Thermodynamics (Physical chemistry monograph series ...Molecular Thermodynamics (Physical chemistry monograph series) [Richard E. Dickerson] on . *FREE* shipping on qualifying offers.Molecular Thermodynamics — ITQB - Universidade Nova de LisboaMolecular Thermodynamics of Liquids and Liquid Solutions, in particular, studies of Ionic Liquids and ionic liquid-containing systems constitute the main activity.Molecular thermodynamics of fluid-phase equilibria - J. M ...Molecular Thermodynamics of Fluid-Phase Equilibria, Third Edition is a systematic, practical guide to interpreting, correlating, and predicting thermodynamic properties used in mixture-related phase-equilibrium calculations. Completely updated, this edition reflects the growing maturity of ...Molecular thermodynamics - definition of Molecular ...ther·mo·chem·is·try (thûr m-k m-str) n. The chemistry of heat and heat-associated chemical phenomena. ther mo·chem i·cal (--k l) adj. ther mo·chem ist n.Prausnitz Group Home Page - University of California, BerkeleyMolecular Thermodynamics John M. Prausnitz. Professor, University of California, Berkeley Faculty Senior Scientist, Lawrence Berkeley National LaboratorymThermoWait for more... ... The website is going through major upgrade ,, wait for the new look soon :)Molecular thermodynamics - HmolpediaAn encyclopedia of topics on the thermodynamics, chemistry, and physics of human existence.Molecular Thermodynamics of Fluid-Phase Equilibria / Edition ...The classic guide to mixtures, completely updated with new models, theories, examples, and data. Efficient separation operations and many other chemical processes depend upon a thorough understanding of the properties of gaseous and liquid mixtures. Molecular Thermodynamics of Fluid-Phase ...Molecular Thermodynamics of Fluid-Phase EquilibriaThermodynamics Home - Chemical Engineering - Thermodynamics: Molecular Thermodynamics of Fluid-Phase Equilibria by Rudiger N. Lichtenthaler, Edmundo Gomes De Azevedo, John M. Prausnitz, Edmundo G. De AzevedoMolecular thermodynamics definition of Molecular ...thermochemistry [¦th?r·m??kem·?·str?] (physical chemistry) The measurement, interpretation, and analysis of heat changes accompanying chemical reactions and changes in state.Molecular Thermodynamics by Donald A. McQuarrie — Reviews ...Molecular Thermodynamics has 7 ratings and 1 review. Jacob said: This books is incredible. It's extremely comprehensive. If you love physical chemistry a...Introduction to Molecular Thermodynamics, by Robert M. Hanson ...Introduction to Molecular Thermodynamics, by Robert M. Hanson and Susan Green , University Science Books, copyright 2008Molecular Thermodynamics of Fluid Phase Equilibria - 3rd Edition2Molecular Thermodynamics of Fluid Phase Equilibria - 3rd Edition2 - Free ebook download as PDF File (.pdf), Text file (.txt) or read book online for free.Molecular thermodynamics (Book, 1999) []Get this from a library! Molecular thermodynamics. [Donald A McQuarrie; John D Simon]Molecular Thermodynamics - Download for freeMolecular Thermodynamics download from FileSnail - 3188189138905X pdf, Thermodynamics Processes an rar, FilePost DepositFiles and RapidShare files. Molecular Thermodynamics of Fluid Phase Equilibria (Prausnitz ...Molecular Thermodynamics of Fluid Phase Equilibria (Prausnitz- 2th Edition ) - Free ebook download as Text file (.txt), PDF File (.pdf) or read book online for free. k Molecular thermodynamics (Open Library)Molecular thermodynamics by Richard Earl Dickerson, 1969,W. A. Benjamin edition, in EnglishMolecular thermodynamics - definition of Molecular ...Molecular thermodynamics. Molecular Time Scale Generalized Langevin Equation Molecular Typing by Reverse Dot-Blotting Molecular Typing Working Group Molecular Unit Cell Approximation molecular velocity Molecular vibration Molecular Vibrational SpectrometerCenter for Molecular & Engineering ThermodynamicsThe University of Delaware’s Thomas H. Epps, III, is one of 30 early-career engineers nationwide invited to attend the 2013 European Union-United States Frontiers of Engineering Symposium to be held Nov. 21-23 in Chantilly, France.ChemE | Thermodynamics and Molecular ComputationsThermodynamics and Molecular Computations. Thermodynamics governs processes as diverse as chemical production, bioreaction, creation of advanced materials, protein separation, and environmental treatment.Molecular Thermodynamics Mcquarrie : ?g Rt K Q. Molecular ...pdf document tagged with molecular thermodynamics mcquarrie : ?G RT K Q. user guide pdf categorized in molecular thermodynamics mcquarrieMolecular Thermodynamics of Fluid-Phase Equilibria by John M ...Molecular Thermodynamics of Fluid-Phase Equilibria has 7 ratings and 1 review. Theclassic guide to mixtures, completely updated with new models, theorie...。
鱼类免疫球蛋白重链基因与基因座的研究进展
第34卷第10期2010年10月水 产 学 报J OURNA L O F F IS HER IES OF C H I NAV o.l 34,N o .10O ct .,2010文章编号:1000-0615(2010)10-1617-12DO I :10.3724/SP .J .1231.2010.07021收稿日期:20100702 修回日期:20100810资助项目:国家重点基础研究发展计划资助(2009CB118703)通讯作者:聂 品,E-m ai:l pi nn ie @i hb .ac .cn#综述#鱼类免疫球蛋白重链基因与基因座的研究进展肖凡书, 聂 品*(中国科学院水生生物研究所,淡水生态与生物技术国家重点实验室,湖北武汉 430072)摘要:归纳了脊椎动物中报道的所有的免疫球蛋白(i m m unog l o buli n ,I g)的种类,重点阐述了鱼类免疫球蛋白重链(heavy chain ,H )基因及其基因座的研究进展。
硬骨鱼类中目前已发现有I g M 、Ig D 、I gZ /I gT 以及一个嵌合体I g M-I gZ ,软骨鱼类中目前只报道了3种免疫球蛋白基因,即I g M 、Ig NAR 和I g W 。
已报道的硬骨鱼类I g H 基因座并非都是以传统的/易位子0排列方式进行排列,一般以(V H )n-(D )n-(J H )n-(C F )-(D)n-(J H )n-(C L )-(C D )的形式排列,不同硬骨鱼类的I g H 基因座的结构特点、基因座中重链基因的数目以及基因座的拷贝数都存在一定差异。
软骨鱼类中I g H 基因座则是以/多簇0形式排列,即V H -D -D -J H -C H 区段或V H -D-D -D-J H -C H 区段在基因组中作为统一体多次复制。
在不同种类的硬骨鱼类中,I g 表达器官或组织方面的研究结果并不完全相同,但一般在免疫器官如胸腺、头肾和脾脏中均有表达。
- 1、下载文档前请自行甄别文档内容的完整性,平台不提供额外的编辑、内容补充、找答案等附加服务。
- 2、"仅部分预览"的文档,不可在线预览部分如存在完整性等问题,可反馈申请退款(可完整预览的文档不适用该条件!)。
- 3、如文档侵犯您的权益,请联系客服反馈,我们会尽快为您处理(人工客服工作时间:9:00-18:30)。
0023-1584/01/4204-$25.00 © 2001 MAIK “Nauka/Interperiodica”0561 Kinetics and Catalysis, Vol. 42, No. 4, 2001, pp. 561–573. Translated from Kinetika i Kataliz, Vol. 42, No. 4, 2001, pp. 618–631.Original Russian Text Copyright © 2001 by Bychkov, Korchak, Krylov, Morozova, Khomenko.INTRODUCTIONMany papers have been published that are devoted to carbon dioxide reforming of methane. Their number is still growing. However, in many cases, researchers are interested in autothermal reforming CH 4 + CO 2 +O 2 rather than in the CO 2 and CH 4 reaction itself. The former reaction leads to syngas with a CO : H 2 ratio close to 1 : 1 without substantial heat evolution or con-sumption. The main difficulty in the simultaneous occurrence of reactions between CO 2 and CH 4 and between CH 4 and O 2 is that one reaction requires a 100 − 200 ° C higher temperature than the other (on the same catalyst). Therefore, it is necessary to increase the catalyst activity toward carbon dioxide reforming of methane as much as possible:(I)Resistance to coking is less important, because the presence of O 2 reduces coke formation.In a search for the catalyst with the maximal activity toward reaction (I), we studied a number of nickel cat-alysts supported on MgO and containing transition metal oxides ( Cr 2 O 3 , CeO 2 , MnO 2 , and CuO) [1]. The Ni/MgO catalyst modified by Cr 2 O 3 , the Ni/MgO cata-lyst containing large amounts of Ni, and the NiO +MgO system prepared by the method of mechanochem-ical activation were the most active. The additives of CeO 2 and CuO to the Ni–Cr–O x /MgO and Ni/MgO cat-alysts did not lead to an increase in the activity. The MnO 2 additive even led to a decrease in the activity.The oxidation of carbon on the catalyst surface after the reaction was accompanied by the reoxidation of Ni to NiO in Ni/MgO and the transformation of Ni and Cr 2 O 3 into NiCrO 4 in Ni–Cr–O x / M gO . In many papers devoted to the mechanism of reaction (I) (see review papers [2–4]), carbon is believed to be an intermediate species, which participates in different process, includ-ing redox ones. We may assume that the main reactionCH 4CO 2+2CO 2H 2.+= itself also occurs via a redox mechanism in which one reagent ( CH 4 ) is a reducing agent, and the other ( CO 2 )is an oxidant. This mechanism was assumed in different studies, specifically when transition metal oxides were applied as catalysts.In [5, 6], reaction (I) was studied on the Ni/La 2 O 3 catalyst. Lanthanum oxide possesses both basic and redox properties, therefore it was suggested that the rate-limiting step of the process is the reductive decom-position of basic lanthanum carbonate formed in the reaction with CO 2(II)A high catalytic activity was observed in the case of perovskites La 1 – x Sr x NiO 3 [7] and Ca 0.8 Sr 0.2 NiO 3 [8],which have both redox and basic properties. In our work [9] devoted to the study of metal-free Mn–Cr oxide catalysts, the reductive decomposition of carbon-ate in the rate-limiting step was assumed as well: (III)Ni and reoxidation Ni carbon dioxide reforming of methane over NiO–MgO [10].This paper reports the results of studies of the pos-sible redox transformations of active catalyst for car-bon dioxide reforming of methane on Ni/MgO and Ni–Cr–O x /MgO (and some others) under the condi-tions of their formation. The interaction with the reduc-ing agent ( H 2 ) and the oxidant ( O 2 ) can be considered as a model of complex reactions of the catalyst with CH 4 and CO 2 . The following methods were chosen for the study: temperature-programmed reduction (TPR)by hydrogen, temperature-programmed desorption (TPD) of O 2, local X-ray spectral analysis (LXSA), and scanning electron microscopy (SEM). We also present data obtained in the TPR study of Ni/MgO catalystsNi La 2O 2CO 3NiO CO La 2O 3.+++MnCO 3Cr 2O 3CMnCr 2O 42CO.+++ Formation of the Ni–CrO x /MgO and Ni/MgO Catalystsfor Carbon Dioxide Reforming of MethaneV. Yu. Bychkov, V. N. Korchak, O. V. Krylov, O. S. Morozova, and T. I. KhomenkoSemenov Institute of Chemical Physics, Russian Academy of Sciences, Moscow, 117977 RussiaReceived February 24, 2000Abstract —Temperature-programmed reduction by hydrogen, temperature-programmed desorption of O 2 ,local X-ray spectral analysis, and scanning electron microscopy are used to study redox processes occurring on the Ni– Cr 2 O3 /MgO and Ni/MgO catalysts for carbon dioxide reforming of methane. The reduction of Ni/MgO leads to the formation of nickel clusters distributed over the surface of MgO. During the reduction of NiO − Cr 2 O3 /MgO , chromates are transformed into chromites, and then nickel is formed by the reduction of spinel NiCr 2 O4 . Reoxidation leads to the oxidized structures NiO, NiCr 2 O4 , and NiCrO4.562KINETICS AND CATALYSIS V ol. 42 No. 4 2001BYCHKOV et al .modified by CuO, CeO 2 , and MnO 2 , which were stud-ied earlier in [1].EXPERIMENTALCatalysts prepared by the procedure described in [1]were tested in the reaction of carbon dioxide conver-sion of methane.TPR was carried out in a flow of the 6%H 2 + Ar mix-ture at a flow rate of 100 cm 3 /min using a thermal-con-ductivity detector. Heating was carried out at a rate of 12 ° C/min in the range 20–500 ° C. Water formed by the reduction was trapped by anhydrone.Before experiments, all samples were calcined in a flow of dry air at 500 ° C for 1 h. Air was used to remove water and possible organic impurities from the sam-ples. Preliminary treatment of samples was carried out in the same reactor in a way it was done before TPR runs. To switch the flows, a six-way valve was used.The amount of consumed hydrogen was determined from the area of the TPR peak with an accuracy of about ± 10%. The error in the determination of T max was ± 5°C . The final temperature in TPR was somewhat higher than 500°C ; this was determined by the capabil-ities of the temperature controller used in this work. We used in the study the samples calcined at 800°C and samples reduced in a flow of H 2 at800°C for 40 min.The chosen temperature of calcination corresponded to the temperature of catalytic reaction [1]. The reactor was loaded with a 0.3-g sample.TPD of O 2 and its adsorption (oxidation) on reduced catalysts was studied on the setup, which involved a DSC-111 (Setaram) differential scanning calorimeter and a system for chromatographic analysis of gaseous reactants and products. In the same setup, we measured the heats of catalyst reoxidation. Details of the proce-dure were described in [11]. To study oxygen adsorp-tion, the cell of a calorimeter was charged with a sam-ple (0.15 g), heated in a flow of air to 700°C and kept at this temperature for 30 min. Then, it was cooled in a flow of air to 50°C, which was replaced by a helium flow. The latter was used to remove excess oxygen from the reactor. Then, the sample was heated again in a flow of helium at a rate of 10°C/min to 710°C while with-drawing gas samples for analyses every 4 min. The chromatographic setup enabled the separation and detection of H 2, O 2, N 2, CO, CO 2, CH 4, and other gases.During TPD, only O 2 was evolved. Nitrogen adsorption and desorption was not observed. Therefore, air could be used as a source of O 2 in the oxidation of samples.To determine the extent of reduction, a 0.15-g sam-ple was charged into the calorimeter cell, heated to 700°C in a flow of air, kept at this temperature for 30 min, and successively replaced the flow of air by helium (30 min), 10%H 2–He (30 min), and helium again. Then, a series of air pulses were introduced at 7-min intervals into the helium flow. The conversion of oxygen and the evolution of heat were measured.The distribution of active elements in initial and reduced samples was studied by LXSA and SEM using a Cameca MBX-1M scanning X-ray micro analyzer.Scanning by an electron probe enabled us to enlarge the image of the sample surface. With this goal, we used secondary and reflected electrons and characteristic X-rays. The images thus obtained provided information on the quantities of phase components and their distri-bution over the sample bulk.Before the LXSA study of the sample, the whole amount of the catalyst was ground in a mortar and formed as a single pellet (1–4 g). Then, part of the pellet was ground and fractionated. The 0.25–0.50 mesh frac-tion (50 mg) was used in the catalytic tests. The rest of the pellet was divided into portions, 10–20 mg each,and used for quantitative analyses and TPR. Thus, all experiments were performed using the same big pellet.LXSA data refer to the distribution of Ni and Cr over the 20-µm subsurface layer (as in any X-ray fluores-cence analysis). The complete picture of distribution can be obtained by scanning the sample surface if the trajectories of scanning are close to each other (small-step scanning). For the quantitative analysis of the cat-alyst components, the absolute value of the intensity of a signal obtained from the test sample was compared with the signal from a standard, which was mounted on a holder in a spectrometer next to the sample. The anal-yses were accurate to 5–10%.SEM enabled us to draw conclusions on the compo-sition of the sample surface, because the areas enriched in any element (areas with different phase composi-tions) may have different contrasts. The X-ray fluores-cent analysis of these areas made it possible to check observations in the SEM mode, because the contrasts are sometimes due to morphological features of a parti-cle rather than to the phase composition.The specific surface area of the test samples was between 17 and 42 m 2/g (see [1]), and the dispersity was (4–9) × 10–6 cm (the size of primary particles)RESULTSTemperature-programmed reduction. The method of temperature-programmed reduction was used to study the forms of Ni in the catalysts. We assumed that the reduction of Ni at 800°C occurs not only in the phase of nickel oxide, but in the solid solution Ni x Mg 1 – x O as well (nickel that strongly interacts with the support).The oxidation of reduced sample should result in the formation of a separate phase of nickel oxide in a greater amount than in the initial sample (before reduction at 800°C ).TPR spectra of the catalysts are shown in Fig. 1 and Table 1. In the spectra of a NiO/MgO catalyst that con-tained 5% NiO without additives, there is a broad non-intense peak with T max at 190–260°C and a rapid growth of H 2 consumption is observed near 500°C . TheKINETICS AND CATALYSIS V ol. 42 No. 4 2001FORMATION OF THE Ni–CrO x /MgO AND Ni/MgO CATALYSTS 563second peak apparently continues at temperatures that are much higher than 500°C (Fig. 1b, spectrum 1).The TPR spectra of other samples usually have other peaks. An exception is the spectrum of the 6%NiO–2%Cr 2O 3–2%CeO 2/MgO sample, which vir-tually lacks the low-temperature peak. Thus, when cop-per oxide is added to the NiO–CeO 2/MgO system, a new peak with T max = 270°C appears in the spectrum,which is characteristic of supported copper reduction Cu 2+ 0 [12]. However, the extent of copperreduction is low at the same time (23%). The main partof copper oxide probably interacts with support more strongly and is reduced at higher temperatures. In the TPR spectra of samples containing chromium oxide, a maximum appears in the range 380–450°C , and the addition of CeO 2 virtually does not change the TPR picture. Note that the extents of reduction listed in Table 1 (as well as in Table 2) are based on Ni. In fact,we will show below that Cr and other elements also par-ticipate in redox processes.100200300400500(b)100200300400(‡)4321H 2 consumption, arb.u.123T , °CFig. 1. Temperature-programmed reduction of the catalyst at 20–500°C: (a) samples: (1) 3%NiO/MgO, (2) 3%NiO–0.25%Cr 2O 3/MgO (initial), (3) 5%NiO/MgO (reduced), and (4) 3%NiO–0.25%Cr 2O 3/MgO (reduced); (b) samples: (1) 5%NiO/MgO (initial), (2) mechanochemically activated 3%NiO/MgO, and (3) mechanical mixture 3%NiO + MgO.It is known that the temperature of supported oxide reduction is in many cases higher than that of the bulk oxide and depends on the strength of metal–support interaction. Thus, the reduction of nickel in the NiO/SiO2 system occurs at 400–500°C [13–15] although bulk nickel oxide is reduced at ~350°C. Therefore, we conclude that the main portion of nickel in all initial samples is at the state of strong interaction with MgO, probably in the form of the solid surface solution Ni x Mg1–x O formed after the high-temperature treatment during catalyst preparation.A broad low-temperature peak (150–260°C) in TPR spectra of the NiO/MgO samples can be associated with the existence of a small amount of finely dispersed bulk NiO, which is not bound to the support, or with a small amount of Ni2O3 formed after calcination at 800°C. As can be seen from Table 1, in the TPR spectra of preliminarily reduced samples containing 5 and 6%NiO have maxima at 380 and 380–500°C.The TPR spectrum of the mechanical mixture 3%NiO + MgO differs from both the spectrum of the supported 3%NiO/MgO catalyst and the spectrum of mechanically activated 3%NiO + MgO sample. The spectrum of the mechanical mixture shows only one peak at 400°C, which corresponds to the maximal extent of reduction (90%). This peak is absent from the spectra for the other catalysts and can reasonably be assigned to the reduction of the NiO phase to Ni. The spectrum of the mechanically activated 3%NiO + MgO sample contains three peaks and the overall extent of reduction is lower.Note that MgO used in this work contains the admixtures of CaO and transition metal oxides (1–2%). According to XRD data, the CaO admixture reacts with CrO3 in the initial Ni–Cr–O x/MgO sample and forms chromate CaCrO4 (~1%). Some small amount of H2 canbe consumed for the decomposition (or reduction) of transition metal oxide admixtures (the maximum at 360°C, see Table 1). However, the intensity of the peak with T max = 360°C in the spectrum of MgO is too low to allow the process on the support surface to account forKINETICS AND CATALYSIS V ol. 42No. 42001FORMATION OF THE Ni–CrO x/MgO AND Ni/MgO CATALYSTS565 the presence of intense maxima of H2 consumption inthe presence of Ni and Cr.The results of the study of the dependence of H2consumption maximum and the amount of consumedH2 on the concentration NiO at the constant concentra-tion of Cr2O3 (2%) and on the concentration of Cr2O3 atthe constant concentration of NiO (3%) are summa-rized in Table 2 and Fig. 2a. Figure 2b shows the depen-dence of the extent of reduction on the [Ni]/[Cr] ratio.As can be seen from these data, if [Ni] < [Cr] (sam-ples with a NiO concentration below 2%), the extent ofnickel reduction is high. In this case, the temperature ofcatalyst reduction (465°C) is close to T max in the spec-trum of the CrO x/MgO sample without nickel (470°C).Obviously, in this case the MgCrO4 chromate isreduced to MgCr2O4, NiCrO4 is reduced to Ni2Cr2O4,and the CaCrO4 admixture is reduced to CaCr2O4. Withan increase in the concentration of Cr2O3, the extent ofnickel reduction reaches the maximum correspondingto the NiCr2O4 phase. If the molar concentration of NiOis higher than the concentration of Cr2O3, then theextent of reduction substantially decreases (Table 2),and T max approaches the corresponding value for theNiO/MgO samples. With an increase in the NiO con-centration at a constant concentration of Cr2O3of 2%(Fig. 2a), the extent of nickel reduction decreases.The initial portion of the plot of the extent of nickelreduction vs. [Ni]/[Cr] (Fig. 2b) can be associated withthe participation of the admixture CaCrO4 phase inreduction. At [Ni] ≈ [Cr], the extent of reduction passes through a maximum. A further increase in the [Ni]/[Cr] ratio is accompanied by a linear decrease in the extent of Ni reduction. This can be explained by the dilution of the NiCrO4 phase by the Ni x Mg1–x O phase.An increase in the concentration of NiO at a con-stant Cr2O3 concentration results in a decrease in the T max, and an increase in the concentration of Cr2O3 at a constant NiO results in a small increase in T max.Thermal desorption of oxygen. Thermal desorption of oxygen (as well as the reoxidation of reduced sam-ples) can serve to estimate the extents of Ni and Cr reduction after the reductive treatment of a catalyst by[Ni]/[Cr], mol/mol [H2] × 104, mol/gFig. 2. Dependence of the amount of H2 consumed by thereduction of the Ni–Cr–O x/MgO catalyst (1) on the concen-tration of NiO at a constant concentration of Cr2O3 equal to2%, (2) on the concentration of Cr2O3 at a constant concen-tration of NiO equal to 3%, and (3) on the molar [Ni]/[Cr]ratio.KINETICS AND CATALYSIS V ol. 42No. 42001566KINETICS AND CATALYSIS V ol. 42 No. 4 2001BYCHKOV et al .hydrogen. Moreover, comparison of the TPD curves for Ni, Cr, and Ni–Cr samples enables the estimation of the efficiency with which Ni and Cr interact in the initial sample.Figure 3 and Table 3 show the results obtained in the TPD study of oxygen after the preliminary treatment of reduced catalysts by oxygen and sample reoxidation.Before the experiments on O 2 thermal desorption, all samples were treated similarly. In the experiments on the reoxidation of reduced samples, oxidation was car-ried out at different temperatures to determine the opti-mal conditions for experimentation.As follows from the data, the general trends in O 2adsorption and desorption on Ni/MgO generally corre-sponds to the picture of NiO/MgO reduction (Table 1).The ratio between the amounts of hydrogen involved in the reduction of various oxide catalysts (Tables 1 and 2)is approximately the same as the ratio between the amounts of oxygen involved in the reoxidation of the corresponding reduced samples (Table 3). The TPD curve of the 3%Ni/MgO sample has two peaks of O 2evolution, which correspond to weakly and strongly bound oxygen. The amount of oxygen consumed by reoxidation corresponds to the extent of nickel oxide reduction and constitutes several percent of the overall Ni amount. The amount of adsorbed oxygen increases in proportion to the concentration of NI. At the same time, the extent of reduction of NIO increases more rapidly than in proportion with an increase in the con-centration of Ni from 3 to 6%. This points to the fact that the extent of nickel reduction in the samples with low NiO concentrations is lower than in the samples with a higher concentration of NiO.The extent of reduction of the samples containing Cr, including the samples that also contain Ni (in TPR experiments), and the amount of adsorbed O 2 (in the experiments on O 2 thermal desorption) are much greater (more than by an order of magnitude) than the respective characteristics of the NiO/MgO samples.Therefore, we can conclude that supported chromium participates in the redox process. On the O 2 thermal desorption curve for the Cr 2O 3/MgO sample, there is a rapid ascent at ~500°C . On the curve for the NiO–Cr 2O 3/MgO catalyst, there are two jumps (Fig. 3), one of which corresponds to desorption from CrO 1.5/MgO and the other probably corresponds to the evolution of oxygen from the mixed Ni–Cr phase.Local X-ray spectral analysis and scanning electron microscopy. The studies using the LXSA and SEM methods were carried out using fresh samples and sam-ples treated in a flow of hydrogen at 800°C . As can be seen from Fig. 4, the uniform distribution of Ni is char-acteristic of the supported 3%NiO/MgO sample before and after reductive treatment. The average concentra-tion of Ni is 1–1.5% in the initial sample and 2−3% in the reduced sample. Thus, before reduction, the con-centration of Ni in the subsurface layer is lower than in the bulk. After reduction, the distributions of Ni are close.With an increase in the concentration of NiO in MgO to 5–6% (Fig. 5), the uniformity of distribution is disturbed: the islands of the active phase are formed.The concentration of Ni in these islands reaches0.005T , °C0.0100.0150.0200.0250.0300.035 O 2 desorption rate , µmol g –1 s–1Fig. 3. Thermal desorption of O 2 after its adsorption at 50°C on the catalysts: (1) 1.5%Cr 2O 3/MgO, (2) 3%NiO–1.5%Cr 2O 3/MgO, and (3) 3%NiO/MgO.KINETICS AND CATALYSIS V ol. 42 No. 4 2001FORMATION OF THE Ni–CrO x /MgO AND Ni/MgO CATALYSTS56715−25%, whereas the background concentration is 4 wt %, which is close to the average concentration in the sample. The size of islands is 10–20 µm according to XRD and SEM data. After reduction, the number of islands with an elevated concentration of NI increases,but the sizes decrease to 5–10 µm.The addition of 0.25 wt % Cr 2O 3 into the 3%NiO/MgO sample disturbs the uniform distribution of Ni. As follows from Fig. 6, in the presence of chro-mium, which is distributed rather uniformly, islands are formed in the sample. The concentration of nickel in these islands reaches 20 wt %, whereas the background concentration of Ni is ~2%. This is lower than the aver-age concentration of Ni in the sample (3%). According to the XRD and SEM data, the size of islands is ~10 µm. The distance between them is 15–20 µm. The reductive treatment results in enlarging the particles,while the distribution of chromium over the sample remains uniform, but its concentration somewhat increases (0.6% instead 0.4%).The study of the samples prepared by mechanochem-ical activation (Fig. 7) showed that Ni is distributed non-uniformly over these samples. The 3%NiO/MgO hasregions enriched in Ni up to 35 wt %, while the back-ground concentration is ~2%. The size of these regions ranges from 2 to 10 µm. The reduction of the sample at 800°C results in a partial agglomeration of Ni. As a result, the regions are formed on the surface,10–15 µm in size. This is seen as contrasts on the sec-ondary-electron microscopic images. The addition of chromium oxide does not change the distribution of NiO.DISCUSSIONNiO/MgO. As noted in [1], the catalytic systems of three types are the most active in carbon dioxide reform-ing of methane: NiO/MgO with a concentration of NiO higher than 5%, systems based on NiO–Cr 2O 3/MgO with a lower concentration of NiO, and mechanically activated mixtures of NiO and MgO. The data reported in this work obtained by different physicochemical methods show that these systems have many other com-mon features as well.Let us first consider the NiO/MgO catalysts obtained by impregnation. XRD and TPR studies3.02.52.01.51.00.5020406080Ni, wt %x , µm204050Ni, wt %x , µm3010(‡)(b)Fig. 4. Local X-ray spectrum of the 3%NiO/MgO catalyst: (a) before reduction and (b) after reduction. On the bottom: X-ray dif-fraction pattern of a 55 × 55 µm fragment. On the top: the distribution of nickel concentration over the middle line of the bottom figures.568KINETICS AND CATALYSIS V ol. 42 No. 4 2001BYCHKOV et al .30020405060Ni, wt %x , µm3010(c)252015105055020405060Mg, wt %x , µm30105045403530252015(b)(‡)IFig. 5. Local X-ray spectrum and electron microscopic patterns of the 5%NiO/MgO catalyst: (I) Ni and Mg before reduction, (II) Ni after reduction. (a) Scanning electron microscopic patterns of fragments with areas: (I) 55 × 55, (II, on the left) 110 × 110, (II, on the right) 55 × 55 µm fragment; (b) local X-ray spectra for the same fragments; (c) the distribution of nickel and magnesium con-centrations over the middle line of the figures.KINETICS AND CATALYSIS V ol. 42 No. 4 2001FORMATION OF THE Ni–CrO x /MgO AND Ni/MgO CATALYSTS569804080100120Ni, wt %x , µm6020(c)25020405060Ni, wt %x , µm3010(b)(‡)II765432120151050Fig. 5. (Contd.)570KINETICS AND CATALYSIS V ol. 42 No. 4 2001BYCHKOV et al .showed that the main part of Ni in the initial system belongs to the NiO–MgO composition, whose reduc-tion is difficult. TPR spectra (Fig. 1) point to the sub-stantial difference between the samples with NiO con-centrations of 3 and 4–6%. In the first case, only a high-temperature peak is observed (>550°C ), which proba-bly corresponds to the solid Ni x Mg 1 – x O solution.Reoxidation data (Fig. 3) point to the fact that only a small portion of Ni is oxidized and reduced. In the sec-ond case, the extent of NiO reduction to Ni is dispro-portionately high. The peak appears at moderate tem-peratures (380°C ), and preliminary heating in a flow of hydrogen leads to an increase in the amount of reducednickel. We may conjecture that the preliminary treat-ment with hydrogen at 800°C is favorable for Ni 2+reduction from the surface solid solution. During fur-ther oxidation by air at 500°C , metallic particles form the phase of supported NiO, whose reduction tempera-ture is lower than the temperature of nickel reduction from the solid solution.Earlier, we supposed that strongly oxidized forms of nickel (up to Ni 2O 3) are formed in the samples contain-ing small amounts of NiO. This assumption is sup-ported by calorimetric data (see Table 3). The heat of oxidation of NiO/MgO catalysts (305–340 kJ/mol O 2)is much lower than the value ∆H for the reaction 2Ni +O 2 = 2NiO (–479.4 kJ/mol O 2 [16]) and is close to ∆H for the reaction 4Ni + 3O 2 = 2Ni 2O 3 (–324 kJ/mol O 2).With an increase in the concentration of NiO, the heat of Ni oxidation becomes higher. This can be explained by a decrease in the number of nickel–oxygen clusters on the surface.The difference in the properties of supported 3%NiO/MgO and 6% NiO/MgO catalysts reveals itself when reaction (I) is carried out in the pulse mode. At 700°C , the transformation of reactants into CO and H 2on the 3%NiO/MgO catalyst is observed only in the first pulse of CO 2 + CH 4. Then, this transformation ceases. On the 6%NiO/MgO sample, this “poisoning”is much smaller. The 3% catalyst is reduced much harder than the 6% sample. Therefore, under the condi-tions of reaction (I), NiO completely transforms into the carbonate and metallic nickel, on which methane dissociates, is not formed.Data on the extent of Ni oxidation to NiO and on the extent of NiO reduction to Ni (see Tables 1 and 3) point to the high strength of oxygen binding to the metal in the samples where Ni belongs to the solid Ni x Mg 1 – x O solution. Therefore, when the concentration of NiO is lower than 4% (only solid solution) metallic nickel is not formed upon reduction, and the catalyst is inactive.According to LXSA and SEM data (Fig. 5), at a higher concentration of Ni, islands are formed, which are the clusters enriched in Ni 2+. Their reduction leads to the formation of metallic nickel microcrystals, which are responsible for the catalytic activity. These crystals are readily reoxidized.Thus, there is a correlation between the catalytic activity of the NiO/MgO samples with different NiO-to-MgO ratios and their susceptibility to reduction.Cr 2O 3/MgO. The TPR spectra of Cr 2O 3/MgO indi-cate that this catalyst is reduced by hydrogen at a higher temperature than NiO/MgO (470°C ). Judging from the amount of hydrogen used (see Table 1), the stoichiom-etry of reduction is such that the extent of reduction is higher than unity. Data on adsorption and desorption of O 2 on Cr 2O 3/MgO led us to the same conclusion (Fig. 3and Table 3). We suppose that the oxidation state ofchromium changes by three points: Cr 3+Cr6+. 6560555045403520406080100120Mg, wt %(‡)2520151050020406080100120Ni, wt %(b)1.61.2020406080100120Cr, wt %(c)x , µ m0.80.40–0.4Fig. 6. Distribution of (a) Mg, (b) Ni, and (c) Cr according to LXSA data for the 3%NiO–0.25%Cr 2 O 3 /MgO catalyst at the 110 × 110 µm fragment before reduction.。